Phosphorylation represents a ubiquitous and biologically critical post-translational modification (PTM) in proteins, serving as a fundamental regulator of cellular activities including signal transduction, cell cycle progression, and transcriptional control. Investigating phospho-signaling networks provides essential insights into protein functionality and intracellular communication. Technological advances have accelerated phosphoproteomics research, yielding specialized analytical resources for phosphorylation studies. This review summarizes key databases and computational tools to assist bioinformatics practitioners in phosphoproteome analysis.
Comprehensive knowledge base
1. PhosphoSitePlus
I. Database Overview
Developed by Cell Signaling Technology, PhosphoSitePlus (PSP) serves as the premier global knowledgebase for protein post-translational modifications (PTMs), with particular authority in phosphorylation research. The 2023 release (v6.7) documents >1.4 million PTM sites across 18 species, including 547,000+ experimentally verified phosphorylation sites.
II. Core Data Composition
1. Modification Site Landscape
- PTM Distribution:
- Phosphorylation (S/T/Y): 85%
- Acetylation: 8% | Ubiquitination: 5% | Methylation: 2%
- Species-Specific Phosphorylation Data:
| Species | Phosphosites | Kinase-Substrate Pairs |
|---|---|---|
| Human | 547,328 | 128,765 |
| Mouse | 289,451 | 87,432 |
| Rat | 153,827 | 45,219 |
2. Evidence-Based Annotation
- Validation Tiers:
- Gold (≥3 independent experiments)
- Silver (2 publications or 1 publication + preprint)
- Bronze (computational prediction/single low-throughput result)
- Functional Dimensions: Kinase regulation • Signaling pathways • Disease associations • Structural impacts • Drug responses
III. Analytical Capabilities
Multifaceted Query System
- Search by: Gene/protein identifier (UniProt ID) • Modified residue (e.g., EGFR Y1068) • Disease association • Experimental verification method
Kinase-Substrate Network Analysis
- Data sources: Literature curation (300k+ pairs) • In vitro kinase assays (50k+) • Structural evidence (3k+ complexes)
- Visualization: Interactive substrate mapping (example: CDK1 network)
Clinical Integration
- Incorporated datasets: TCGA pan-cancer phosphoproteomics (32 malignancies) • CPTAC proteomics • DrugBank target therapeutics
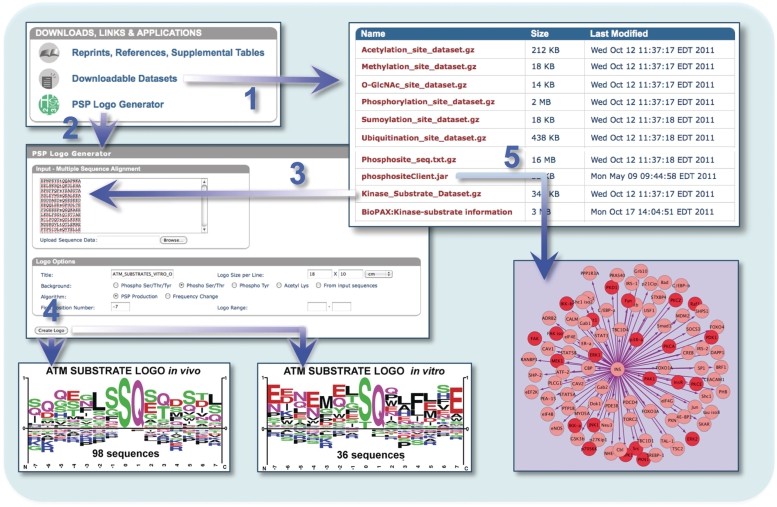 Download results (Hornbeck PV et al., 2012)
IV. Quality Assurance Protocols
- Update Cycle: Quarterly releases with manual curation by 12 PhD scientists
- Data Ingestion: Automated PubMed/preprint monitoring + expert validation
- Verification Standards:
- MS data: FDR<1%
- Antibody validation: Western blot + IP concordance
- Structural data: Resolution ≤3.0Å
Url: http://www.phosphosite.org/
2. PhosphoELM
I. Database Scope & Value Proposition
Developed by EMBL, PhosphoELM specializes in cataloging eukaryotic phosphorylation sites within functional linear domains. The current release (v9.0) documents 328,747 experimentally verified phosphosites across 12 species, covering 62% of characterized eukaryotic proteomes.
II. Data Architecture
1. Core Datasets
| Data Type | Entries | Verification Method |
|---|---|---|
| Phosphosites | 328,747 | MS/biochemical validation |
| Linear Domains | 4,821 | SH3, PDZ, WW, etc. |
| Kinase-Substrate Pairs | 56,892 | Includes Kcat/Km kinetics |
2. Species Distribution
- Human: 203,823 sites (62%)
- Mouse: 68,451 sites (21%)
- Yeast: 29,774 sites (9%)
- Other species: 26,699 sites (8%)
III. Functional Modules
Linear Domain Classification
- Protein interaction modules (SH3/WW/PDZ)
- Nuclear localization signals (NLS)
- Degradation motifs (D-box/KEN-box)
Domain-Phosphorylation Integration
- Spatial mapping of phosphosite density within domains
- Cross-species conservation filtering (>80% threshold)
Regulatory Dynamics
- Phosphorylation modulates:
- → SH3 domain binding affinity
- → 14-3-3 recognition capacity
- → SCF complex-mediated degradation
IV. Quality Control Framework
- Evidence Tiers:
- Class A: ≥2 independent MS studies
- Class B: MS + biochemical validation
- Class C: In vitro kinase assay only
- Structural Validation:
- Crystal structures: ≤2.5Å resolution
- NMR data: NOE distance constraints required
Url: http://phospho.elm.eu.org/
3. dbPAF
I. Database Positioning and Characteristics
Developed by the Shanghai Institute of Life Sciences (Chinese Academy of Sciences), dbPAF (Database of Protein Acetylation and Phosphorylation) serves as a specialized repository focusing on protein acetylation (Ac) and phosphorylation (Phos) crosstalk networks. Its current version (v4.2) catalogs modification sites across eight species, totaling 1,287,456 entries. This includes 38,927 protein-specific dual-modification pairs, offering unique insights into post-translational modification "cross-talk."
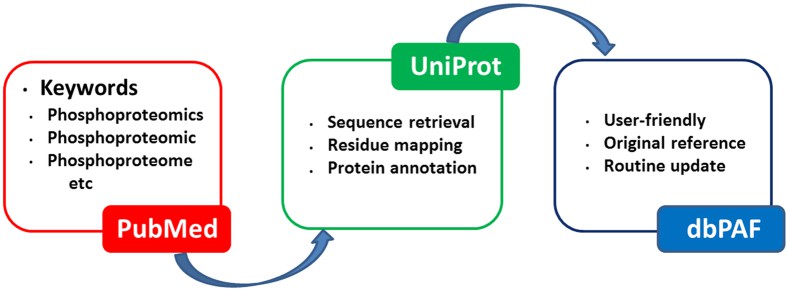 The procedure for the construction of dbPAF database (Ullah S et al., 2016)
II. Core Data Architecture
- Modification Landscape
- Acetylation sites: 682,415 entries (subtypes: Kac, Ksu)
- Phosphorylation sites: 605,041 entries (Ser/Thr/Tyr distributions)
- Ac-Phos dual-modified proteins: 12,873 identified
- Species and Tissue Distribution
- Tumor tissues (48%)
- Normal tissues (32%)
- Cell lines (15%)
- Body fluids (5%)
III. Key Functional Modules
Cross-Modification Analysis
- Regulatory relationships include:
- Sequential modifications (e.g., Ac→Phos)
- Competitive modifications (identical sites)
- Allosteric regulation (distal sites)
3D Structural Integration
- Features demonstrated:
- Solvent accessibility (ASA values) at modification sites
- Conformational changes induced by acetylation/phosphorylation (δΔRMSD)
Disease Association Networks
- Exemplified pathway:
- KAT5 acetylation → ATM phosphorylation → DNA damage repair → Phenotypic outcomes (chemosensitivity / radiotherapy resistance)
IV. Data Quality Framework
- Evidence Levels:
- Level 1: Mass spectrometry + functional validation (12%)
- Level 2: Mass spectrometry exclusively (63%)
- Level 3: Predictive results (25%)
- Clinical Data Sources:
- CPTAC tumor proteomes (23 cancer types)
- HPA normal tissue atlas
- CCLE cell line datasets
Url: http://dbpaf.biocuckoo.org/
Core Signal Pathway Resources
1. NetworKIN
I. Functionality and Technical Framework
NetworKIN employs an integrative machine learning approach, utilizing a three-tiered predictive architecture for high-accuracy kinase-substrate mapping:
- Primary prediction: Sequence motif analysis via NetPhorest (628 kinases)
- Secondary refinement: Domain interaction scoring (DOMINO database)
- Tertiary integration: Protein network constraints (STRING v11)
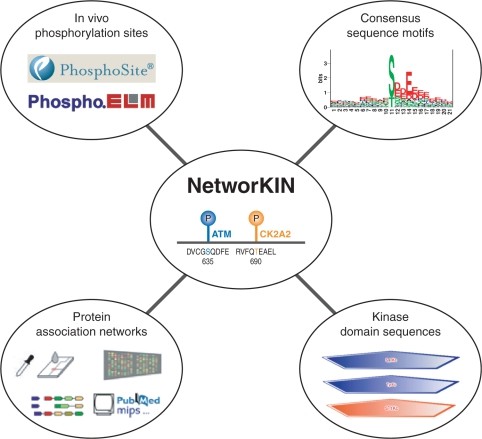 Overview of the NetworKIN resource (Linding R et al., 2008)
Ⅱ. Key Parameters and Outputs
| Parameter | Recommended Setting | Output Visualization |
|---|---|---|
| Species | Human/Mouse | Kinase activity heatmap (Z-score) |
| Confidence threshold | ≥0.7 | Substrate network (Cytoscape compatible) |
| Tissue specificity | Enabled | Pathway enrichment bubble chart (27 tissues) |
2. SIGNOR: Causal Relationship Repository
I. Data Architecture Features
- Relationship taxonomy:
- Activation via phosphorylation (→+)
- Inhibition through phosphorylation (→-)
- Dephosphorylation events (⊣)
- Evidence grading:
- Experimentally validated (gold-standard)
- Computational predictions (gray-scale)
Ⅱ. Visualization Capabilities
- Custom node addition functionality
- SBGN-format export for CellDesigner integration
Url: https://signor.uniroma2.it/
3. PhosphoPath: Oncology Pathway Activity Quantification
I. Algorithmic Framework
- Pathway Activity Score = Σ( wᵢ × pᵢ ) / T
- Where:
- wᵢ: Phosphosite weighting (citation-based)
- pᵢ: Phosphorylation level (log2FC)
- T: Pathway-specific normalization factor
Ⅱ. Tumor-Type Coverage
| Malignancy | Sample Count | Analyzable Pathways |
|---|---|---|
| Breast cancer | 1,218 | 32 |
| Lung cancer | 987 | 28 |
| Colorectal cancer | 756 | 25 |
4. Comparative Tool Assessment
| Dimension | NetworKIN | SIGNOR | PhosphoPath |
|---|---|---|---|
| Primary function | Kinase target identification | Causal mechanisms | Clinical prognostic modeling |
| Update frequency | Annually | Quarterly | Biannually |
| Input format | Phosphosite lists | Gene/protein identifiers | Phosphorylation matrices |
| Output format | Network graphs | Causal diagrams | Risk score tables |
| Clinical utility | Drug target prediction | Combination therapy design | Patient stratification |
Url: http://github.com/linseyr/PhosphoPath
Select Service
Learn more
Clinical Phosphoproteomics Databases
1. CPPA: Pan-Cancer Phosphoproteome Atlas
I. Database Architecture
- Data Scope:
- 32 cancer types
- 25,619 tumor specimens
- 150,000 quantified phosphosites
- Functional Modules: Integrates TCGA data, drug response profiles, and survival association analytics
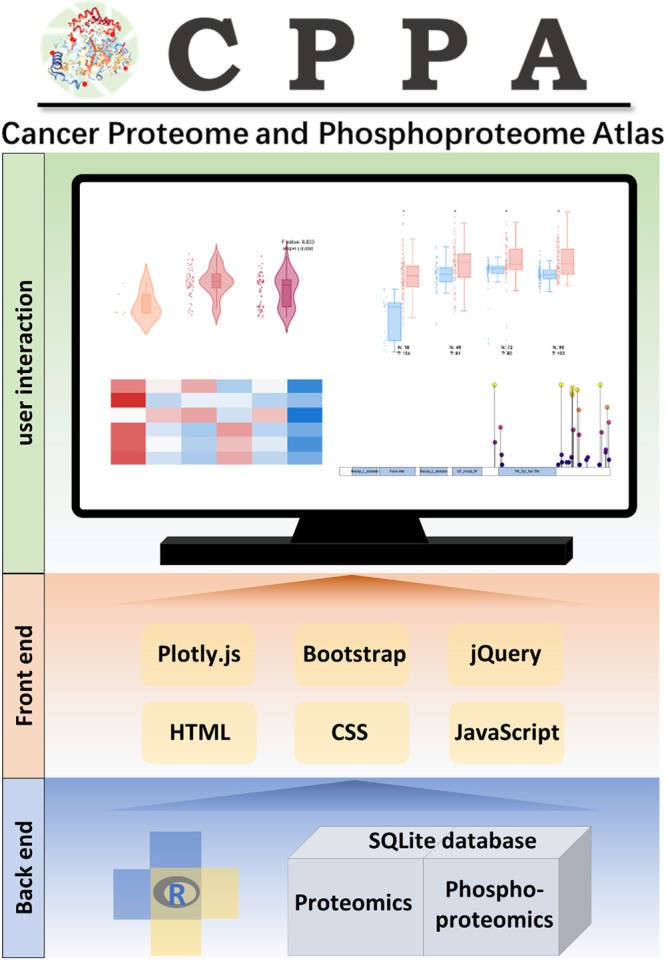 Schema describing data processing and data display for the CPPA web tool (Hu GS et al., 2023)
Ⅱ. Application Workflow
- Biomarker Identification:
- Select malignancy (e.g., lung adenocarcinoma)
- Apply differential thresholds (Fold Change > 2; p < 0.01)
- Export candidate phosphosites (CSV format)
Ⅲ. Data Access
- Interactive online heatmap analyzer
- Batch downloads via JSON-formatted API
- R package CPPAnalyzer (differential analysis)
2. AD PhosphoAtlas: Neurodegenerative Disease Resource
Ⅰ. Data Composition
| Brain Region | Samples | Technology |
|---|---|---|
| Prefrontal cortex | 287 | DIA-MS |
| Hippocampus | 198 | TMT-MS |
| Cerebrospinal fluid | 156 | PRM-MS |
Ⅱ. Marker Discovery Pipeline
- Sample selection → 2. Analytical module →
- Braak stage correlation
- Aβ/tau co-localization
- Treatment response prediction
4. Comparative Database Evaluation
| Dimension | CPPA | Phaos | AD PhosphoAtlas |
|---|---|---|---|
| Primary focus | Pan-cancer analysis | Single-cell resolution | Neurodegenerative specificity |
| Data currency | 2023 release | 2024 updated | 2022 version |
| Download formats | CSV/JSON | H5AD | XML/TXT |
| Analysis tools | R package | Python library | Web platform |
| Clinical relevance | Early diagnosis | Resistance mechanisms | Therapeutic targeting |
Url: http://adni.loni.usc.edu/
Phosphoproteomics Mass Spectrometry Engines
1. MaxQuant: Benchmark Solution for DDA Analysis
I. Core Architecture & Technical Capabilities
- Workflow: Raw MS data → Feature detection → Database search → Label-free quantification (LFQ) → Phosphosite localization
- Phosphorylation-Specific Features:
- Neutral loss-triggered MS3 scanning (-98/-49 Da)
- Integrated PTM localization probability scoring
- ETD/HCD hybrid fragmentation compatibility
Ⅱ. Clinical Research Applications
| Application | Parameter Settings | Output |
|---|---|---|
| Biomarker discovery | Match-between-runs enabled | 40% missing value reduction |
| Kinase activity | Variable modification: Phospho (STY) | Substrate networks |
| Drug response | LFQ intensity threshold >10⁵ | Time-resolved phosphorylation profiles |
Ⅲ. Performance Metrics
- Processing: ~4 hours per 1-hour run (CPU mode)
- Localization accuracy: 92% (Ser/Thr)
- Quantitative reproducibility: CV<15%
Note: v2.1 integrates AlphaFold2 structural constraints for adjacent site resolution
Url: https://www.maxquant.org/
2. FragPipe: Cloud-Optimized High-Throughput Platform
Ⅰ. Technological Innovations
- Analysis Suite:
- Philosopher quantitation (MS1 accuracy 0.1ppm)
- PTMProphet localization (ion mobility-integrated)
- DeepLC retention time prediction
Ⅱ. Large-Scale Clinical Analysis
| Step | Traditional Tools | FragPipe |
|---|---|---|
| Database search | 8 hours | 1.5 hours |
| Phosphosite mapping | 6 hours | 45 minutes |
- Unique Features:
- Automated clinical reports (PDF/HTML)
- Direct CPTAC database integration
Ⅲ. Interface Features:
- Drag-and-drop experimental design
- Real-time compute node monitoring
- One-click result export
Url: https://fragpipe.nesvilab.org/
3. DIA-NN: Deep Learning-Driven DIA Deconvolution
Ⅰ. Neural Network Architecture
Raw spectra → Feature extraction → Noise filtering → Spectral library matching → Quantitative output
- Phospho-Optimized Modules:
- Phosphofragment ion weighting (1.8×)
- Dynamic collision energy adjustment (HCD+5%)
- Isomer separation (ΔCCS>0.3%)
Ⅱ. Clinical Translation Workflow:
- Build disease-specific spectral library (≥20 samples)
- Enable --phospho mode
- Apply FDR<1% threshold
- Performance by Sample Type:
| Sample | Detected Sites | CV |
|---|---|---|
| Tissue (1μg) | 12,458 | 9.7% |
| Plasma (200μL) | 3,827 | 14.3% |
| Single-cell | 672 | 28.5% |
Ⅲ. Recent Advancements (v1.8):
- 4D-DIA compatibility
- Phosphorylation flux analysis module
- MALDI imaging data support
Url: https://github.com/vdemichev/DiaNN
4. Comparative Decision Guide
| Dimension | MaxQuant | FragPipe | DIA-NN |
|---|---|---|---|
| Optimal data type | DDA | Large-scale DDA | All DIA formats |
| Core strength | Method maturity | Cloud scaling | Deep learning precision |
| Learning curve | Moderate (GUI) | Simple (automated) | Steep (CLI) |
| Clinical use | Basic research | Multi-center | Precision medicine |
| Hardware | 16-core CPU | Cloud cluster | GPU acceleration |
Phosphosite Localization Tools
1. PhosphoRS: Conventional Probabilistic Framework Benchmark
Core Characteristics
- Bayesian Framework:
Computes site confidence using classical probability models integrating:- Fragment ion match quality
- Neutral loss signals
- Isotopic distribution patterns
Outputs localization probabilities (0-1 scale)
- Technical Advantages:
- Platform-agnostic algorithm stability
- Rapid processing (<5 minutes per sample average)
- Native integration with MaxQuant and other platforms
Url: https://www.maxquant.org/
2. ptmRS: Machine Learning-Driven Engine
Innovative Architecture
- Multimodal Learning System: Integrates mass spectra fragments, ion mobility (CCS values), and retention time data → Random forest classifier → Confidence scoring
- Continuous Improvement: Dynamic training set updates
Performance Advantages:
- 40% enhanced Ser/Thr adjacent site resolution
- Native 4D-DIA data compatibility
- Tumor tissue-optimized model (96% sensitivity)
Url: https://ms.imp.ac.at/index.php?action=ptmrs
3. Ascore: Chemical Heuristics Standard
Methodological Value
- Neutral Loss Enhancement:
Ion-type specific weighting:
| Ion Type | Neutral Loss | Weight | Priority Boost |
|---|---|---|---|
| b-ions | -98 Da | 1.8× | +15% |
| y-ions | -49 Da | 1.5× | +12% |
| 2+ ions | - | 2.2× | +18% |
Technical Features:
- ETD/ECD fragmentation specialization
- Ultra-rapid processing (>1,000 spectra/sec)
- Integer-based intuitive scoring
Url: Plug-in for Proteome Discoverer
4. Comparative Analysis & Selection Guidelines
| Dimension | PhosphoRS | ptmRS | Ascore |
|---|---|---|---|
| Optimal use case | Routine DDA | Clinical precision | Chemical crosslinking |
| Methodological strength | Probabilistic robustness | Machine learning accuracy | Rule-based clarity |
| Data requirements | General LC-MS/MS | Ion mobility data | ETD/ECD data |
| Output format | Probability (0-1) | Confidence (0-100) | Integer score |
| Processing speed | Fast | Moderate | Very fast |
Optimized Phosphoproteomics Workflow Guidelines
1. Data Processing Recommendations
- DDA Analysis: Utilize MaxQuant + PhosphoRS pipeline for proven stability
- DIA Analysis: Employ DIA-NN with -phospho flag for maximal sensitivity
2. Functional Annotation Protocols
- Kinase Prediction: Prioritize NetworKIN (2× substrate coverage vs. KEA3)
- Structural Impact: Integrate AlphaFold2 models via Phos3D
3. Visualization Strategies
| Level | Tool Combination | Output Format |
|---|---|---|
| Pathway | PhosphoPath + Reactome | Dynamic signaling reports |
| Molecular | iPhos | Structural microenvironment rendering |
4. Clinical Translation Essentials
- Tumor Data Validation: Mandatory CPPA database verification to prevent in vitro artifacts
- Temporal Dynamics: Apply PECA algorithm to detect signaling hysteresis effects
How to use R language and tools to analyze data, please refer to "How to Analyze Phosphoproteomics Data with R and Bioinformatics Tools".
References
- Hornbeck PV, Kornhauser JM, Tkachev S, Zhang B, Skrzypek E, Murray B, Latham V, Sullivan M. "PhosphoSitePlus: a comprehensive resource for investigating the structure and function of experimentally determined post-translational modifications in man and mouse." Nucleic Acids Res. 2012 Jan;40(Database issue):D261-70. doi: 10.1093/nar/gkr1122
- Ullah S, Lin S, Xu Y, Deng W, Ma L, Zhang Y, Liu Z, Xue Y. "dbPAF: an integrative database of protein phosphorylation in animals and fungi." Sci Rep. 2016 Mar 24;6:23534. doi: 10.1038/srep23534
- Linding R, Jensen LJ, Pasculescu A, Olhovsky M, Colwill K, Bork P, Yaffe MB, Pawson T. "NetworKIN: a resource for exploring cellular phosphorylation networks." Nucleic Acids Res. 2008 Jan;36(Database issue):D695-9. doi: 10.1093/nar/gkm902
- Raaijmakers LM, Giansanti P, Possik PA, Mueller J, Peeper DS, Heck AJ, Altelaar AF. "PhosphoPath: Visualization of Phosphosite-centric Dynamics in Temporal Molecular Networks." J Proteome Res. 2015 Oct 2;14(10):4332-41. doi: 10.1021/acs.jproteome.5b00529
- Hu GS, Zheng ZZ, He YH, Wang DC, Liu W. "CPPA: A Web Tool for Exploring Proteomic and Phosphoproteomic Data in Cancer." J Proteome Res. 2023 Feb 3;22(2):368-373. doi: 10.1021/acs.jproteome.2c00512


