Vitamin C Analysis Service
Vitamin C is highly unstable, leading to oxidation and nutrient loss in your products. Our advanced UHPLC-MS/MS and HPLC-based services accurately quantify AA, DHA, and derivatives, helping you achieve compliance and quality assurance without guesswork.
- Optimize food and beverage shelf-life
- Validate pharmaceutical formulations
- Authenticate cosmetic actives
- Support plant and biological research
Start your stability study today!
Submit Your Request Now
×
What You Receive::
- Raw & processed data files
- Calibration curves & QC summary
- Chromatograms & AA/DHA ratios
- Customized interpretation report
- What We Provide
- Advantages
- Technology Platform
- Sample Requirement
- Demo
- FAQ
What is Vitamin C?
Vitamin C (ascorbic acid, AA) is a redox-active cofactor that stabilizes collagen cross-linking, maintains iron and copper in catalytically active states, and quenches reactive oxygen species in food, pharma, and biological matrices. Its intrinsic instability—rapid oxidation to dehydroascorbic acid (DHA) and further breakdown to diketogulonic acid—demands precise, time-sensitive quantification from sampling through reporting.
Why Quantify Vitamin C?—Decision-Critical Scenarios Our Clients Face
| Your Business Question | How Accurate Vitamin C Analytics Unlock Better Decisions |
|---|---|
| Reformulating a beverage for extended shelf life | Track AA/DHA ratios to prove oxidative stability under accelerated storage tests. |
| Verifying label claims or regulatory compliance | Generate defensible certificates showing ±2 % accuracy across 1–1,000 µg mL⁻¹. |
| Profiling plant or microbial strains for metabolic engineering | Map intracellular Vitamin C flux together with redox-coupled metabolites. |
| Optimizing pharmaceutical dosage forms | Characterize ascorbyl derivatives (e.g., AAP, palmitate) to confirm pro-drug purity and conversion. |
Creative Proteomics Vitamin C Analysis Solutions
Quantitative Analysis of AA & DHA
- Sensitive detection of reduced and oxidized forms using UHPLC-MS or ECD-based HPLC
- Ratio-based insights for oxidative stability and bioavailability studies
Degradation Pathway Mapping
- Measurement of intermediate oxidation products like 2,3-diketogulonic acid
- Ideal for stress-testing under thermal or oxidative conditions
Ester and Analog Quantification
Ascorbyl palmitate, phosphorylated derivatives, and isoascorbic acid quantified for formulation studies.
What We Measure—Comprehensive Vitamin C Panel
| Analyte Name | CAS Number | Category | Detection Range (ng/mL) | LOD (Limit of Detection) |
|---|---|---|---|---|
| Retinol | 68-26-8 | Preformed Vitamin C | 0.5 – 1,000 | 0.1 ng/mL |
| Retinyl Palmitate | 79-81-2 | Retinyl Ester | 1 – 5,000 | 0.5 ng/mL |
| Retinyl Acetate | 127-47-9 | Retinyl Ester | 1 – 5,000 | 0.5 ng/mL |
| Retinaldehyde (Retinal) | 72-93-5 | Aldehyde Form | 1 – 2,000 | 0.5 ng/mL |
| All-trans Retinoic Acid | 302-79-4 | Active Retinoid | 1 – 1,000 | 0.2 ng/mL |
| 13-cis Retinoic Acid | 4759-48-2 | Isomeric Retinoid | 1 – 1,000 | 0.2 ng/mL |
| 9-cis Retinoic Acid | 514-78-3 | Isomeric Retinoid | 1 – 1,000 | 0.2 ng/mL |
| β-Carotene | 7235-40-7 | Provitamin A | 10 – 10,000 | 1 ng/mL |
| α-Carotene | 7488-99-5 | Provitamin A | 10 – 10,000 | 1 ng/mL |
| γ-Carotene | 7498-55-3 | Provitamin A Variant | 10 – 10,000 | 1 ng/mL |
| Lycopene | 502-65-8 | Carotenoid | 10 – 10,000 | 1 ng/mL |
| Cryptoxanthin | 472-70-8 | Provitamin A | 5 – 5,000 | 1 ng/mL |
| Retinyl Propionate | 5808-35-7 | Retinyl Ester | 1 – 5,000 | 0.5 ng/mL |
| Retinyl Stearate | 6106-24-7 | Retinyl Ester | 1 – 5,000 | 0.5 ng/mL |
| 11-cis Retinal | 17414-05-2 | Retinoid Intermediate | 1 – 1,000 | 0.2 ng/mL |
Distinct Advantages of Our Vitamin C Analysis Services
- Sub-ppm Sensitivity: Limits of quantitation down to 10 ng mL⁻¹ for AA (signal-to-noise ≥ 10).
- Linearity You Can Trust: r² ≥ 0.999 across three orders of magnitude, verified every 20 injections.
- Repeatability that Cuts Re-runs: Intra-batch %RSD < 3 % (n = 6) for peak area and retention time.
- True Recovery Verification: Spike-and-recovery of fortified blanks: 95 – 105 % for AA and DHA.
- Minimal Matrix Interference: Isotope-dilution MS corrects ion suppression within ±5 %.
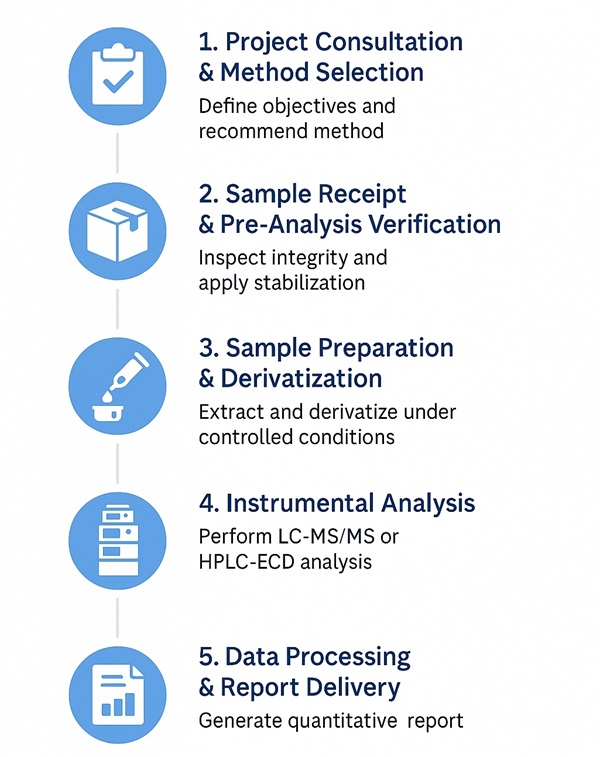
Workflow for Vitamin C Analysis Service
Step 1. Project Consultation & Method Selection
- Define analytical objectives (quantification, derivative profiling, or stability study)
- Recommend optimal method: UHPLC-MS/MS, HPLC-ECD, or combined platform
Step 2. Sample Receipt & Pre-Analysis Verification
- Inspect sample integrity and verify storage conditions
- Apply antioxidant stabilization protocols to minimize Vitamin C degradation
Step 3. Sample Preparation & Derivatization
- Homogenization and extraction under cold, light-protected conditions
- Optional derivatization for DHA stabilization using o-phenylenediamine (OPDA) or equivalent reagents
Step 4. Instrumental Analysis
- Ultra-high performance liquid chromatography coupled with triple quadrupole MS or electrochemical detection
- Multi-point calibration (r² ≥ 0.999) and isotope-labeled internal standards ensure accuracy
Step 5. Data Processing & Report Delivery
- Quantitative results with AA/DHA ratio, degradation profile, and derivative levels
- Comprehensive report includes chromatograms, calibration curves, and interpretation guidance
Technology Platform for Vitamin C Analysis Service
| Analytical Method | Instrument Model | Key Conditions | Highlight Features |
|---|---|---|---|
| UHPLC-MS/MS (Gold Standard) | Thermo Fisher Vanquish + TSQ Altis Triple Quadrupole | C18 column (2.1 × 100 mm, 1.7 µm), 0.1% formic acid in water/methanol; ESI+; MRM mode | Ultra-sensitive quantification of AA and DHA; LOQ down to 10 ng/mL |
| UHPLC-HRMS (Structural Profiling) | Thermo Scientific Vanquish + Q Exactive Orbitrap | Gradient separation; Full MS + PRM | Confirms degradation products and derivative identity with accurate mass |
| HPLC-ECD (High Specificity) | Antec DECADE Elite Electrochemical Detector | HILIC column; acetate buffer | Electrochemical detection minimizes matrix interference; ideal for AA/DHA |
| HPLC-UV (Routine Analysis) | Shimadzu LC-20A with SPD-20A UV Detector | C18 RP column; detection at 254 nm | Cost-effective solution for high-throughput QC testing |
| Ion Chromatography (Optional) | Dionex ICS-5000+ | Ion-exchange column; citrate buffer; PDA detection | Direct analysis without derivatization; robust for high-salt matrices |
Vitamin C Analytical Methods Performance Comparison
| Method | Instrument Model | Detection Limit (LOQ) | Linearity (r²) | Repeatability (RSD%) |
|---|---|---|---|---|
| UHPLC-MS/MS | Thermo Vanquish + TSQ Altis | 0.01 µg/mL (10 ng/mL) | ≥ 0.999 across 0.01–1,000 µg/mL | < 3% |
| UHPLC-HRMS | Vanquish + Q Exactive Orbitrap | 0.05 µg/mL | ≥ 0.999 across 0.05–1,000 µg/mL | < 4% |
| HPLC-ECD | Antec DECADE Elite | 0.02 µg/mL | ≥ 0.998 across 0.02–500 µg/mL | < 3% |
| HPLC-UV | Shimadzu LC-20A | 0.10 µg/mL | ≥ 0.997 across 0.1–500 µg/mL | < 5% |
| Ion Chromatography (PDA) | Dionex ICS-5000+ | 0.20 µg/mL | ≥ 0.996 across 0.2–500 µg/mL | < 5% |
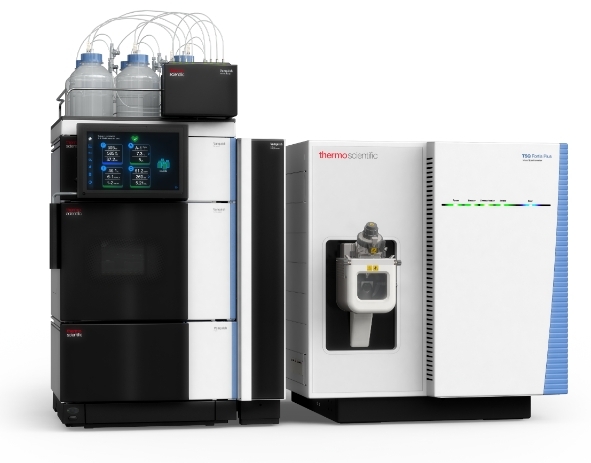
Thermo Fisher Vanquish + TSQ Altis Triple Quadrupole
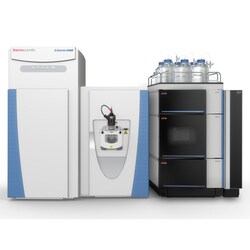
Q Exactive™ UHMR Hybrid Quadrupole Orbitrap™ Mass Spectrometer
Sample Requirements for Vitamin C Analysis Service
| Sample Type | Minimum Amount Required | Recommended Conditions |
|---|---|---|
| Fruit or Vegetable Tissue | 5 g | Freeze immediately at −80 °C after homogenization; protect from light |
| Plant Leaves or Roots | 1–2 g | Store in liquid nitrogen or at −80 °C; avoid repeated freeze-thaw |
| Food Products (Juices, Powders, Beverages) | 10 mL or 5 g | Store at 4 °C for short term (<24h); −20 °C for longer storage |
| Pharmaceutical Formulations (Tablets, Capsules) | 5 units or 500 mg | Protect from moisture; store at room temperature in light-proof container |
| Biological Fluids (Plasma, Serum) | 200 µL | Stabilize with antioxidant (e.g., metaphosphoric acid) immediately upon collection |
| Fermentation Broth / Cell Culture Media | 2 mL | Collect under cold conditions; freeze at −80 °C |
| Cosmetic Products (Creams, Lotions) | 3 g | Seal tightly; avoid exposure to light and heat |
Tip: Always use amber vials or wrap samples in aluminum foil to prevent oxidation during shipping.
Demo Results
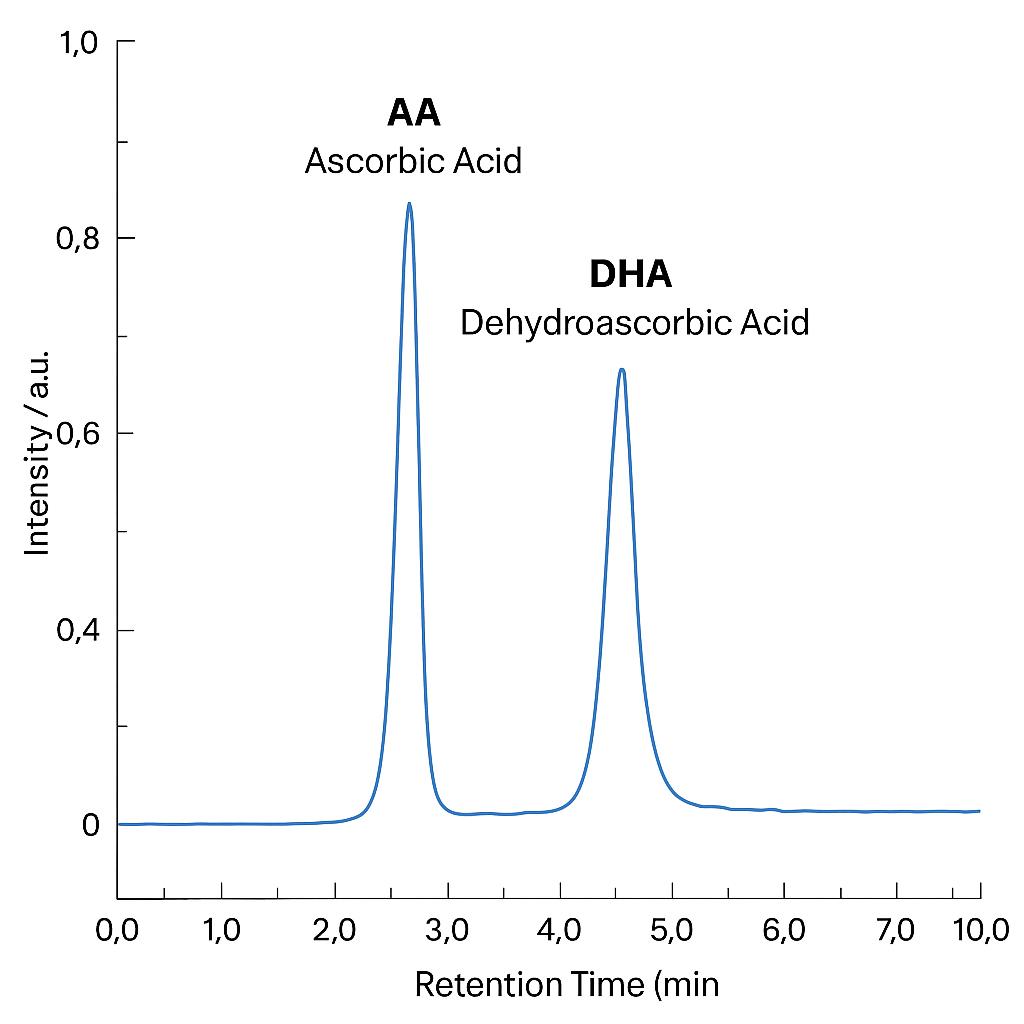
Figure 1. Representative chromatogram showing clear separation of ascorbic acid (AA) and dehydroascorbic acid (DHA).
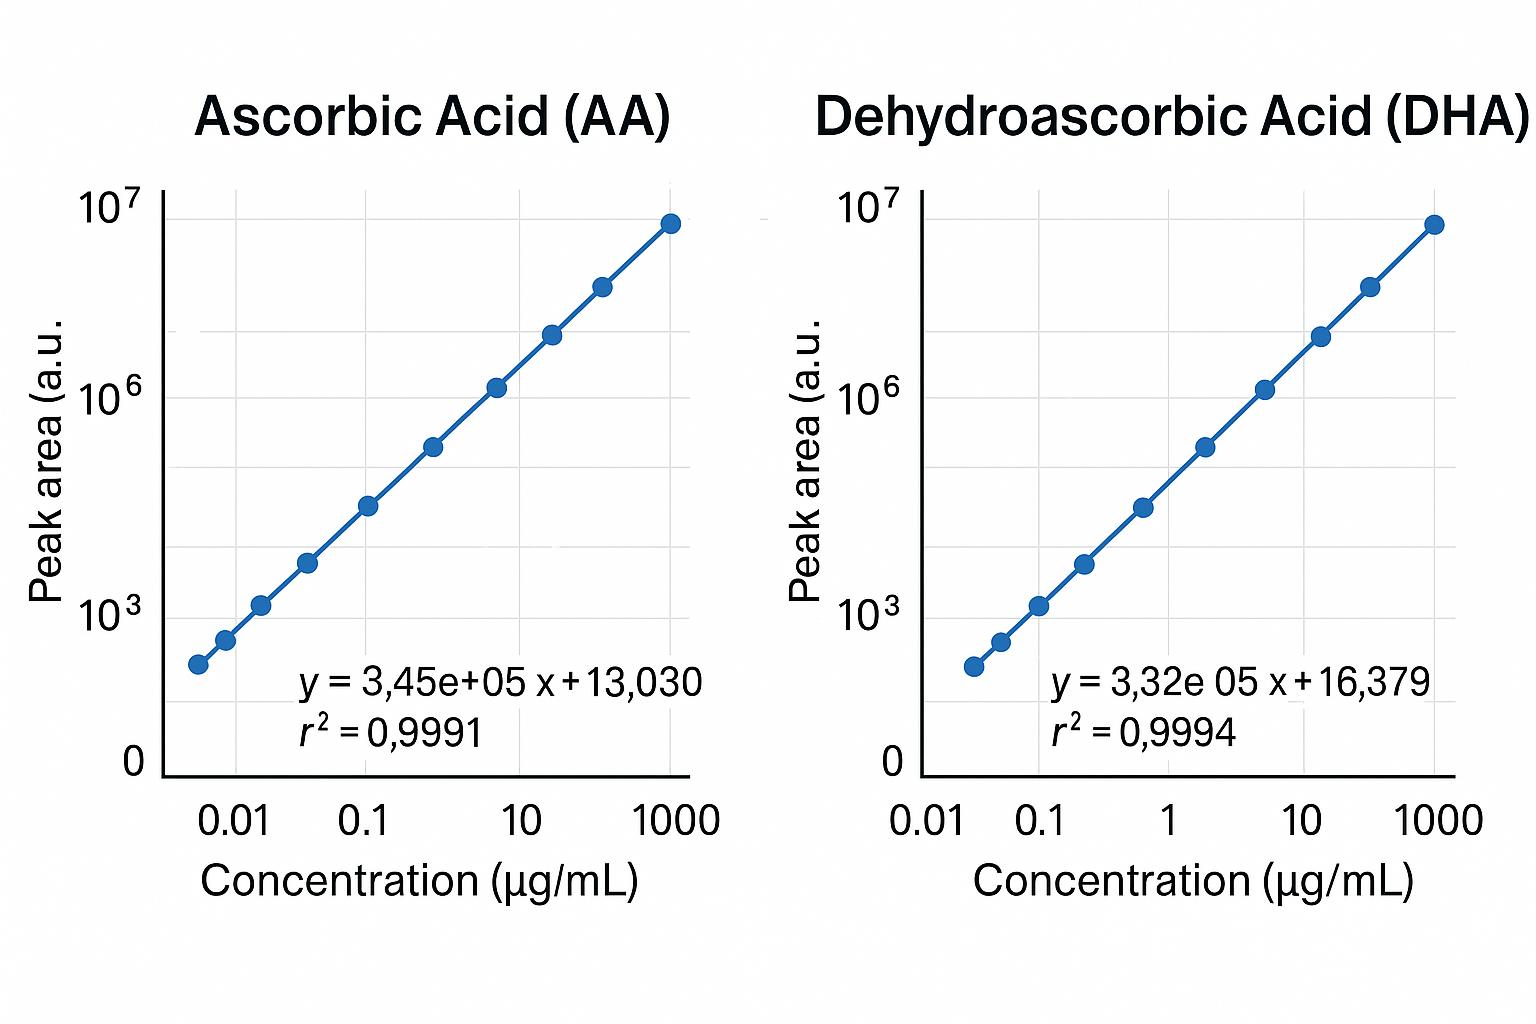
Figure 2. Calibration curves for ascorbic acid (AA) and dehydroascorbic acid (DHA) showing excellent linearity (r² ≥ 0.999) across 0.01–1000 µg/mL.
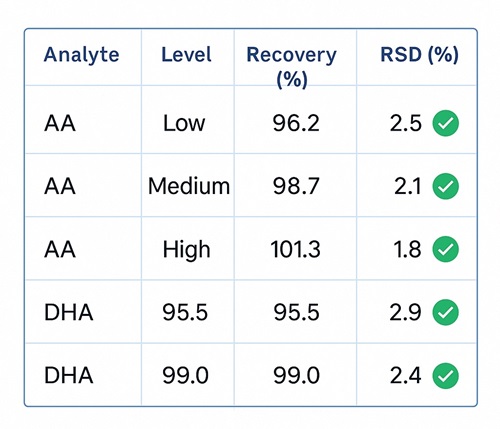
Figure 3. Quality control results for AA and DHA with recovery between 95–102% and RSD < 3%, confirming high accuracy and reproducibility.
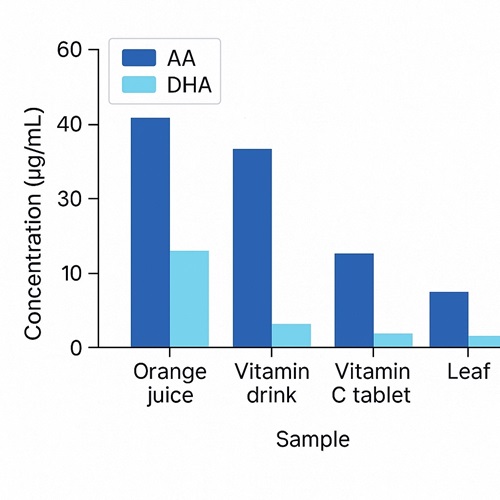
Figure 4. Vitamin C content in different samples (orange juice, vitamin drink, tablet, and leaf) showing AA as major component and DHA as minor fraction.
FAQ of Vitamin C Analysis Service
Can you analyze both reduced and oxidized forms of Vitamin C in one run?
Yes. Our UHPLC-MS/MS and UHPLC-ECD methods allow simultaneous detection of ascorbic acid (AA) and dehydroascorbic acid (DHA) in a single injection, preserving redox balance information.
How do you prevent Vitamin C degradation during sample handling?
We recommend using stabilizers such as metaphosphoric acid and maintaining samples at low temperatures. Our technical team provides detailed stabilization protocols and pre-treated collection vials upon request.
Do you provide profiling for Vitamin C derivatives and esters?
Yes. In addition to AA and DHA, we can quantify derivatives such as ascorbyl palmitate, ascorbyl phosphate, and isoascorbic acid. Customized panels are available for nutraceutical, food, and pharmaceutical studies.
Can you perform stability or stress testing for Vitamin C-containing products?
Yes. We design oxidative and thermal stress testing protocols to evaluate Vitamin C degradation kinetics and provide data that support shelf-life predictions.
How do you ensure analytical accuracy and reproducibility?
We apply isotopically labeled internal standards, multi-point calibration (r² ≥ 0.999), and include spike-recovery and QC checks in every batch to guarantee reliable results.
Can you integrate Vitamin C analysis into multi-nutrient or metabolomics studies?
Absolutely. Vitamin C quantification can be combined with other micronutrient, antioxidant, or metabolite profiling services, giving a comprehensive view of redox metabolism.
Learn about other Q&A about proteomics technology.
Publications
Here are some of the metabolomics-related papers published by our clients:

- Combined omics approaches reveal distinct mechanisms of resistance and/or susceptibility in sugar beet double haploid genotypes at early stages of beet curly top virus infection. 2023. https://doi.org/10.3390/ijms241915013
- Cancer SLC43A2 alters T cell methionine metabolism and histone methylation. 2020. https://doi.org/10.1038/s41586-020-2682-1
- Metabolomic profiling implicates mitochondrial and immune dysfunction in disease syndromes of the critically endangered black rhinoceros (Diceros bicornis). 2023. https://doi.org/10.1038/s41598-023-41508-4
- Transcriptomics, metabolomics and lipidomics of chronically injured alveolar epithelial cells reveals similar features of IPF lung epithelium. 2020. https://doi.org/10.1101/2020.05.08.084459