Sucrose Analysis Service
Creative Proteomics offers high-precision sucrose analysis services using LC-MS/MS, GC-MS, and HPLC to support research, product development, and quality control. We help clients accurately quantify sucrose and related metabolites in complex matrices, enabling insights into carbohydrate metabolism, crop traits, food composition, and bioenergy efficiency.
Submit Your Request Now
×
- What We Provide
- Advantage
- Workflow
- Technology Platform
- Sample Requirements
- FAQ
- Case
- Publication
What is Sucrose?
Sucrose is a disaccharide composed of one glucose and one fructose molecule linked via a glycosidic bond. Naturally found in a wide array of plants, sucrose serves as a crucial carbohydrate energy source and is integral to various biological and industrial processes. In plants, it plays a pivotal role in energy storage, transport, and regulation of metabolic pathways. Industrially, sucrose is extensively used in food, fermentation, pharmaceuticals, and bioenergy sectors.
Quantitative and qualitative sucrose profiling is critical in multiple domains:
- Plant physiology studies to investigate carbon allocation, stress responses, and metabolic flux.
- Agricultural trait evaluation for crop improvement, such as enhancing sugar yield or stress resilience.
- Food and beverage industry to assess sugar content, authenticity, and quality control.
- Fermentation and biofuel industries to optimize substrate utilization and process efficiency.
- Biochemical research to understand carbohydrate metabolism and its influence on broader metabolic networks.
Sucrose Analysis Service Offered by Creative Proteomics
Creative Proteomics provides a suite of highly specialized sucrose analysis services tailored to support research, product development, and quality control. Each service is designed to deliver actionable biochemical insights with high sensitivity, accuracy, and reproducibility. Our offerings include:
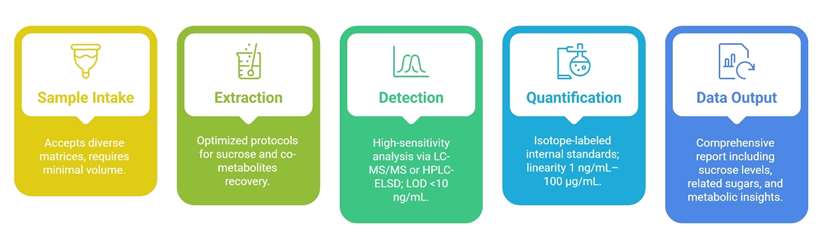
Quantitative Sucrose Profiling: Absolute quantification of sucrose using isotope-labeled internal standards. Matrix-specific calibration for plant, microbial, food, and biofluid samples. Sensitivity: LOD < 10 ng/mL, LOQ < 50 ng/mL.
Simultaneous Multi-Sugar Analysis: Detection of sucrose along with glucose, fructose, maltose, trehalose. Useful for metabolic flux analysis and sugar composition profiling.
Sucrose Metabolic Pathway Analysis: Targeted metabolomics of sucrose biosynthesis and degradation intermediates. Integration with key pathways: glycolysis, TCA cycle, raffinose family oligosaccharides (RFOs).
Enzymatic Activity-Coupled Sugar Profiling: Indirect quantification of sucrase, invertase, and sucrose synthase activity via metabolic products. Functional insights into sucrose metabolism under different conditions.
Comparative Sugar Profiling Across Conditions: Designed for experimental studies involving genetic modification, environmental stress, or treatment interventions. Includes statistical comparisons and pathway enrichment analysis.
Custom Sucrose Analysis Projects: Method development for unique sample types or uncommon matrices. Custom analytical panels combining sucrose with organic acids, sugar alcohols, and other carbohydrates.
List of Detectable Sucrose-Related Metabolites
| Category | Detected Compounds | Associated Pathways |
|---|---|---|
| Disaccharides | Sucrose, Maltose, Trehalose, Lactose | Carbohydrate metabolism, Sugar transport |
| Monosaccharides | Glucose, Fructose, Galactose, Mannose | Glycolysis, Fructose and mannose metabolism |
| Sugar Alcohols | Sorbitol, Mannitol, Xylitol, Erythritol | Polyol pathway, Stress response in plants |
| Glycolysis Intermediates | Glucose-6-phosphate, Fructose-6-phosphate, Glyceraldehyde-3-phosphate, Pyruvate | Glycolysis/Gluconeogenesis |
| TCA Cycle Intermediates | Citrate, Isocitrate, α-Ketoglutarate, Succinic acid, Fumarate, Malate | Tricarboxylic Acid (TCA) Cycle |
| Pentose Phosphate Pathway | Ribose-5-phosphate, Sedoheptulose-7-phosphate, Erythrose-4-phosphate | Pentose phosphate pathway |
| Oligosaccharides | Raffinose, Stachyose, Verbascose | Raffinose family oligosaccharide (RFO) biosynthesis |
| Amino Sugar Derivatives | N-Acetylglucosamine, Glucosamine | Amino sugar and nucleotide sugar metabolism |
| Organic Acids | Acetate, Lactate, Citrate, Malonate | Energy metabolism, fermentation pathways |
| Related Enzymatic Markers (Indirect) | Sucrase activity (via glucose + fructose), Invertase activity, Sucrose synthase (SUS) | Sucrose metabolism and turnover pathways |
Advantages of Sucrose Assay
- LOD < 10 ng/mL and LOQ < 50 ng/mL, enabling detection of trace-level sucrose.
- Wide linear dynamic range of 1 ng/mL to 100 µg/mL, suitable for low and high concentration samples.
- RSD < 8% across replicates, ensuring high reproducibility and analytical consistency.
- Simultaneous detection of 30+ sugars and metabolic intermediates, covering key carbohydrate pathways.
- Standard turnaround time of 5–10 business days, with expedited options available.
- Agilent 6495C LC-MS/MS used for ultra-sensitive, targeted sucrose quantification.
- Agilent 7890B GC-MS applied for volatile sugar derivatives and polyols.
- Shimadzu HPLC-ELSD used for non-UV-active sugars like sucrose and maltose.
- Customizable analysis panels, supporting both targeted detection and full-spectrum sugar profiling.
Workflow for Sucrose Analysis Service
Technology Platforms for Sucrose Analysis Service
LC-MS/MS – Agilent 6495C Triple Quadrupole Mass Spectrometer
GC-MS – Agilent 7890B GC coupled with 5977B MSD
HPLC-ELSD – Shimadzu Prominence HPLC with Evaporative Light Scattering Detector
Ion Chromatography (IC) – Thermo ICS-6000 Series
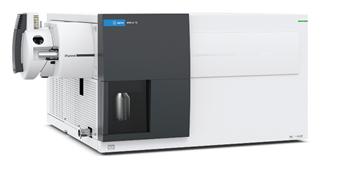
Agilent 6495C Triple Quadrupole (Figure from Agilent)
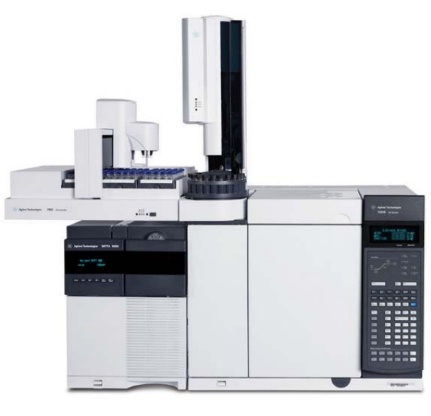
Agilent 7890B-5977B (Figure from Agilent)
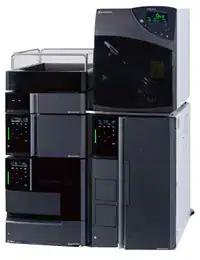
ELSD-LT III (Figure from SHIMADZU)
Sample Requirements for Sucrose Analysis Service
| Sample Type | Minimum Amount Required | Recommended Storage Conditions |
|---|---|---|
| Plant tissue (fresh or dry) | ≥ 100 mg | Store at -80°C; avoid freeze-thaw cycles |
| Food samples | ≥ 1 g homogenized | Store at -20°C; seal to prevent moisture |
| Fermentation broth | ≥ 5 mL | Store at -20°C; centrifuge if possible |
| Microbial cultures | ≥ 10 mL culture or pellet | Pellet and store at -80°C or freeze supernatant |
| Cell lysates | ≥ 500 µL | Store at -80°C; avoid protein contamination |
| Serum or plasma | ≥ 200 µL | Store at -80°C; EDTA or heparin tubes |
| Urine | ≥ 1 mL | Store at -80°C; collect midstream if possible |
| Culture media | ≥ 5 mL | Store at -20°C; filter to remove particulates |
FAQ of Sucrose Analysis Service
Can I submit multiple sample types in one project (e.g., both plant and serum)?
Yes, we can process multiple sample types within a single project. Please ensure each sample type is clearly labeled and packaged separately.
How should I prepare my samples before shipping?
Samples should be flash-frozen in liquid nitrogen (if applicable) and stored at -80°C. Ship samples on dry ice in insulated containers to maintain integrity.
Can I request raw data or specific data formats for downstream processing?
Yes, we provide raw data upon request. Results can be delivered in multiple formats including Excel, CSV, and PDF reports.
What is the minimum number of samples you accept per project?
There is no strict minimum, but batch pricing is more cost-effective for 6 or more samples.
Can you help with experimental design or sample randomization?
Yes, our technical support team can assist with study design, sample grouping, and randomization strategy to ensure robust data output.
Is there a difference in cost between targeted and full-panel analysis?
Yes, targeted analysis (e.g., sucrose only) is generally more economical than full sugar/metabolite panels. Custom quotes are available.
Are your methods validated across different biological matrices?
Yes, our protocols have been optimized and validated across a wide range of matrices including plant tissues, cell lysates, biofluids, and food products.
What is the recommended shipping condition for sucrose-containing samples?
Samples should be shipped frozen (–20°C) with ice packs for plant tissues or microbial cultures. Liquid samples (e.g., juices) require preservatives (e.g., 0.1% sodium azide) to inhibit microbial activity during transit.
Can your analysis distinguish sucrose from other disaccharides (e.g., lactose or maltose)?
Absolutely. Our HPLC method achieves >95% specificity for sucrose via optimized elution gradients, effectively separating it from lactose (retention time difference: 1.8 min) and maltose (retention time difference: 2.3 min).
Do you support analysis of animal-derived samples (e.g., honey or dairy)?
Yes. We validate methods for honey (sucrose content ≤5% as per Codex standards) and dairy products, with specialized protocols to remove interfering fats or proteins.
How do you ensure data reproducibility?
We include internal standards (e.g., ribitol) and perform triplicate injections per sample, achieving a RSD<2% for technical replicates.
Learn about other Q&A.
Sucrose Analysis Service Case Study
Title: Determination of chemical profile of Eugenia dysenterica ice cream using PS-MS and HS-SPME/GC-MS
Journal: Química Nova
Published: 2021
- Background
- Methods
- Results
- Conclusion
The Cerrado biome in Brazil, the world's richest savanna, holds great biodiversity, including the cagaiteira tree (Eugenia dysenterica), which produces fruits rich in vitamin C and phenolic compounds. These fruits are traditionally consumed fresh or processed into various food products. However, many native species, including the cagaiteira, face extinction threats due to deforestation from agricultural and livestock expansion.
To enhance the value of native fruits and support local economies, food product development such as ice cream is explored. Brazil ranks among the world's top ice cream producers. Ice cream production involves creating a stable emulsion using ingredients like milk, sugars, and emulsifiers. Traditional chemical analysis methods (e.g., HPLC, GC-MS) used to study such products are time-consuming and produce waste. In contrast, ambient ionization mass spectrometry methods, particularly Paper Spray Ionization Mass Spectrometry (PS-MS), offer rapid, low-cost, and low-preparation alternatives. This study aimed to chemically characterize cagaita ice cream using PS-MS and headspace solid-phase microextraction (HS-SPME) coupled with GC-MS.
1. Sample Collection & Preparation:
- Ripe cagaita fruits were collected, sanitized, and stored at -20 °C.
- Pulps were extracted and homogenized.
- Ice cream formulation included 40% cagaita pulp and other ingredients (milk powder, sugars, inulin, sweeteners, oils, emulsifiers).
- The mixture was pasteurized, cooled, aerated, and frozen.
2. Extraction:
- Samples (fruit and ice cream) were extracted using methanol/water and acetone/water.
- Supernatants were pooled and diluted for analysis.
3. Total Phenolic Compounds:
- Determined via the Folin-Ciocalteu assay.
- Absorbance was measured at 765 nm.
- Results expressed in mg gallic acid equivalent (GAE) per 100 g of sample.
4. Chemical Profiling via PS-MS:
- Used LCQ Fleet ion trap mass spectrometer with paper spray ionization.
- Samples (2 µL) were placed on triangular paper and sprayed with methanol under high voltage.
- Mass spectra were obtained in both positive and negative modes over 100–1000 m/z.
5. Volatile Compounds Analysis (HS-SPME-GC-MS):
- Samples placed in vials, preheated, and extracted using PA or PDMS/DVB fibers.
- Fibers were inserted into a GC-MS system for analysis.
- Compounds identified by comparison with the NIST mass spectral library.
6. Statistical Analysis:
- Triplicate experiments.
- One-way ANOVA and Tukey test for phenolic data (p < 0.05).
- PCA and spectral analysis were performed using Xcalibur, Excel, and MATLAB with PLS Toolbox.
- A total of 18 volatile compounds were identified in cagaita pulp; 89% were retained in the ice cream.
- 3-carene was the predominant compound in both pulp and ice cream, with higher extraction using PDMS/DVB fiber.
- Ice cream showed increased extraction of Pent-4-en-2-ol, likely due to matrix interactions.
- Volatile compound levels decreased slightly due to processing steps like blending and freezing.
- Total phenolic content was 241.26 mg GAE/100 g in pulp and 79.97 mg GAE/100 g in ice cream, indicating ~90% retention.
- PS-MS detected 36 compounds, with 28 (77.8%) present in both pulp and ice cream.
- PCA demonstrated clear chemical differentiation between pulp and ice cream due to processing effects.
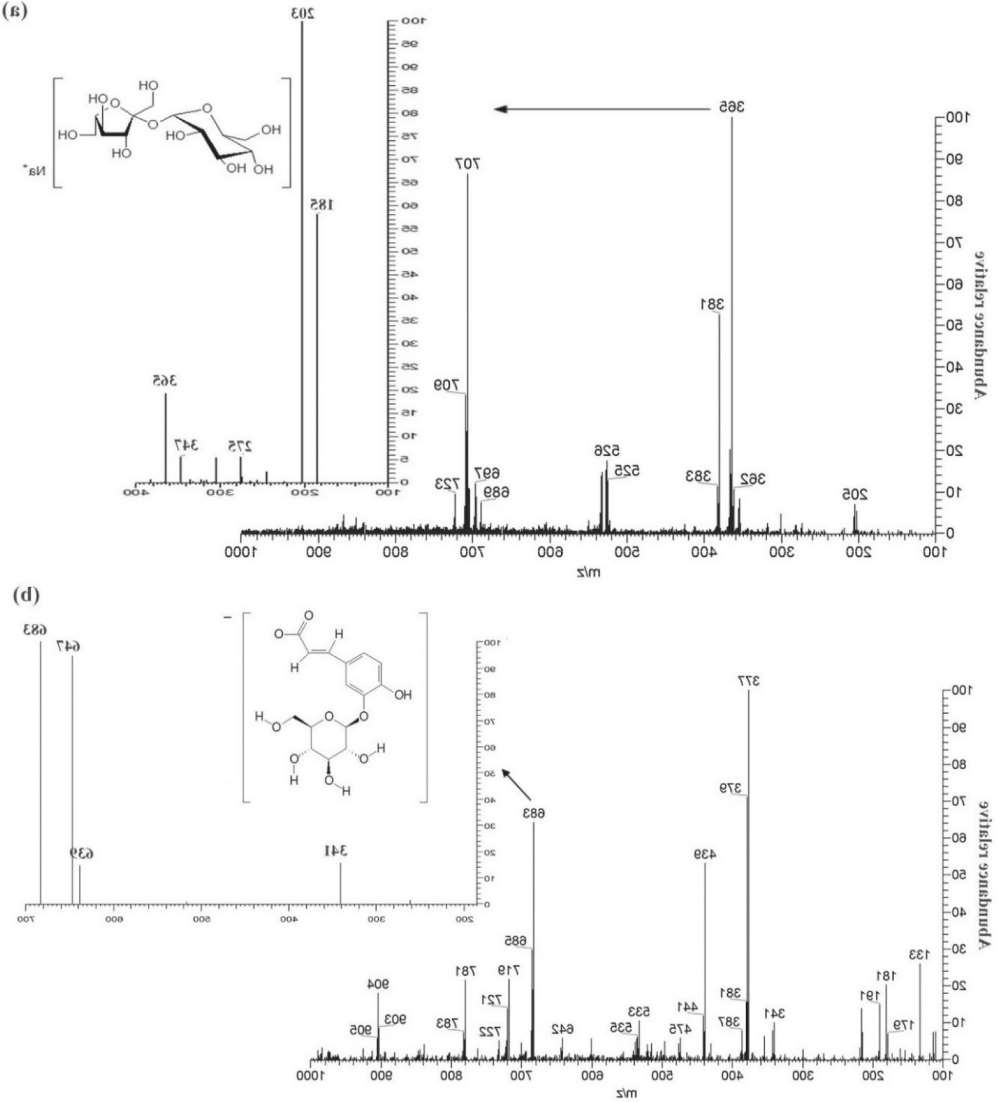 Representation of (a) sucrose (m/z 365) in PS(+)-MS and (b) caffeic acid hexoside dimer (m/z 683) in PS(-)-MS of cagaita ice cream sample
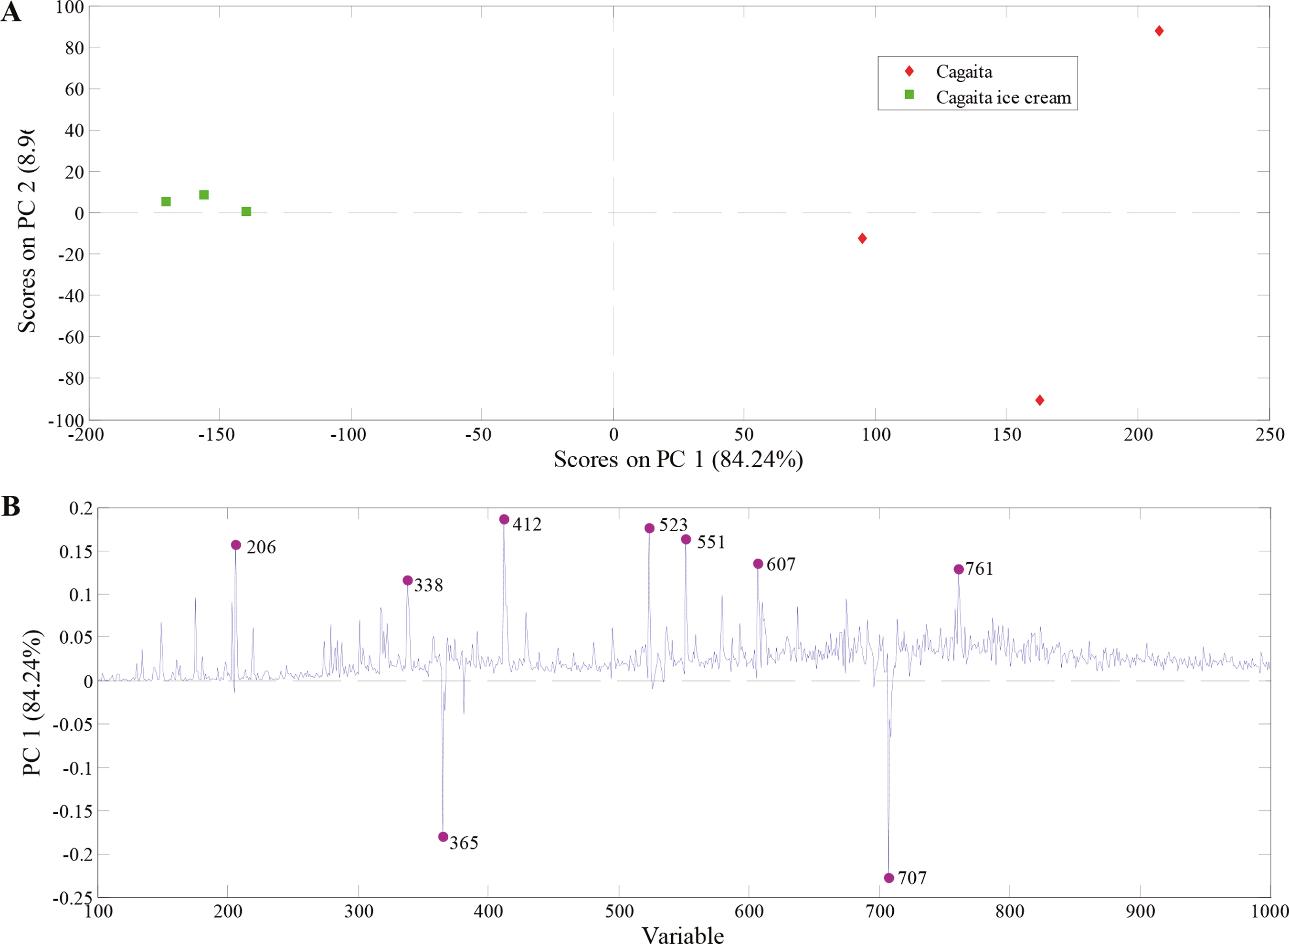 PCA model built with PS(+)-MS data from cagaita pulp and cagaita ice cream samples.
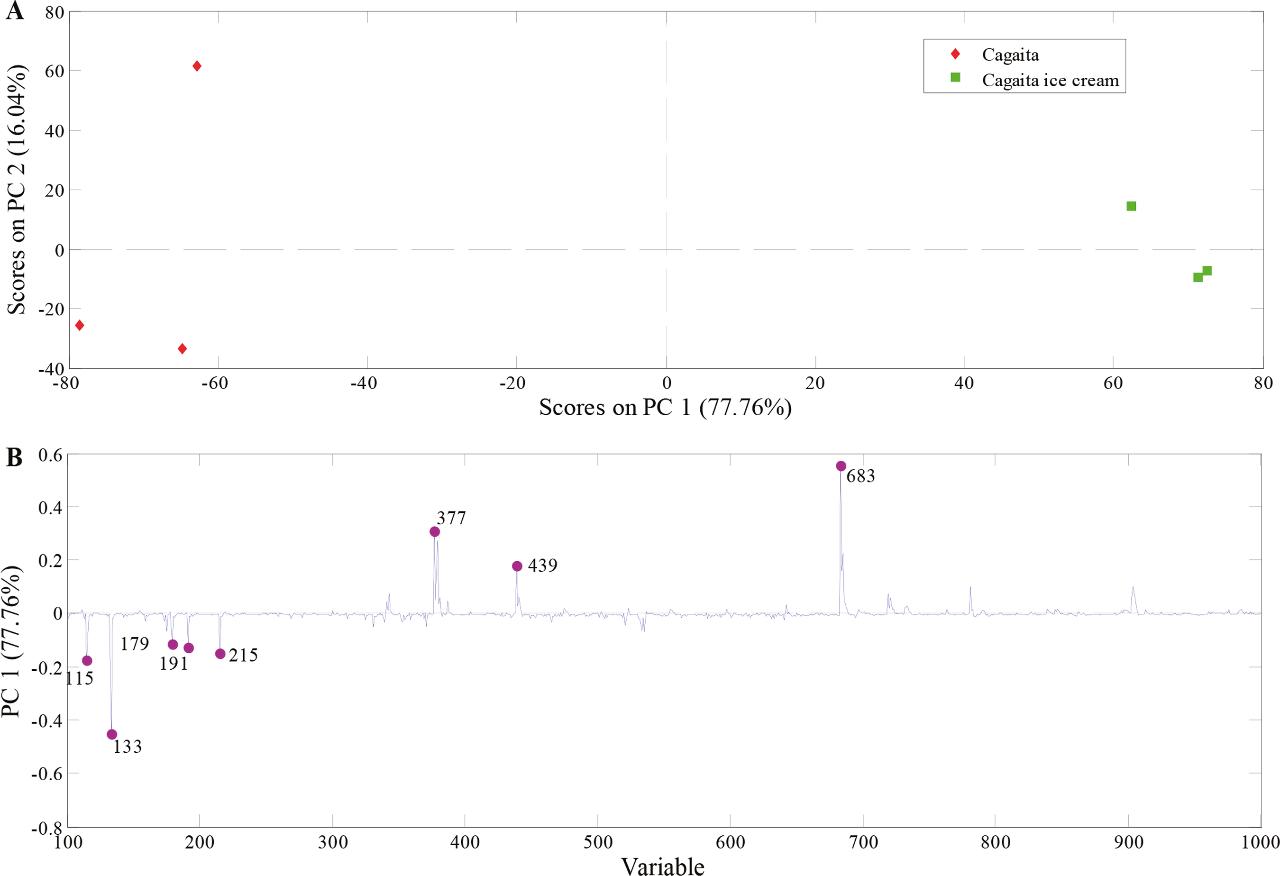 PCA model built with PS(-)-MS data from cagaita pulp and cagaita ice cream samples.
Most volatile and bioactive compounds in cagaita pulp were retained after ice cream processing.
SPME and PS-MS techniques effectively identified and characterized chemical profiles in both matrices.
This study provides novel insights into how fruit-derived compounds behave during ice cream manufacturing, supporting the development of functional fruit-based desserts.
Reference
- Silva, Mauro R., et al. "Determination of chemical profile of Eugenia dysenterica ice cream using PS-MS and HS-SPME/GC-MS." Química Nova 44 (2021): 129-136. https://doi.org/10.21577/0100-4042.20170680
Publications
Here are some publications in Metabolomics research from our clients:

- Modulation of the Endomembrane System by the Anticancer Natural Product Superstolide/ZJ-101. 2023. https://doi.org/10.3390/ijms24119575
- Conformational differences between functional human immunodeficiency virus envelope glycoprotein trimers and stabilized soluble trimers. 2019. https://doi.org/10.1128/jvi.01709-18
- Alternative glycosylation controls endoplasmic reticulum dynamics and tubular extension in mammalian cells. 2021. https://doi.org/10.1126/sciadv.abe8349
- Identification of the O-Glycan Epitope Targeted by the Anti-Human Carcinoma Monoclonal Antibody (mAb) NEO-201. 2022. https://doi.org/10.3390/cancers14204999
References
- Valgimigli, Luca, Simone Gabbanini, and Riccardo Matera. "Analysis of maltose and lactose by U-HPLC-ESI-MS/MS." (2012).
- Bibi, Yamin, et al. "Isolation studies from stem extract of Pistacia integerrima stew. ex brand." Journal of the Chilean Chemical Society 61.2 (2016): 2916-2920.