Indole-3-acetic Acid (IAA) Analysis Service
At Creative Proteomics, we empower plant science and microbiome researchers with ultra-sensitive, LC-MS/MS-based Indole-3-acetic Acid (IAA) analysis. Whether you're mapping hormone gradients, validating gene edits, or profiling microbe–plant interactions, our platform ensures accurate, reproducible results—every time.
Why Choose Us?
- Trace-Level Sensitivity: Detect IAA down to 0.5 ng/g FW
- Isotope-Labeled Accuracy: IAA-d5 internal standard for absolute quantification
- Pathway-Level Coverage: Quantify 10+ auxin-related metabolites
- Microbial & Plant Compatible: Leaves, roots, callus, rhizosphere, media
Submit Your Request Now
×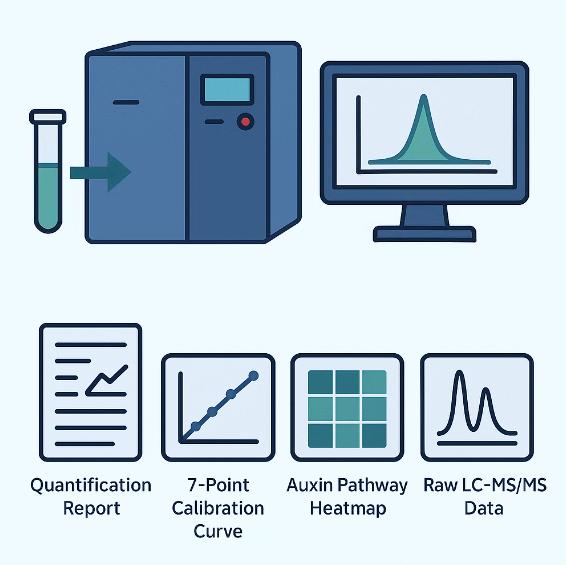
What You Receive
- Quantitative IAA report with full QC
- 7-point calibration curve (0.5–5,000 ng/mL)
- Auxin pathway heatmap and metabolite profile
- Raw LC-MS/MS data with MRM transitions
- What We Provide
- Advantages
- Technology Platform
- Sample Requirement
- Demo
- FAQs
What Is Indole-3-acetic Acid (IAA)?
Indole-3-acetic acid (IAA) is the most abundant and biologically active auxin in plants, acting as a master regulator of growth and development. It influences key physiological processes such as cell elongation, apical dominance, tropic responses, lateral root formation, and stress adaptation. Due to its low natural abundance and rapid degradation, precise quantification of IAA is essential for understanding plant hormone signaling pathways and metabolic networks.
Why Indole-3-acetic Acid Analysis Matters for Your Research
Accurate quantification of indole-3-acetic acid (IAA) is essential to understanding auxin-regulated processes and resolving critical research questions in plant science. This analysis helps you:
- Uncover Growth and Development Mechanisms
Map auxin gradients during organogenesis, tissue differentiation, and root formation. - Correlate Hormonal Shifts with Stress Responses
Track IAA dynamics under drought, salinity, temperature extremes, or pathogen attack. - Validate Genetic Engineering and Metabolic Pathway Edits
Confirm modifications in auxin biosynthesis or signaling following targeted or transgenic modifications. - Characterize Plant–Microbe Interactions
Evaluate IAA production by beneficial rhizobacteria or endophytes and its effect on root system architecture. - Drive Crop Improvement and Yield Optimization
Link hormone profiles to key agronomic traits for breeding and cultivation strategies.
IAA exists at trace concentrations (often in ng/g FW) and is prone to rapid degradation. Without precise analysis, hormonal pathway modeling, stress physiology studies, and crop trait validation remain incomplete.
Creative Proteomics's Indole-3-acetic Acid Analysis Solutions
- Targeted Indole-3-acetic Acid Quantification: Absolute IAA measurement using LC-MS/MS with isotope dilution, ensuring high precision and reproducibility.
- Auxin Metabolic Pathway Analysis: Profiling of IAA biosynthesis precursors, conjugates, and catabolites (e.g., IPyA, IBA, IAA-Asp, IAA-Glu) for pathway elucidation.
- Comprehensive Plant Hormone Profiling: Simultaneous analysis of auxins, gibberellins, cytokinins, abscisic acid, jasmonates, and salicylic acid for integrated hormonal crosstalk studies.
- Microbial IAA Production Screening: Quantification of IAA and related auxins in plant-associated microbes or culture media to assess growth-promoting potential.
- Stable Isotope Tracer Experiments' Isotope-labeled auxin tracking for metabolic flux analysis and turnover rate studies.
- Custom Panel Development: Flexible design of detection panels based on species-specific requirements or engineered pathways.
List of Detected Indole-3-acetic Acid and Metabolites
| Category | Detected Compounds |
|---|---|
| Free Auxins | Indole-3-acetic acid (IAA), Phenylacetic acid (PAA) |
| Auxin Precursors | L-Tryptophan, Indole-3-pyruvic acid (IPyA), Indole-3-acetonitrile (IAN), Indole-3-acetamide (IAM) |
| Auxin Conjugates | IAA-Aspartate, IAA-Glutamate, IAA-Glucose, IAA-Alanine |
| Auxin Analogues | Indole-3-butyric acid (IBA), 4-Chloro-indole-3-acetic acid |
| IAA Catabolites | Oxindole-3-acetic acid (OxIAA), 2-Oxindole-3-acetic acid |
Why Choose Creative Proteomics for Indole-3-acetic Acid Analysis?
- Ultra-Low Detection Limit: Detect IAA concentrations as low as 0.5 ng/g fresh weight, suitable for trace-level quantification in plant tissues and microbial cultures.
- Wide Linear Dynamic Range: Quantification over a 0.5–5,000 ng/mL range, supported by a 7-point calibration curve with R² ≥ 0.995, ensuring both sensitivity and accuracy.
- High Reproducibility: Intra- and inter-batch coefficient of variation (CV) ≤ 5%, enabling reliable comparisons across experimental conditions or time points.
- Isotope-Dilution Quantification: Use of stable isotope-labeled internal standard IAA-d5 for absolute quantification, eliminating matrix interference and improving analytical confidence.
- Full Metabolite Panel Coverage: Detection of 10+ IAA-related metabolites, including precursors (IPyA, IAN), conjugates (IAA-Asp, IAA-Glu), and catabolites (OxIAA), supporting pathway-level interpretation.
- Optimized Sample Stabilization Protocols: Customized extraction buffers with antioxidants and pH control minimize degradation of labile auxins during sample prep and processing.
- Flexible Matrix Compatibility: Validated for plant leaves, roots, stems, seeds, callus, microbial cultures, and rhizosphere exudates.
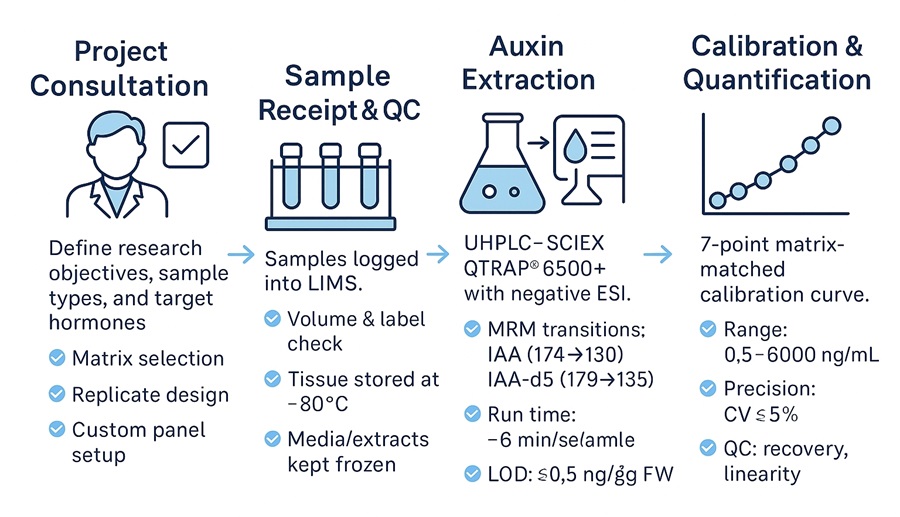
Indole-3-acetic Acid Analysis Workflow: Step-by-Step Process
1. Project Consultation & Experimental Planning
Define research objectives, sample types, and analytical targets. We provide guidance on matrix selection, replicate design, and custom hormone panel configuration.
2. Sample Receipt & Pre-Analytical QC
All incoming samples are logged into our LIMS system. We assess volume, labeling accuracy, and sample integrity. Tissues are stored at −80 °C; media or extracts are kept frozen until extraction.
3. Auxin Extraction & Stabilization
Samples undergo matrix-specific extraction using acidified methanol or antioxidant-containing buffers. Stable isotope-labeled IAA-d5 is added at this stage to enable accurate recovery evaluation.
4. LC-MS/MS Analysis
Quantitative analysis is conducted using a UHPLC–SCIEX QTRAP® 6500+ system with negative ESI and MRM transitions. Analytes are separated on a C18 column under optimized gradient conditions.
- Run time: ~6 minutes/sample
- LOD: ≤ 0.5 ng/g FW
- MRM transitions: IAA (174→130), IAA-d5 (179→135)
5. Calibration, Quantification & QC
A 7-point matrix-matched calibration curve ensures accuracy across a dynamic range of 0.5–5,000 ng/mL. QC samples are evaluated for recovery, linearity, and precision (CV ≤ 5%).
Technology Platform for Isoprenoid Pathway Analysis Service
Analytical Instrumentation
| Platform Component | Model / Specification |
|---|---|
| UHPLC System | Thermo Scientific™ Vanquish™ or Waters ACQUITY UPLC™ |
| Mass Spectrometer | SCIEX QTRAP® 6500+ Triple Quadrupole |
| Ionization Mode | Electrospray Ionization (ESI), Negative Mode |
| Quantification Mode | Multiple Reaction Monitoring (MRM) |
| Internal Standard | IAA-d5 (Stable Isotope-Labeled) |
| Chromatographic Column | C18 reverse-phase column, sub-2 µm particle size |
Key Method Parameters
- LOD (Limit of Detection): ≤ 0.5 ng/g fresh weight
- Linear Quantification Range: 0.5–5,000 ng/mL, R² ≥ 0.995
- Retention Time for IAA: ~3.1 minutes (may vary with matrix)
- MRM Transitions:
- IAA: m/z 174 → 130
- IAA-d5: m/z 179 → 135
- Injection Volume: 5–10 µL
- Run Time: ~6 minutes per sample
Quality Control and Calibration
- 7-point calibration curve prepared with matrix-matched standards
- Use of biological replicates and spike-recovery experiments to ensure accuracy
- Recovery Rate: ≥ 90% for most plant matrices
- Precision: CV ≤ 5% intra- and inter-batch
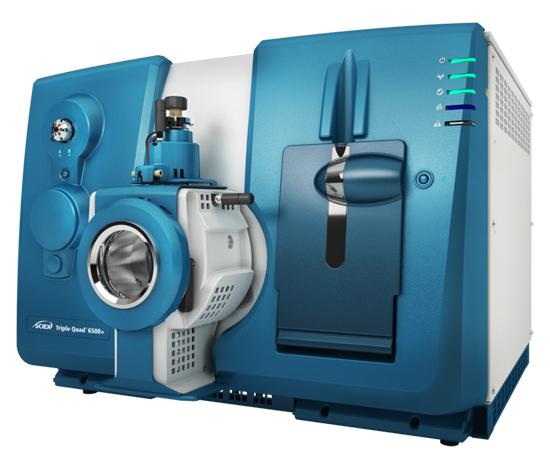
SCIEX Triple Quad™ 6500+ (Figure from Sciex)
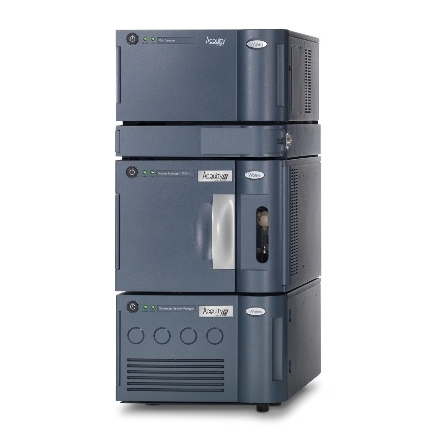
Waters ACQUITY UPLC System (Figure from Waters)
Sample Requirements for Accurate Indole-3-acetic Acid Analysis Service
| Sample Type | Required Volume / Weight | Storage Condition | Notes |
|---|---|---|---|
| Plant Tissue | ≥ 200 mg (fresh weight) | -80°C, freeze immediately | Avoid repeated freeze-thaw; wrap in foil to block light |
| Culture Medium | ≥ 1 mL | -80°C | Filter before freezing to remove particulates |
| Plant Sap / Extract | ≥ 500 µL | -80°C | Use antioxidant buffer to prevent IAA degradation |
| Microbial Culture | ≥ 10 mL | -80°C | Collect at stationary phase; centrifuge to remove cells before freezing |
| Powdered Samples | ≥ 100 mg | Room temp or -20°C | Store dry in airtight container, avoid moisture |
Notes:
- Do not add preservatives or stabilizers unless specified.
- Provide sample metadata (species, treatment conditions, storage time).
- Ship samples on dry ice for frozen materials.
Demo Results

Representative results of IAA quantification by LC-MS/MS, showing a matrix-matched calibration curve (R² = 0.999), chromatographic peak at ~2 min, and QC metrics (LOD = 0.5 ng/g FW, CV = 3.1%, Recovery = 92%).
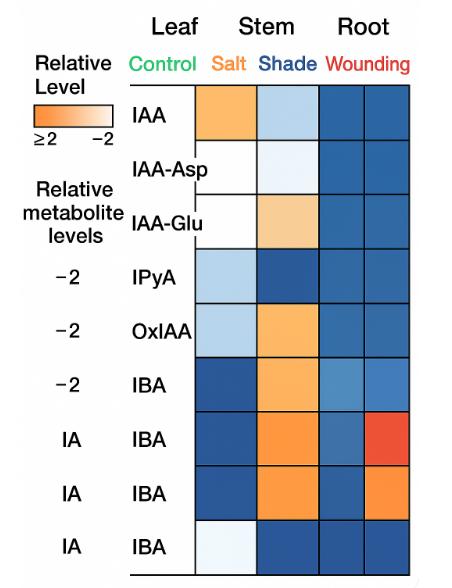
Heatmap showing relative levels of auxin metabolites (IAA, IAA-Asp, IAA-Glu, IPyA, OxIAA, IBA) across leaf, stem, and root tissues under control, salt, shade, and wounding treatments.
Case study

Plant Growth Promotion, Phytohormone Production and Genomics of the Rhizosphere-Associated Microalga, Micractinium rhizosphaerae sp. nov.
Journal: Plants
Published: 2023
- Background
- Materials & Methods
- Results
- Reference
Background
Microalgae are integral components of soil and plant microbiomes, contributing to soil health and promoting plant growth. This study focuses on the functional and genomic characterization of a newly identified microalga strain, NFX-FRZ, isolated from the rhizosphere of a wild Ficus tree in Portugal. The findings reveal that this strain not only binds to tomato plant tissues and promotes growth but also synthesizes various phytohormones and possesses multiple genes linked to phytohormone biosynthesis. This research underscores the potential of eukaryotic microalgae as agents for plant growth promotion, paving the way for further investigations into their roles in soil and plant interactions.
Strain Isolation, Identification, and Characterization
The NFX-FRZ strain was isolated from the roots of a wild Ficus tree in Portugal. Roots were washed with sterile water, and the solution was plated on algae culture agar, incubated under light and temperature conditions. Identification was confirmed through genomic data (18S-ITS1-5.8S-ITS2) and morphological observation via microscopy.
Phylogenetic Analysis
Sequences of Micractinium species were obtained from the NCBI database and aligned using MUSCLE. Phylogenetic relationships were analyzed with MEGA X, employing the maximum likelihood method and bootstrapping for robustness.
Growth Kinetics under Autotrophic Conditions
Axenic autotrophic growth experiments were conducted in 2 L Schott flasks with 1.5X algae culture broth. Cultivation occurred at 22 °C under specific light and aeration conditions, starting with an inoculum of approximately 1 × 10^6 cells/mL.
Tomato Plant Growth Promotion Assays
Tomato growth promotion was evaluated using various treatments on agar plates. NFX-FRZ exudates were tested by creating agar plates from microalgal exudates. Germinated seedlings were used to assess root and shoot elongation and fresh weight, with statistical analysis performed using ANOVA and Tukey's test.
Untargeted Metabolomic Analysis of NFX-FRZ Exudates
Supernatants from growth experiments were collected and subjected to metabolomic analysis. Samples were lyophilized, dissolved in methanol, and prepared for LC-MS. Metabolites were identified and quantified using Compound Discoverer software.
Genome Sequencing and Analysis
Total genomic DNA was extracted and sequenced, followed by assembly and annotation. The completeness and functional annotations of the nuclear genome, chloroplast, and mitochondrial genomes were assessed using bioinformatics tools, including GHOSTKOALA and BLASTp.
Characterization of Micractinium rhizosphaerae sp. nov.
Strain NFX-FRZ is spherical, measuring ~3.5 × 3.2 μm, non-motile, reproducing via autospores. It contains a single cup-shaped chloroplast with a defined pyrenoid and distinct starch and lipid bodies. BLAST analysis confirmed a high similarity to Micractinium species, with phylogenetic analysis indicating NFX-FRZ as a novel species, Micractinium rhizosphaerae sp. nov.
Promotes Tomato Plant Growth and Binds to Roots
NFX-FRZ significantly enhanced tomato plant growth in exudate agar compared to controls, showing increased shoot elongation and fresh weight. In contrast, algae culture agar negatively affected growth, potentially due to nutrient imbalances. NFX-FRZ also attached to tomato roots, forming clusters, indicating its potential as a beneficial agent in agriculture.
Metabolomic Analysis Revealed Phytohormones and Growth Compounds
Untargeted metabolomic analysis identified 115 compounds from 5563 peaks in negative mode and 146 from 3497 in positive mode. Key compounds included organic acids and phytohormones, with indole-3-acetic acid (IAA) being predominant, suggesting it contributes to NFX-FRZ's plant growth-promoting effects.
Genomic Properties
The genome size of NFX-FRZ is 68.28 Mbp, with a GC content of 65.3%. It comprises 1497 contigs with functional annotations indicating similarities to Micractinium conductrix, though unique modules were identified in NFX-FRZ that could affect cell wall properties.
Insights into Phytohormone Production
The NFX-FRZ genome supports IAA synthesis through various pathways, and several genes related to transport and signaling were identified. It also contains genes for salicylic acid and jasmonic acid biosynthesis, though signaling mechanisms may differ from those in higher plants, indicating unique regulatory systems in Micractinium.
Table 1. Top 30 compounds identified in NFX-FRZ exudates (15 from each of negative and positive ionization modes).

Table 2. Phytohormones detected in M. rhizosphaerae NFX-FRZ exudates.

Reference
- Quintas-Nunes, Francisco, et al. "Plant Growth Promotion, Phytohormone Production and Genomics of the Rhizosphere-Associated Microalga, Micractinium rhizosphaerae sp. nov." Plants 12.3 (2023): 651.
FAQ of Indole-3-acetic Acid Analysis Service
Can I submit samples from non-model plant species?
Yes. Our platform supports a wide variety of plant species, including non-model organisms. If you're working with rare or under-characterized species, we recommend contacting us for customized panel development or method adaptation based on your sample matrix.
How should I prepare field-collected samples for IAA analysis?
Immediately after collection, freeze the plant material in liquid nitrogen and store at −80°C. Wrap samples in foil to protect them from light. Avoid prolonged transport without proper cooling, as IAA is highly unstable and light-sensitive.
Can I submit samples previously extracted in my lab?
Yes, we accept pre-extracted samples. However, we recommend using our validated extraction protocols or consulting us beforehand to ensure compatibility with LC-MS/MS analysis and internal standard recovery.
Do you offer data interpretation support for hormone pathway analysis?
Yes. Upon request, we can assist with data interpretation, including auxin metabolism mapping, correlation with stress conditions or treatment groups, and pathway-level visualization for publications or grant submissions.
Is co-analysis of other phytohormones with IAA possible?
Absolutely. We offer multi-hormone profiling services that can simultaneously detect gibberellins, cytokinins, abscisic acid, jasmonates, salicylic acid, and more. This supports integrated studies on hormonal crosstalk and signaling.
Are there specific storage guidelines for powdered plant materials?
Powdered samples should be kept dry in airtight containers at room temperature or −20°C. Avoid humidity exposure, and do not add any stabilizers or buffers unless recommended by our technical team.
Can I track IAA turnover or biosynthetic rates using your service?
Yes. We offer isotope tracer experiments using labeled IAA or precursors, enabling metabolic flux analysis and turnover studies under different experimental conditions.
How do you ensure the accuracy of quantification in complex sample matrices?
We use isotope-dilution quantification with a stable isotope-labeled internal standard (IAA-d5), which corrects for matrix effects and extraction variability, ensuring robust and reproducible quantification even in complex tissues.
Is your method suitable for analyzing low-biomass samples like seedlings or callus?
Yes. Our method is highly sensitive (LOD ≤ 0.5 ng/g FW), making it well-suited for low-biomass samples such as early-stage seedlings, callus, or small root sections. Please ensure the minimum sample amount is met.
Can I receive raw data files along with the final report?
Yes. We provide raw LC-MS/MS data files, quantification tables, and method details upon request, allowing for full transparency and post-analysis validation in your own lab.
Do you offer technical consultations before I start my experiment?
Yes. We encourage early-stage consultation to help design experiments, optimize sample collection protocols, and determine the best analysis strategy based on your scientific goals.
How do you handle complex sample matrices that may interfere with IAA detection?
We apply isotope-dilution quantification using IAA-d5, which corrects for matrix effects and ensures reliable results in complex tissues or microbial media. Additionally, our extraction protocols include matrix-specific buffers with antioxidants and pH control to minimize degradation and interference from co-eluting compounds.
Can you quantify IAA in plant samples subjected to abiotic or biotic stress (e.g., drought, salinity, pathogens)?
Yes. Our platform is optimized for detecting IAA in stress-treated plant tissues, where hormone levels and matrix composition may vary significantly. We routinely analyze samples from drought-, salt-, and temperature-stressed plants, as well as those under pathogen challenge, ensuring accurate quantification even in dynamic physiological conditions.
What is the detection limit for IAA using different analytical platforms?
With HPLC-UV, our detection limit for IAA is approximately 10 ng/mL in plant extracts and culture media. For trace-level quantification, our LC-MS/MS system achieves a lower detection limit of 1 ng/mL or better, making it suitable for low-abundance samples or microbial IAA screening where production levels may be minimal.
Learn about other Q&A about proteomics technology.
Publications
Here are some of the metabolomics-related papers published by our clients:

- Methyl donor supplementation reduces phospho‐Tau, Fyn and demethylated protein phosphatase 2A levels and mitigates learning and motor deficits in a mouse model of tauopathy. 2023.
- A human iPSC-derived hepatocyte screen identifies compounds that inhibit production of Apolipoprotein B. 2023.
- The activity of the aryl hydrocarbon receptor in T cells tunes the gut microenvironment to sustain autoimmunity and neuroinflammation. 2023.
- Lipid droplet-associated lncRNA LIPTER preserves cardiac lipid metabolism. 2023.
- Inflammation primes the kidney for recovery by activating AZIN1 A-to-I editing. 2023.
- Anti-inflammatory activity of black soldier fly oil associated with modulation of TLR signaling: A metabolomic approach. 2023.
- Plant Growth Promotion, Phytohormone Production and Genomics of the Rhizosphere-Associated Microalga, Micractinium rhizosphaerae sp. 2023.