Urea Cycle Metabolism Analysis Service
Creative Proteomics offers a specialized Urea Cycle Metabolism Analysis Service, designed to provide high-precision analysis of metabolites and enzymes involved in the urea cycle. Leveraging state-of-the-art analytical techniques, including LC-MS/MS, GC-MS, NMR, and HPLC, our service offers a comprehensive evaluation of the urea cycle's dynamics, supporting advanced metabolic research.
Submit Your Request Now
×
- Services
- Advantages
- Platform
- Applications
- Demo
- FAQs
In humans and mammals, almost 80% of the nitrogen excreted is in the form of urea, which is produced through a series of reactions occurring in the cytosol and mitochondrial matrix of liver cells. These reactions are collectively called the urea cycle or the Krebs-Henseleit cycle. Ammonia is a toxic product of nitrogen metabolism that should be removed from our body. The urea cycle converts excess ammonia into urea in the mitochondria of liver cells. The urea forms, then enters the blood stream, is filtered by the kidneys and is ultimately excreted in the urine.
What is Urea Cycle?
The urea cycle consists of 4 reactions. The first reaction occurs in the matrix of the mitochondria. The subsequent reactions occur in the cytosol. This is a pathway that spans two cellular compartments. The first reaction is catalyzed by ornithine transcarbamoylase that transfers a carbamoyl group from carbamoyl phosphate to ornithine to form citrulline. The second reaction is catalyzed by argininosuccinate synthetase. This enzyme uses ATP to activate citrulline by forming a citrullyl-AMP intermediate. This intermediate is attacked by the amino group of an aspartate residue to form argininosuccinate. The third step is catalyzed by argininosuccinate lyase that cleaves argininosuccinate into fumarate and arginine. The last step is catalyzed by arginase that cleaves arginine to produce urea and ornithine completing the cycle.
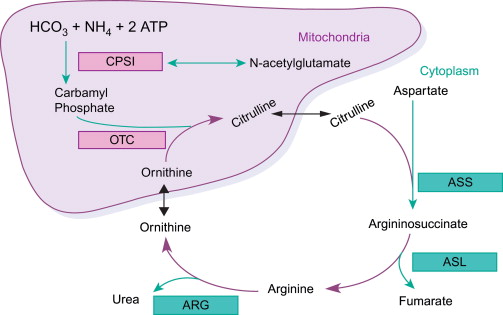 Figure 1. The urea cycle. (Mourad M et al. 2016)
The synthesis of carbamoyl phosphate and the urea cycle are dependent on the presence of NAcGlu, which allosterically activates CPS1. NAcGlu is an obligate activator of carbamoyl phosphate synthetase. Synthesis of NAcGlu by NAGS is stimulated by both Arg, allosteric stimulator of NAGS, and Glu, a product in the transamination reactions and one of NAGS's substrates, both of which elevated when free amino acids are elevated. So Glu not only is a substrate for NAGS but also serves as an activator for the urea cycle.
The remaining enzymes of the urea cycle are controlled by the concentrations of their substrates. Thus, inherited deficiencies in cycle enzymes other than ARG1 do not result in significant decreases in urea production (if any cycle enzyme is entirely missing, death occurs shortly after birth). Rather, the deficient enzyme's substrate builds up, increasing the rate of the deficient reaction to normal.
The main purpose of the urea cycle is to eliminate toxic ammonia from the body. About 10 to 20 g of ammonia is removed from the body of a healthy adult every day. A dysfunctional urea cycle would mean excess amount of ammonia in the body, which can lead to hyperammonemia and related diseases. The deficiency of one or more of the key enzymes catalyzing various reactions in the urea cycle can cause disorders related to the cycle. Defects in the urea cycle can cause vomiting, coma and convulsions in newborn babies. This is often misdiagnosed as septicemia and treated with antibiotics in vain. Even 1mm of excess ammonia can cause severe and irreversible damages.
Urea Cycle Metabolism Analysis Services Offered by Creative Proteomics
Our services include quantitative metabolite profiling using advanced technologies like LC-MS/MS, GC-MS, and HPLC, pathway flux analysis with stable isotope tracing, and enzyme activity assays for key urea cycle enzymes. We also specialize in biomarker discovery for urea cycle disorders and offer custom metabolomics projects tailored to specific research goals. Detailed technical reports are provided.
Quantitative Metabolite Profiling
Our quantitative metabolite profiling service offers precise measurement and profiling of metabolites involved in the urea cycle. This service includes:
High Sensitivity Detection: Utilizing LC-MS/MS, GC-MS, and HPLC technologies to detect low-abundance metabolites with high sensitivity.
Comprehensive Coverage: Profiling a wide range of urea cycle intermediates such as ammonia, carbamoyl phosphate, citrulline, ornithine, arginine, argininosuccinate, fumarate, urea, aspartate, and N-acetylglutamate.
Accurate Quantification: Providing accurate and reproducible quantification of metabolite concentrations, critical for understanding metabolic flux and pathway dynamics.
Pathway Flux Analysis
Our pathway flux analysis service helps in determining the flow of metabolites through the urea cycle, providing insights into metabolic efficiency and regulatory mechanisms. This service includes:
Stable Isotope Tracing: Using stable isotope-labeled compounds to track the movement of metabolites through the urea cycle.
Dynamic Analysis: Assessing real-time changes in metabolite concentrations to understand pathway kinetics and flux.
Detailed Reporting: Delivering comprehensive reports on metabolic fluxes, helping researchers to pinpoint regulatory nodes and potential disruptions in the urea cycle.
Enzyme Activity Assays
Enzyme activity assays are crucial for understanding the functional status of enzymes involved in the urea cycle. Our enzyme activity assay service includes:
Specific Assays: Quantitative measurement of key enzyme activities such as carbamoyl phosphate synthetase I, ornithine transcarbamylase, argininosuccinate synthetase, argininosuccinate lyase, and arginase.
High-Throughput Capabilities: Enabling the analysis of multiple samples efficiently to support large-scale studies.
Functional Insights: Providing insights into enzyme kinetics, helping to elucidate the role of specific enzymes in metabolic regulation and potential enzymatic deficiencies.
Biomarker Discovery
Our biomarker discovery service focuses on identifying and validating biomarkers related to urea cycle disorders. This service includes:
Comprehensive Screening: Using advanced LC-MS/MS, GC-MS and NMR technologies to screen for potential biomarkers across various biological samples.
Validation Studies: Conducting validation studies to confirm the clinical relevance and diagnostic utility of identified biomarkers.
Customized Solutions: Offering tailored biomarker discovery projects to meet specific research goals and clinical applications.
Custom Metabolomics Projects
Creative Proteomics understands that each research project has unique requirements. Our custom metabolomics projects service provides:
Tailored Experimental Design: Working closely with clients to design experiments that address specific research questions and objectives.
Flexible Analytical Options: Offering a range of analytical techniques and platforms to suit different types of samples and research needs.
Comprehensive Data Analysis: Providing detailed data analysis and interpretation, including statistical analysis, pathway mapping, and integration with other omics data.
List of Detectable Urea Cycle Metabolism Products
Our advanced analytical techniques allow us to detect and quantify a comprehensive array of metabolites involved in the urea cycle. Below is a list of detectable urea cycle metabolites:
| Ammonia | Carbamoyl phosphate | Citrulline | Ornithine | Arginine |
| Argininosuccinate | Fumarate | Urea | Aspartate | N-Acetylglutamate |
| L-Glutamate | L-Citrulline | L-Aspartate | L-Arginine | L-Ornithine |
Our Advantages
- High Sensitivity Detection : Utilizes LC-MS/MS, GC-MS, and other techniques to accurately detect low-abundance urea cycle metabolites, enhancing research reliability.
- Comprehensive Metabolic Analysis : Provides metabolite quantification, flux analysis, and enzyme activity detection for a thorough understanding of urea cycle dynamics.
- Customized Services : Tailors experimental plans based on client needs, offering flexible analytical techniques to meet specific research goals.
- Detailed Technical Reports : Includes complete experimental workflows, parameter settings, and data analysis to ensure reproducibility and data reliability.
Technical Platforms
Liquid Chromatography-Mass Spectrometry (LC-MS/MS) is highly sensitive and specific, allowing simultaneous detection and quantification of multiple urea cycle intermediates and related metabolites. This technique is crucial for profiling complex metabolic pathways and identifying subtle changes in metabolite concentrations.
Gas Chromatography-Mass Spectrometry (GC-MS) excels in separating and analyzing volatile metabolites and small molecules within the urea cycle. It provides high resolution and sensitivity, making it suitable for precise quantification and structural elucidation of metabolites like ammonia and organic acids.
Nuclear Magnetic Resonance (NMR) Spectroscopy offers non-destructive analysis and detailed structural information about urea cycle metabolites. It is valuable for studying molecular interactions, metabolic fluxes, and pathway dynamics.
Enzyme-Linked Immunosorbent Assay (ELISA) allows for specific and quantitative measurement of enzymes and metabolites involved in the urea cycle. It provides reliable data on enzyme activity levels, aiding in the assessment of metabolic function and potential enzymatic deficiencies.
High-Performance Liquid Chromatography (HPLC) is used for separating and quantifying urea cycle metabolites with high resolution and efficiency. It is versatile, accommodating a wide range of sample matrices and metabolite types.
Thermo Q ExactiveTM series
AB Sciex 6500+
Thermo Orbitrap Fusion Lumos
Bruker timsTOF Pro
Sample Requirements
| Sample type | Recommended sample size | Pre-treatment and storage |
|---|---|---|
| Tissue | 100-200 mg | Snap freezing in liquid nitrogen, stored at -80℃. |
| Urine | 200-500 μL | 5000×g 4℃ Centrifuge for 30-60min, remove supernatant, store at -80℃. |
| Serum/plasma | >100 μL | Collected serum/plasma, snap freezing in liquid nitrogen, stored at -80℃. |
| Cerebrospinal fluid, amniotic fluid, bile and other body fluids | >200 μL | 4℃ Centrifuge for 10min, (or filter using 0.22μm membrane), remove supernatant and store at -80℃. |
| Suspension cells | >1*107 | Centrifuge and collect cells after liquid nitrogen snap freezing and store at -80℃. |
| Walled cells | >1*107 | Cultured walled cells are stored in 1.5ml centrifuge tubes, snap freezing in liquid nitrogen and stored at -80℃. |
| Cell supernatant | >2 mL | centrifuge at 4℃ for 3 minutes, take the supernatant and store at -80℃. |
Reports
- A detailed technical report will be provided at the end of the whole project, including the experiment procedure, MS/MS instrument parameters.
- Analytes are reported as uM or ug/mg (tissue), and CV's are generally<10%.
- The name of the analytes, abbreviation, formula, molecular weight and CAS# would also be included in the report.
Appliacations of Urea Cycle Metabolism
Inherited Metabolic Disorders
Helps diagnose and study urea cycle disorders (UCDs), such as ornithine transcarbamylase deficiency, for better therapeutic strategies.
Liver Function and Disease Research
Investigates hepatic ammonia detoxification and metabolic dysfunctions in liver diseases, including cirrhosis and hepatic encephalopathy.
Cancer Metabolism Studies
Explores altered urea cycle enzyme activity in tumors, aiding in understanding cancer proliferation and potential metabolic targets.
Drug Development and Toxicology
Assesses the impact of pharmaceuticals on nitrogen metabolism, supporting drug safety evaluation and therapeutic innovations.
Demo Results
Figures come from (Li, Y.et.al, Sci Rep,2023)

Quickly show the distribution of samples across principal components.

OPLS-DA point cloud diagram
Illustrate the separation of sample groups in a multidimensional space.

Plot of multiplicative change volcanoes
Volcano plot depicting multiplicative changes in metabolite levels.

Sample Hierarchical Clustering
Each column in the figure represents a sample
Urea Cycle Metabolism FAQs
What is the role of the urea cycle in metabolism?
The urea cycle plays a crucial role in metabolism by converting toxic ammonia into urea for excretion. The key functions of the urea cycle are:
- Ammonia removal: The urea cycle converts highly toxic ammonia (NH3) into the less toxic compound urea (CO(NH2)2) for excretion.
- Nitrogen waste disposal: Amino acid catabolism results in the production of waste ammonia. The urea cycle allows organisms to safely remove this nitrogen waste by converting it to urea, which is then excreted in urine.
- pH regulation: The urea cycle consumes acidic waste carbon dioxide by combining it with the basic ammonia, helping to maintain a neutral pH in the body.
- Energy production: The urea cycle produces two NADH molecules that can be used to generate up to 5 ATP through the electron transport chain, providing a net energy gain for the process.
- Gluconeogenesis: The urea cycle produces oxaloacetate, which can be used as a substrate for gluconeogenesis to produce glucose.
What are the 4 steps of urea cycle?
The urea cycle consists of the following four main steps:
- Formation of Carbamoyl Phosphate: The cycle begins in the mitochondria of liver cells, where ammonia (NH₃) derived from amino acid breakdown and bicarbonate (HCO₃⁻) react to form carbamoyl phosphate. This reaction is catalyzed by the enzyme carbamoyl phosphate synthetase I (CPS I), which requires ATP for energy.
- Formation of Citrulline: Carbamoyl phosphate combines with ornithine to produce citrulline. This reaction is facilitated by the enzyme ornithine transcarbamylase (OTC) and occurs within the mitochondria of liver cells.
- Transport of Citrulline: Citrulline is transported from the mitochondria into the cytosol of liver cells, where further steps of the urea cycle take place.
- Synthesis of Urea: In the cytosol, citrulline reacts with aspartate to form argininosuccinate, catalyzed by argininosuccinate synthetase. Argininosuccinate is then converted into arginine and fumarate by argininosuccinate lyase. Arginine is hydrolyzed by arginase to produce urea and regenerate ornithine, which can re-enter the urea cycle for further ammonia detoxification.
Is urea produced by metabolism?
Yes, urea is produced as a result of metabolic processes, specifically the urea cycle. This cycle primarily occurs in the liver, where ammonia, derived from the breakdown of amino acids and other nitrogenous compounds, is converted into urea. Urea is then transported via the bloodstream to the kidneys, where it is filtered out of the blood and excreted in urine.
Is the urea cycle catabolism or anabolism?
The urea cycle is considered a catabolic process. Catabolism refers to metabolic pathways that involve the breakdown of larger molecules into smaller ones, releasing energy and producing simpler compounds. In the case of the urea cycle, amino acids (which are anabolic in nature) are broken down, and their nitrogen components are processed through the urea cycle to produce urea. This process helps maintain nitrogen balance in the body by eliminating excess nitrogen in the form of urea, thereby preventing the accumulation of toxic ammonia.
Learn about other Q&A about other technologies.
Publications
Here are some publications in Metabolomics research from our clients:

- Lipid droplet-associated lncRNA LIPTER preserves cardiac lipid metabolism. 2023. https://doi.org/10.1038/s41556-023-01162-4
- WI12 Rhg1 interacts with DELLAs and mediates soybean cyst nematode resistance through hormone pathways. 2022. https://doi.org/10.1111/pbi.13709
- Disruption of CYCLOPHILIN 38 function reveals a photosynthesis-dependent systemic signal controlling lateral root emergence. 2020. https://doi.org/10.1101/2020.03.11.985820
- Quantifying forms and functions of intestinal bile acid pools in mice. 2024. https://doi.org/10.1101/2024.02.16.580658
- Non-invasive elevation of circulating corticosterone increases the rejection of foreign eggs in female American robins (Turdus migratorius). 2022. https://doi.org/10.1016/j.yhbeh.2022.105278
References
- Mourad M et al. Brain Biomarkers of Long-Term Outcome of Neonatal Onset Urea Cycle Disorder. International Journal of Neonatal Screening. 2016; 2(4):10. https://doi.org/10.3390/ijns2040010
- Zhang, Y et al. (2024). Hierarchical tricarboxylic acid cycle regulation by hepatocyte arginase 2 links the urea cycle to oxidative metabolism. Cell metabolism, 36(9), 2069–2085.e8. https://doi.org/10.1016/j.cmet.2024.07.007
- Hu, S. H et al. (2023). Amino acids downregulate SIRT4 to detoxify ammonia through the urea cycle. Nature metabolism, 5(4), 626–641. https://doi.org/10.1038/s42255-023-00784-0