Introduction
Metabolomics operates at a fundamentally different scale than single-analyte or single-interaction assays. A single biological specimen may contain thousands of chemically distinct metabolites spanning polar amino acids to nonpolar lipids, spanning a dynamic range of six or more orders of magnitude. Unlike targeted binding assays that measure one interaction at a time—such as surface plasmon resonance studies of antibody-antigen kinetics—metabolomics must simultaneously detect, identify, and quantify hundreds to thousands of small molecules in a single analytical run. The choice of analytical technique determines not just which metabolites are detected, but whether the data are interpretable at all.
This guide is organized around research scenarios rather than analytical modalities. Instead of presenting mass spectrometry, chromatography, and nuclear magnetic resonance spectroscopy as isolated techniques, the following sections walk through the five most common metabolomics workflows—untargeted profiling, targeted quantification, spatial mapping, single-cell analysis, and metabolic flux analysis—and provide decision criteria for selecting the appropriate instrument platform, separation strategy, and data processing pipeline for each. All applications discussed herein are intended for research use only.
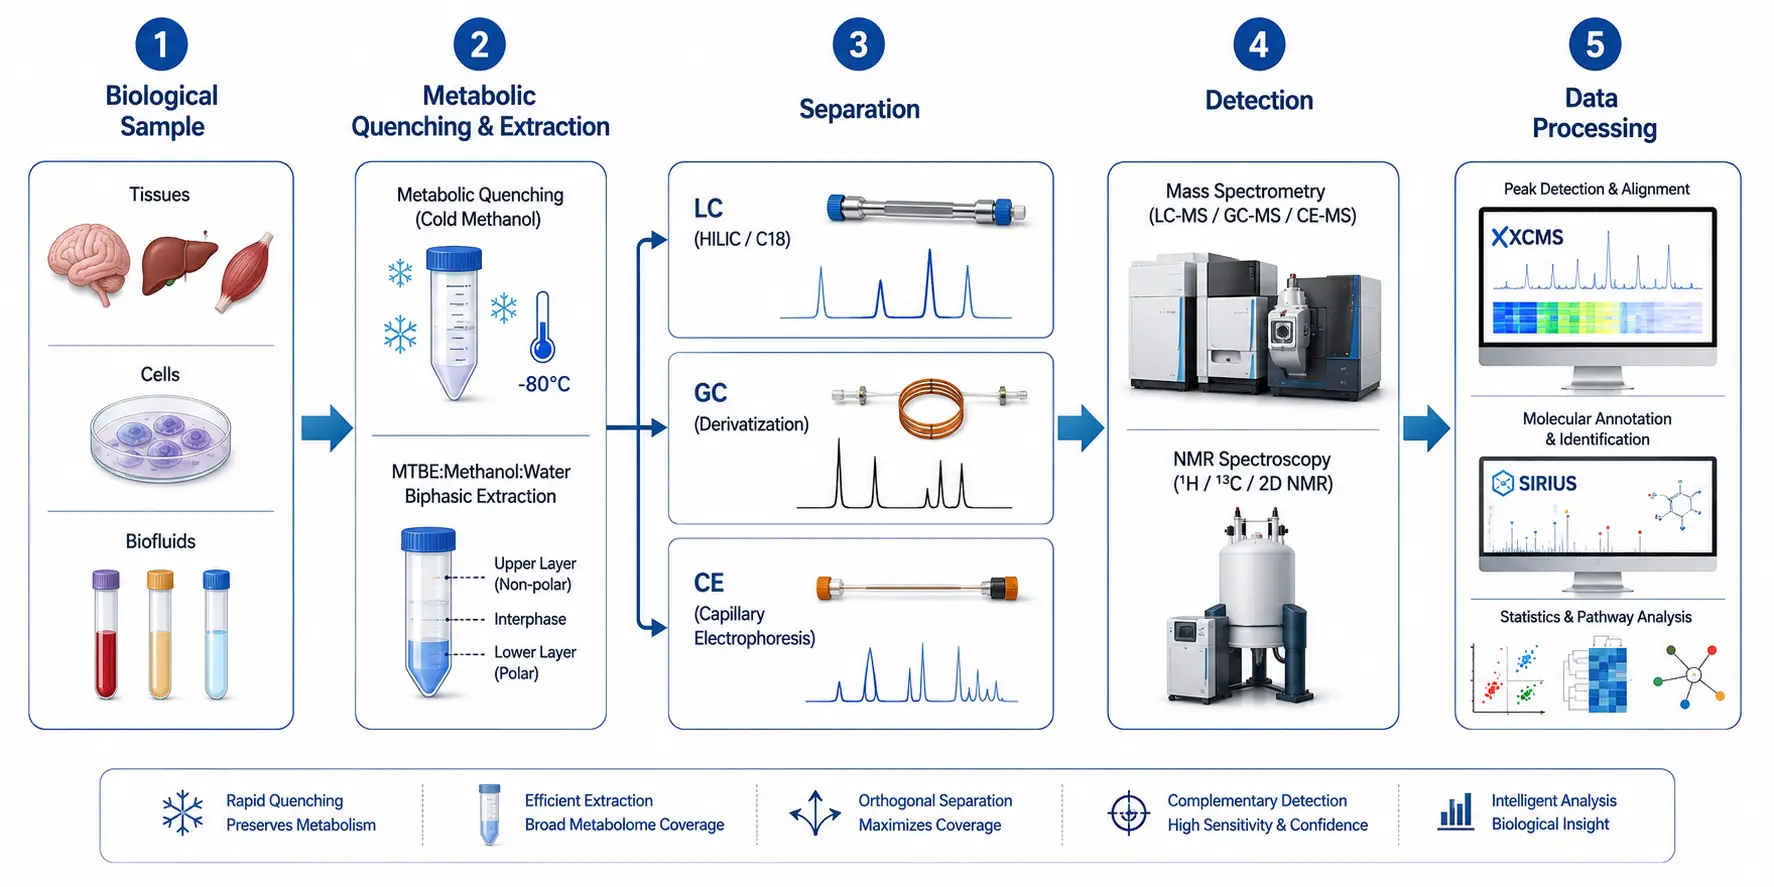 Figure 1. Metabolomics Analytical Pipeline Flowchart
End-to-end workflow from biological sample through metabolic quenching, extraction, separation, detection, and bioinformatic interpretation.
Navigating the Analytical Pipeline: From Sample to Signal
The metabolomics analytical pipeline consists of four interconnected stages, each with distinct failure points that compound across subsequent steps. Understanding these stages is prerequisite to selecting any specific instrument or method.
Metabolic Quenching and Sample Stability
Metabolite turnover rates span sub-second (ATP, NADH) to minutes (cholesterol), meaning that the metabolic snapshot captured in a sample is only meaningful if enzymatic activity is stopped instantaneously. The two most widely validated quenching protocols are rapid immersion in cold methanol (−80°C, 60% v/v methanol:water) and direct snap-freezing in liquid nitrogen. Methanol quenching is preferred for suspension cultures and liquid biopsies because it simultaneously precipitates proteins; however, leakage of intracellular metabolites into the quenching solution can exceed 30% for polar metabolites if the methanol fraction deviates from the 60% optimum. pH is an underappreciated variable: acidic methanol (pH 3–4) stabilizes acyl-CoAs and sugar phosphates, while neutral methanol preserves nucleotide pools. For tissue samples, liquid nitrogen clamping followed by cryogenic grinding at −80°C retains the best metabolic integrity. A 2026 study demonstrated that dried blood spot (DBS) extraction provides comparable metabolite coverage to conventional plasma extraction for non-targeted metabolomics, with the logistical advantage of room-temperature storage and transport, though labile metabolites such as ATP and NADH degrade within 7 days under DBS conditions.
Extraction Efficiency Across Metabolite Classes
No single solvent system extracts all metabolites with acceptable recovery. The standard compromise is biphasic extraction using methyl tert-butyl ether (MTBE):methanol:water (2:2:1.8, v/v/v), which partitions polar metabolites into the aqueous methanol phase, lipids into the organic MTBE phase, and precipitates proteins at the interface. Recoveries for amino acids, organic acids, and nucleotides in the aqueous phase routinely exceed 85%. However, highly polar phosphorylated intermediates (e.g., glucose-6-phosphate, 2,3-bisphosphoglycerate) require dedicated extraction protocols using 0.1 M HCl in methanol:water (1:1) to prevent precipitation with the protein pellet. For plant tissue metabolomics, the presence of phenolic compounds and chlorophyll necessitates additional solid-phase extraction cleanup before LC-MS analysis to prevent ion suppression.
Separation-Detection Coupling
The coupling of a separation technique to a detector defines the analytical coverage window. Liquid chromatography (LC) separates non-volatile and thermally labile metabolites across a polarity range extending from highly polar (hydrophilic interaction LC, HILIC) to nonpolar (reversed-phase C18). Gas chromatography (GC) requires chemical derivatization to render polar metabolites volatile—typically two-step methoximation followed by trimethylsilylation—and covers primary metabolites including amino acids, organic acids, and sugars. Capillary electrophoresis (CE) separates charged analytes by their electrophoretic mobility, offering complementary coverage of ionic metabolites that are poorly retained on both reversed-phase and HILIC columns. The practical implication for comprehensive metabolomics is that a single-platform approach typically detects only 30–50% of the detectable metabolome; multi-platform integration (LC-MS + GC-MS + CE-MS) is required for coverage exceeding 70%.
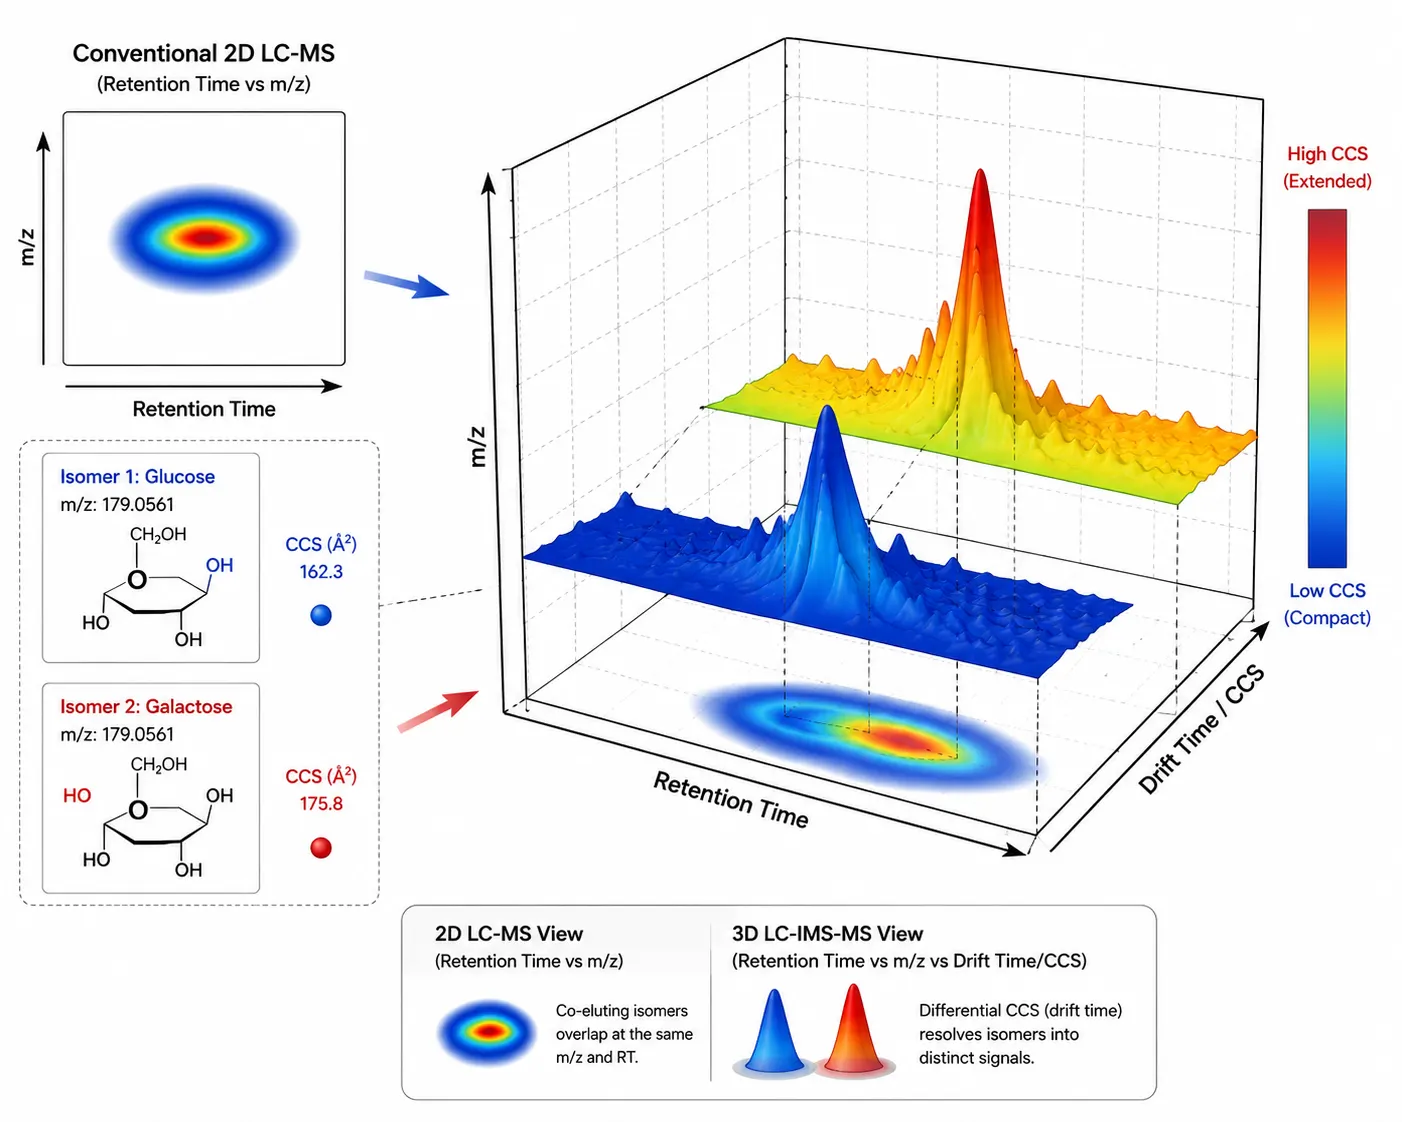 Figure 2. Ion Mobility Separation Adding a CCS-Based Dimension to Untargeted Metabolomics
Collision cross-section (CCS) values provide a third separation axis beyond retention time and m/z, resolving isobaric and isomeric metabolites.
Untargeted Profiling: Maximum Coverage Through Multi-Platform Integration
Untargeted metabolomics aims to detect as many metabolites as possible without preselection bias. The workflow generates hundreds to thousands of molecular features per sample, which must be filtered, aligned, and annotated before biological interpretation.
Platform Architecture: DDA vs DIA
The choice between data-dependent acquisition (DDA) and data-independent acquisition (DIA) is the first major branching point in untargeted LC-MS metabolomics. In DDA mode, the instrument selects the most abundant precursor ions from a survey scan for fragmentation, producing clean MS/MS spectra at the cost of stochastic undersampling—lower-abundance features may never be selected for fragmentation, especially in complex matrices where co-eluting metabolites compete for precursor selection. DIA mode fragments all precursor ions within a defined m/z window (typically 10–25 Da), producing chimeric MS/MS spectra that contain fragments from multiple co-eluting precursors. The trade-off is straightforward: DDA provides cleaner spectra for higher-confidence annotation at the expense of coverage completeness, while DIA achieves near-complete feature detection but requires spectral deconvolution algorithms that are still maturing. For most untargeted studies, a DDA-first strategy using technical replicate injections to recover undersampled features represents the practical compromise.
Ion Mobility Spectrometry: The Third Separation Dimension
The most significant advance in untargeted metabolomics workflow design since 2024 is the integration of ion mobility spectrometry (IMS) with LC-MS. IMS separates gas-phase ions by their collision cross-section (CCS)—a physical property determined by molecular shape and charge distribution—before they enter the mass analyzer. This adds a third orthogonal separation dimension beyond retention time and m/z. The practical benefits are twofold. First, IMS resolves isomeric and isobaric metabolites that co-elute chromatographically but differ in shape. In conventional LC-MS, co-eluting isomers produce overlapping extracted ion chromatograms that cannot be distinguished; with IMS, each isomer arrives at the detector at a distinct drift time, enabling separate quantification. Second, the CCS value serves as a reproducible physicochemical descriptor that can be compared across laboratories and instrument platforms, providing an orthogonal confidence metric for metabolite annotation. A 2026 study published in Nature Methods demonstrated that IMS-resolved mass cytometry achieves deep coverage of single-cell metabolomes, detecting over 200 metabolites per single cell—a coverage level previously achievable only from bulk lysates. For LC-MS/MS untargeted metabolomics, incorporating IMS increases the number of confidently annotated features by 40–60% compared to LC-MS-only workflows.
Batch Effect Correction and Quality Control
Untargeted metabolomics runs of 100+ samples inevitably accumulate instrument drift: retention time shifts, sensitivity decay, and MS/MS quality degradation. Systematic batch effects, if uncorrected, can obscure biological signals or introduce spurious associations. The standard mitigation strategy embeds pooled quality control (QC) samples at regular intervals—one QC injection per every 5–10 analytical samples. QC samples are prepared by pooling equal aliquots from all study samples, ensuring that the QC matrix is chemically representative. During data processing, QC-based correction algorithms (e.g., LOESS normalization, support vector regression) model the signal drift across the injection sequence and normalize each feature to the QC trend line. Features with a coefficient of variation above 30% in QC replicates after correction are typically excluded from downstream analysis. An orthogonal QC metric is the injection of stable isotope-labeled internal standards (SIL-IS) spiked into every sample before extraction; at least three SIL-IS covering early, middle, and late retention times should be included to monitor retention time stability and ionization efficiency independently of the statistical correction.
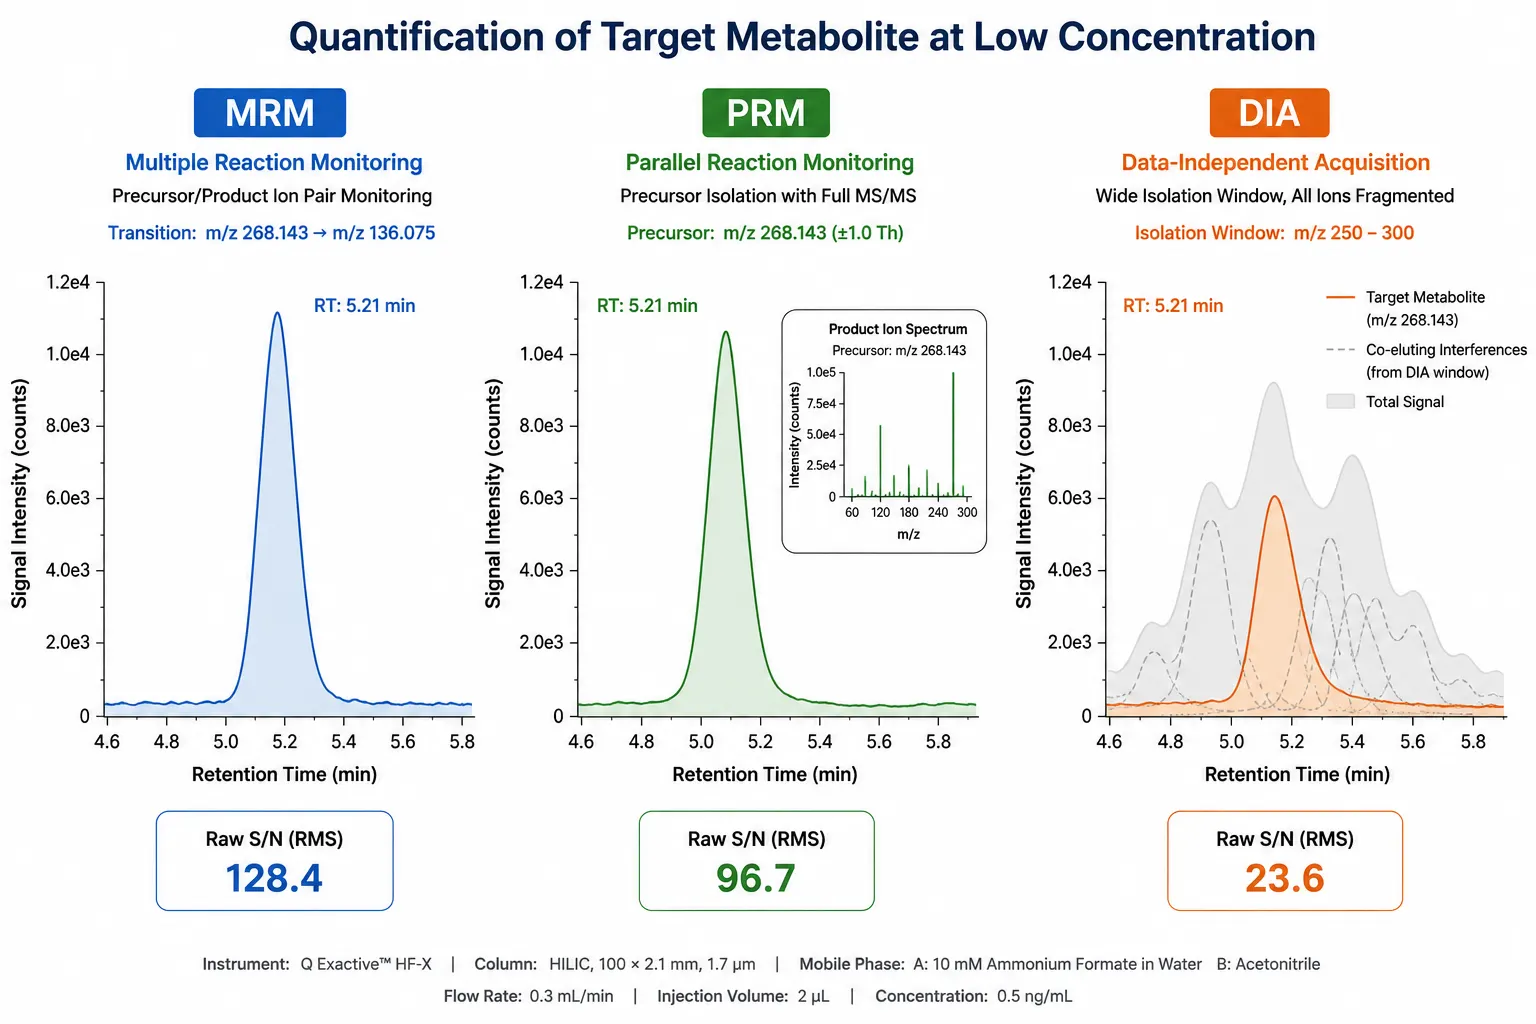 Figure 3. MRM, PRM, and DIA Quantification Signal Comparison
Signal traces comparing the sensitivity and specificity of multiple reaction monitoring, parallel reaction monitoring, and data-independent acquisition for targeted metabolite quantification.
Targeted Quantification: Precision at Scale for Hypothesis-Driven Studies
When the research question centers on a defined panel of metabolites—quantifying specific pathway intermediates, validating biomarker candidates, or measuring drug-induced metabolic changes—targeted quantification provides the analytical precision that untargeted approaches cannot match.
Acquisition Modes: MRM vs PRM vs DIA-Based Quantification
Triple quadrupole instruments operating in multiple reaction monitoring (MRM) mode remain the gold standard for targeted quantification. MRM isolates a specific precursor ion in Q1, fragments it in Q2, and monitors a diagnostic product ion in Q3. The double mass filtering eliminates chemical noise from co-eluting matrix components, achieving limits of quantification in the low nanomolar to picomolar range for most metabolites. The limitation of MRM is that each metabolite requires a dedicated transition (precursor-to-product pair), and the number of transitions that can be monitored simultaneously in a single injection is limited by the dwell time required for adequate signal—typically 300–500 metabolites per run on a modern triple quadrupole.
Parallel reaction monitoring (PRM) performed on high-resolution accurate-mass (HRAM) instruments (Orbitrap, Q-TOF) replaces the Q3 ion filter with full-scan high-resolution acquisition of all fragment ions from the isolated precursor. The advantage is that the entire product ion spectrum is available for quantification, enabling post-acquisition selection of the cleanest fragment ion and retrospective interference checking. PRM achieves comparable sensitivity to MRM for metabolites above m/z 200 and is increasingly preferred for targeted panels of 50–200 metabolites where transition optimization time is a constraint.
DIA-based quantification extracts quantitative information from untargeted DIA datasets by matching retention time and fragmentation spectra of the features of interest against a spectral library. This approach, sometimes termed "retrospective targeting," requires no a priori transition design and enables quantification of hundreds of metabolites from a single DIA injection that was originally acquired for untargeted profiling. The trade-off is reduced sensitivity compared to MRM or PRM—approximately 5- to 10-fold higher limits of quantificationbecause the DIA window fragments all co-eluting precursors simultaneously, diluting the signal for any single target.
Stable Isotope Internal Standard Strategy
The accuracy of targeted quantification depends on correcting for matrix effects—the suppression or enhancement of ionization caused by co-eluting endogenous compounds. The most reliable correction uses stable isotope-labeled (SIL) internal standards: each target metabolite is spiked with its isotopologue (typically 2H, 13C, or 15N-labeled version at 2–5 Da heavier) before extraction, and quantification is based on the peak area ratio of the endogenous analyte to its labeled counterpart. The SIL-IS corrects for extraction recovery, injection volume variation, and ionization efficiency simultaneously. When an SIL-IS is not commercially available for every target (which is the case for most specialized metabolites), a surrogate strategy uses structurally analogous labeled compounds—for example, using d3-cholic acid to correct for chenodeoxycholic acid measurement in bile acid profilingthough the correction accuracy decreases as the structural similarity between target and surrogate decreases. At minimum, each analytical batch should include at least one SIL-IS per chromatographic retention time window to capture matrix effect variation across the gradient.
High-Resolution MRM on Hybrid Instruments
High-resolution MRM (HR-MRM) on Q-Orbitrap platforms combines the selectivity of quadrupole isolation with high-resolution product ion detection. The key advantage over unit-resolution MRM on triple quadrupoles is the ability to distinguish the target fragment ion from isobaric interferences at the same nominal mass. For metabolites with complex fragmentation patterns—such as— tryptophan pathway intermediates in tryptophan metabolism analysisHR-MRM eliminates false-positive peaks that meet the nominal mass transition but arise from a different chemical species. The trade-off is a 2- to 3-fold reduction in acquisition speed compared to unit-resolution MRM, which limits the total number of transitions in a single injection.
Spatial Metabolomics: Mapping Metabolite Distributions in Native Tissue
Conventional metabolomics workflows homogenize the sample before extraction, destroying all spatial information about where each metabolite was located within the tissue. Spatial metabolomics preserves and records this spatial dimension by analyzing metabolite distributions directly on intact tissue sections using mass spectrometry imaging (MSI). The technique answers questions that bulk profiling cannot: Which metabolites are enriched in the tumor core versus the invasive margin? Where are neurotransmitter gradients distributed across brain regions? Do drug metabolites accumulate in specific tissue compartments?
Mass Spectrometry Imaging Modalities
Three MSI technologies dominate spatial metabolomics, each optimized for a different combination of spatial resolution, molecular coverage, and sample throughput. Matrix-assisted laser desorption/ionization (MALDI-MSI) applies an organic matrix to the tissue section, which absorbs laser energy and facilitates analyte desorption. MALDI-MSI achieves spatial resolution down to 5 microns—sufficient to resolve individual cell layers in tissueand covers metabolites, lipids, peptides, and proteins. The trade-off is that matrix application introduces background ions in the low m/z region (below 500 Da), interfering with metabolite detection below 200 Da. Desorption electrospray ionization (DESI-MSI) operates at ambient pressure without a matrix, spraying charged solvent droplets onto the tissue surface to desorb analytes. The absence of matrix background makes DESI-MSI the preferred platform for small-molecule metabolites and drugs, though its spatial resolution is limited to approximately 50 microns under standard conditions. Secondary ion mass spectrometry (SIMS) achieves the highest spatial resolutionbelow 1 micronby bombarding the tissue with a focused primary ion beam. SIMS is uniquely suited for subcellular metabolite mapping but has limited sensitivity above m/z 1,000 and causes more extensive molecular fragmentation than MALDI or DESI.
A 2024 Trends in Analytical Chemistry review of spatial metabolomics methods highlighted that the field is converging toward multi-modal integration—combining MALDI-MSI for lipid distributions with DESI-MSI for polar metabolites on adjacent tissue sections, then registering the two ion images to create a composite molecular atlas. A 2025 study in Angewandte Chemie demonstrated direct integration of DESI-MSI with Visium spatial transcriptomics on the same tissue section, enabling correlation of metabolite abundance with gene expression at 50 micron resolution. The experimental design of spatial omics studies requires careful consideration of tissue handling: snap-frozen tissue stored at −80°C without fixatives preserves metabolite integrity, while formalin-fixed paraffin-embedded (FFPE) samples lose most water-soluble metabolites during processing and are generally unsuitable for spatial metabolomics unless dedicated wash protocols are applied.
Data Processing and Interpretation Challenges
Spatial metabolomics generates large volumetric datasets—a single DESI-MSI experiment at 50 micron resolution on a 1 cm2 tissue section produces approximately 40,000 individual mass spectra, each containing hundreds of features. Peak picking and image registration must be automated, and metabolite annotation relies on the same spectral library matching used in bulk metabolomics, with the added complexity that ion images must be co-registered with histological stains (H&E, immunofluorescence) to anchor metabolite distributions to tissue morphology. Open-source platforms including MSIQuickView and SCiLS Lab provide automated ion image generation, while deep learning-based segmentation algorithms can identify tissue regions with distinct metabolic profiles without requiring manual annotation of histological features.
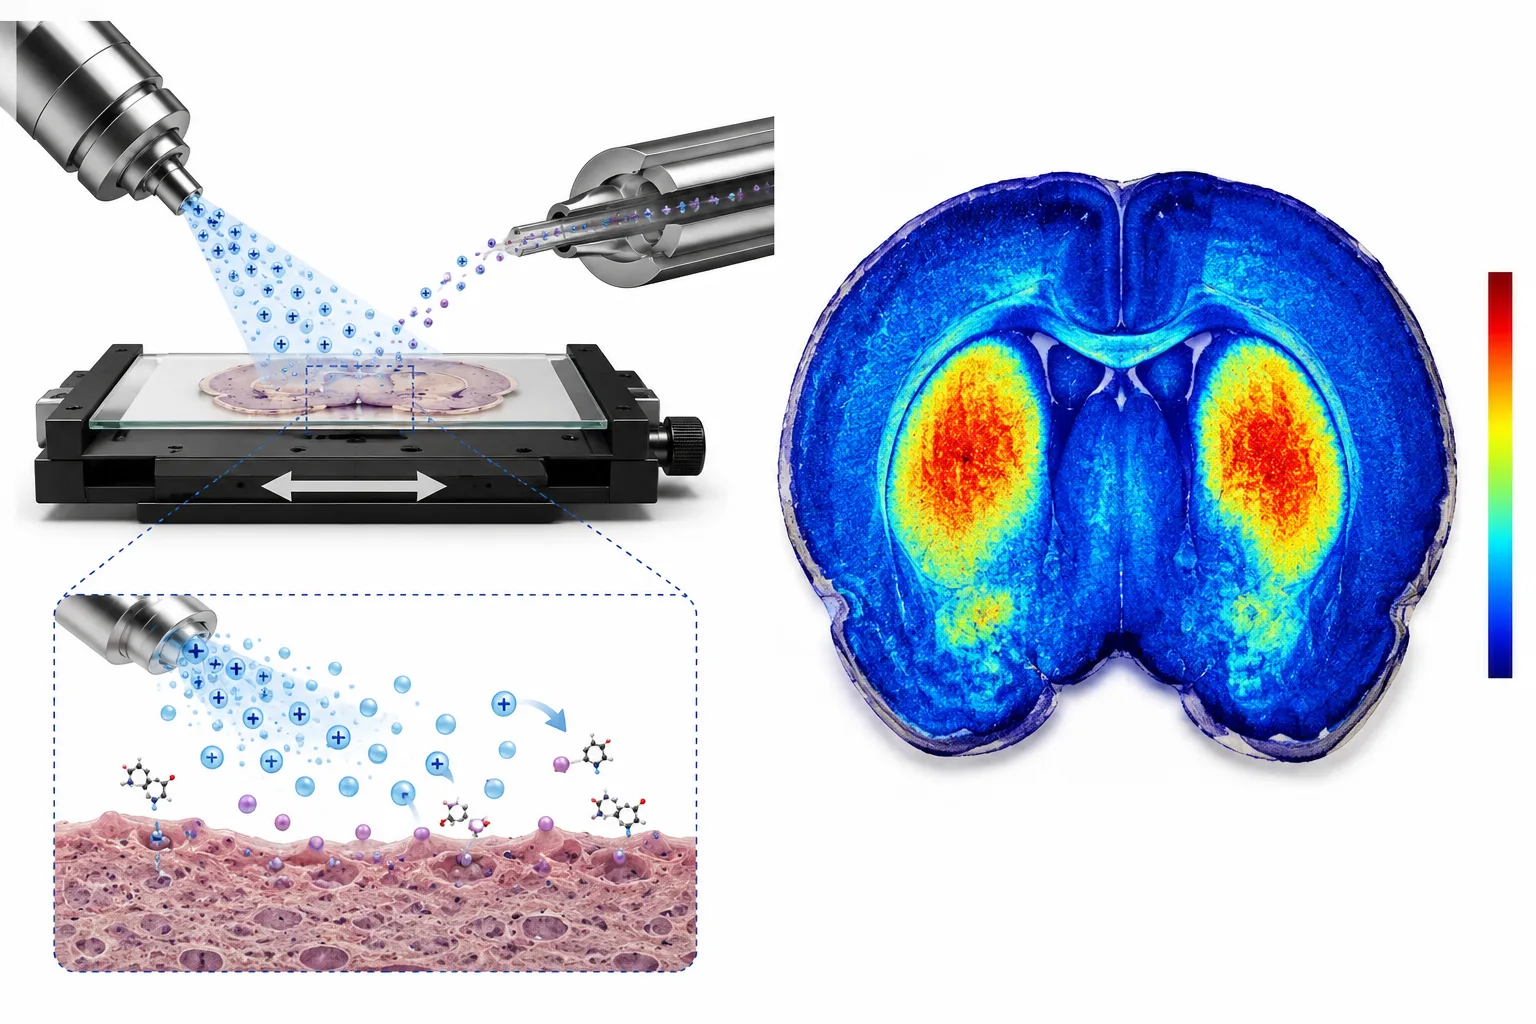 Figure 4. DESI-MSI Principle and Metabolite Tissue Distribution Heatmap
Ambient desorption electrospray ionization generating two-dimensional metabolite distribution maps overlaid on tissue histology.
Single-Cell Metabolomics: Probing Metabolic Heterogeneity at the Cellular Level
Bulk metabolomics averages metabolite concentrations across millions of cells, masking the metabolic heterogeneity that underlies cell-state transitions, drug resistance, and differentiation trajectories. Single-cell metabolomics aims to profile the metabolome of individual cells, revealing population-level distributions that are invisible in pooled measurements.
Technical Approaches and Their Trade-Offs
The central challenge of single-cell metabolomics is sensitivity: a typical mammalian cell contains approximately 0.1–1 pmol of total metabolite mass—orders of magnitude below the detection limit of conventional LC-MS systems optimized for bulk extracts. Three technical strategies have emerged. Nanoelectrospray ionization (nanoESI-MS) directly samples the contents of a single cell through a pulled glass capillary, delivering the entire metabolome into the mass spectrometer without chromatographic separation. The approach achieves detection limits in the attomole range but sacrifices isomer resolution because no separation step precedes the ionization. A 2026 Nature Methods study addressed this limitation by integrating ion mobility spectrometry with nanoESI single-cell—analysis: the IMS dimension separates isomeric metabolites by their CCS values before detection, enabling confident identification of over 200 metabolites per single cell—triple the coverage of nanoESI-MS without IMS. Mass cytometry (CyTOF) uses metal-tagged antibodies to probe predefined metabolite-related epitopes but cannot detect unknown metabolites and requires a panel design that constrains the discovery scope.
Live single-cell metabolomics represents the frontier of the field. A 2026 perspective in Chemical Science outlined the requirements for capturing dynamic metabolic changes in living cells: sub-second temporal resolution to track fast flux changes, minimal perturbation to the cellular environment during sampling, and the ability to correlate metabolite levels with cell fate outcomes (division, apoptosis, differentiation). Current live-cell—approaches include microfluidic trap-and-release systems coupled to nanoESI-MS and label-free optical imaging of NAD(P)H autofluorescence, though neither achieves both temporal resolution and metabolite coverage simultaneously.
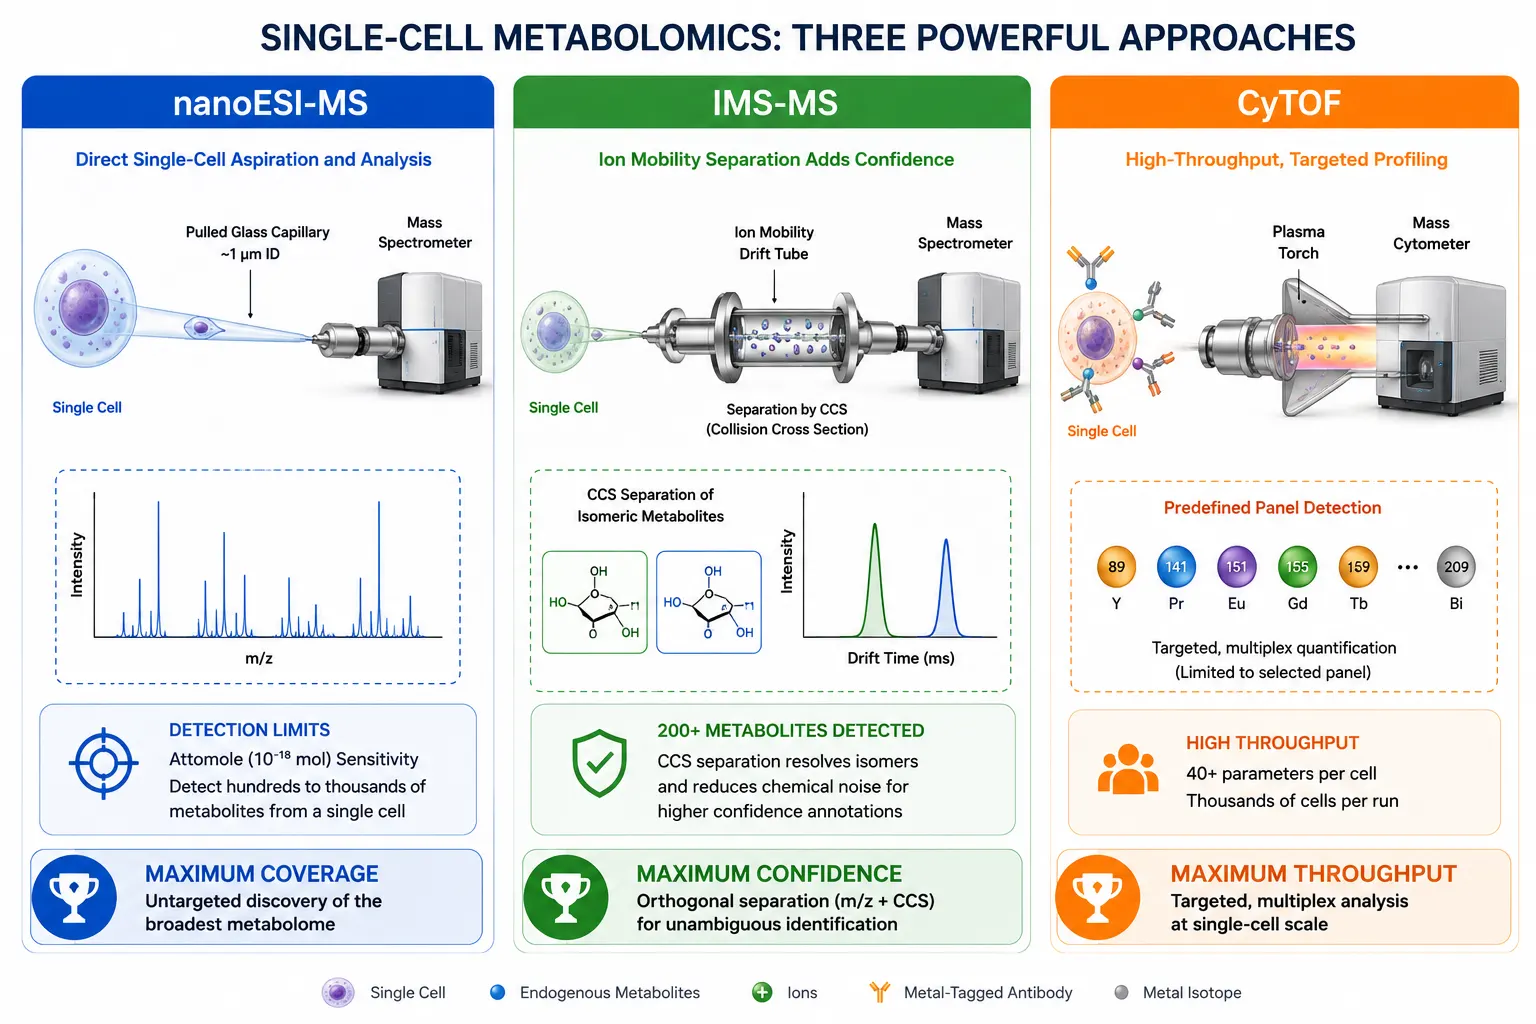 Figure 5. Single-Cell Metabolomics Technical Approaches Comparison
Comparative diagram of nanoESI-MS, IMS-resolved mass cytometry, and CyTOF for single-cell metabolite profiling.
Metabolic Flux Analysis: Beyond Static Concentration Snapshots
Metabolite concentrations are equilibrium snapshots; they do not reveal the rate at which metabolites flow through pathways. Metabolic flux analysis (MFA) measures these rates by tracking the incorporation of stable isotope labels—typically 13C into downstream metabolites over time, converting static concentration data into dynamic pathway activity maps.
Isotopic Tracing Principles
The MFA experiment begins by introducing a 13C-labeled tracer into the culture medium or perfusion system—most commonly [U-13C]glucose to probe central carbon metabolism or [U-13C]glutamine to assess anaplerotic pathways. As cells metabolize the labeled substrate, 13C atoms propagate through downstream metabolites according to the topology of the metabolic network. Mass spectrometry detects the resulting isotopic enrichment patterns (the fraction of each metabolite pool that carries one, two, or more 13C atoms), and computational fitting of these enrichment data to a metabolic network model yields the flux through each pathway. The choice of tracer determines which parts of the network are resolvable: [1,2-13C2]glucose distinguishes the oxidative and non-oxidative branches of the pentose phosphate pathway, while [U-13C]glutamine resolves glutaminolysis from glucose-dependent anaplerosis in central carbon metabolism analysis.
Experimental Design Considerations
Two experimental configurations dominate MFA. Steady-state MFA cultures cells under isotopic and metabolic steady state—typically 48–72 hours of labeling in continuous culture—and measures the steady-state labeling pattern of proteinogenic amino acids or free metabolites. Isotopic non-steady-state MFA (INST-MFA) tracks the time course of labeling after a bolus tracer addition, capturing flux dynamics on the timescale of minutes to hours. INST-MFA is required when studying metabolic transitions (e.g., upon drug treatment or nutrient withdrawal) or when the metabolic network is not at steady state. A practical consideration is that MFA data quality depends critically on GC-MS or LC-MS measurement of 13C enrichment, which requires the mass spectrometer to resolve isotopologue peaks separated by 1 Da—demanding sufficient mass resolution and isotopic purity of the tracer. At least three time points across the labeling curve are needed for INST-MFA to constrain the fitted flux estimates, and each time point should be measured in triplicate to assess technical variability. For researchers designing MFA studies, metabolic flux analysis services provide the analytical infrastructure for tracer selection, labeling optimization, and computational model fitting.
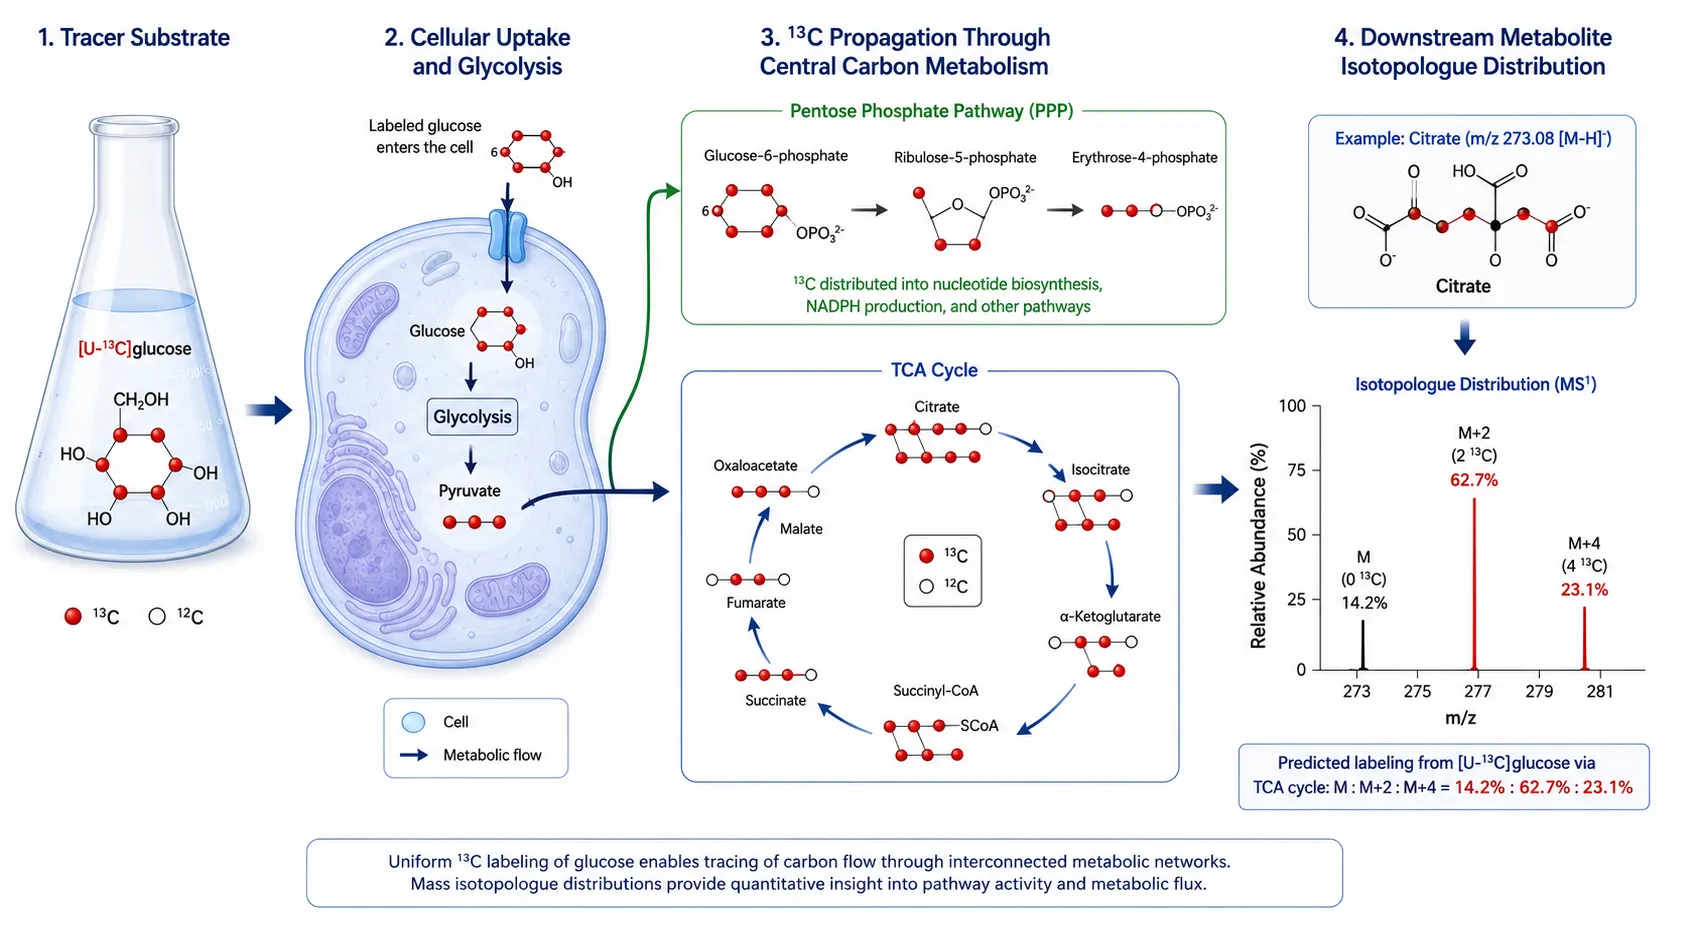 Figure 6. 13C Isotopic Tracing Pipeline for Metabolic Flux Analysis
Tracer incorporation pathway from labeled substrate through central carbon metabolism to downstream metabolites with isotopologue distribution readout.
AI and Machine Learning in Metabolomics Data Processing
Metabolomics datasets have grown too large and too complex for manual processing. A single untargeted LC-MS metabolomics experiment can generate 10^6–10^7 fragmentation spectra, far exceeding the throughput of expert spectral interpretation. Machine learning and deep learning methods are reshaping three stages of the metabolomics data pipeline: peak detection, metabolite annotation, and biological interpretation.
Automated Peak Detection and Alignment
Conventional peak detection algorithms (centWave, matchedFilter in XCMS) rely on fixed parameter thresholds for signal-to-noise ratio, peak width, and m/z tolerance—parameters that must be manually optimized for each dataset. Deep learning approaches, including DeepIon and Peakonly, learn peak shape distributions from training data and detect peaks without requiring instrument-specific parameter tuning. A 2024 study in Small Methods demonstrated that a convolutional neural network-based peak picker outperformed conventional algorithms by 30% in recall rate while maintaining equivalent precision, particularly for low-abundance metabolites and co-eluting peaks.
AI-Assisted Metabolite Annotation
Metabolite annotation—assigning a chemical identity to each detected feature—remains the rate-limiting step in untargeted metabolomics. The SIRIUS software suite, combined with CSI:FingerID, uses a deep neural network trained on >10^6 experimental and predicted fragmentation spectra to predict molecular fingerprints from MS/MS data and rank candidate structures. GNPS molecular networking clusters fragmentation spectra by similarity, enabling the propagation of annotations from confidently identified metabolites to structurally related unknowns. A 2026 review published in Metabolomics systematized the current state of AI applications in metabolomics data analysis, concluding that ML-based annotation achieves approximately 70–80% accuracy at the metabolite class level but only 40–50% at the exact isomer level, highlighting the continued need for orthogonal validation using retention time standards or IMS-derived CCS values. For researchers requiring expert-curated metabolite identification, unknown metabolites identification services combine computational annotation with manual spectral review to achieve higher confidence assignments.
Biological Interpretation via Machine Learning
Beyond annotation, ML models trained on metabolite-metabolite association networks and pathway databases can predict which metabolic pathways are perturbed in a comparison group without requiring a priori pathway selection. Knowledge-guided networks that integrate metabolite-metabolite correlation data with pathway topology (the "two-layer networking" approach described in a 2025 Nature Communications study) improve pathway enrichment specificity by 40% compared to conventional over-representation analysis. These approaches are particularly valuable for comprehensive metabolomics service projects where the biological interpretation scope is broad and the study aims to discover unexpected pathway perturbations.
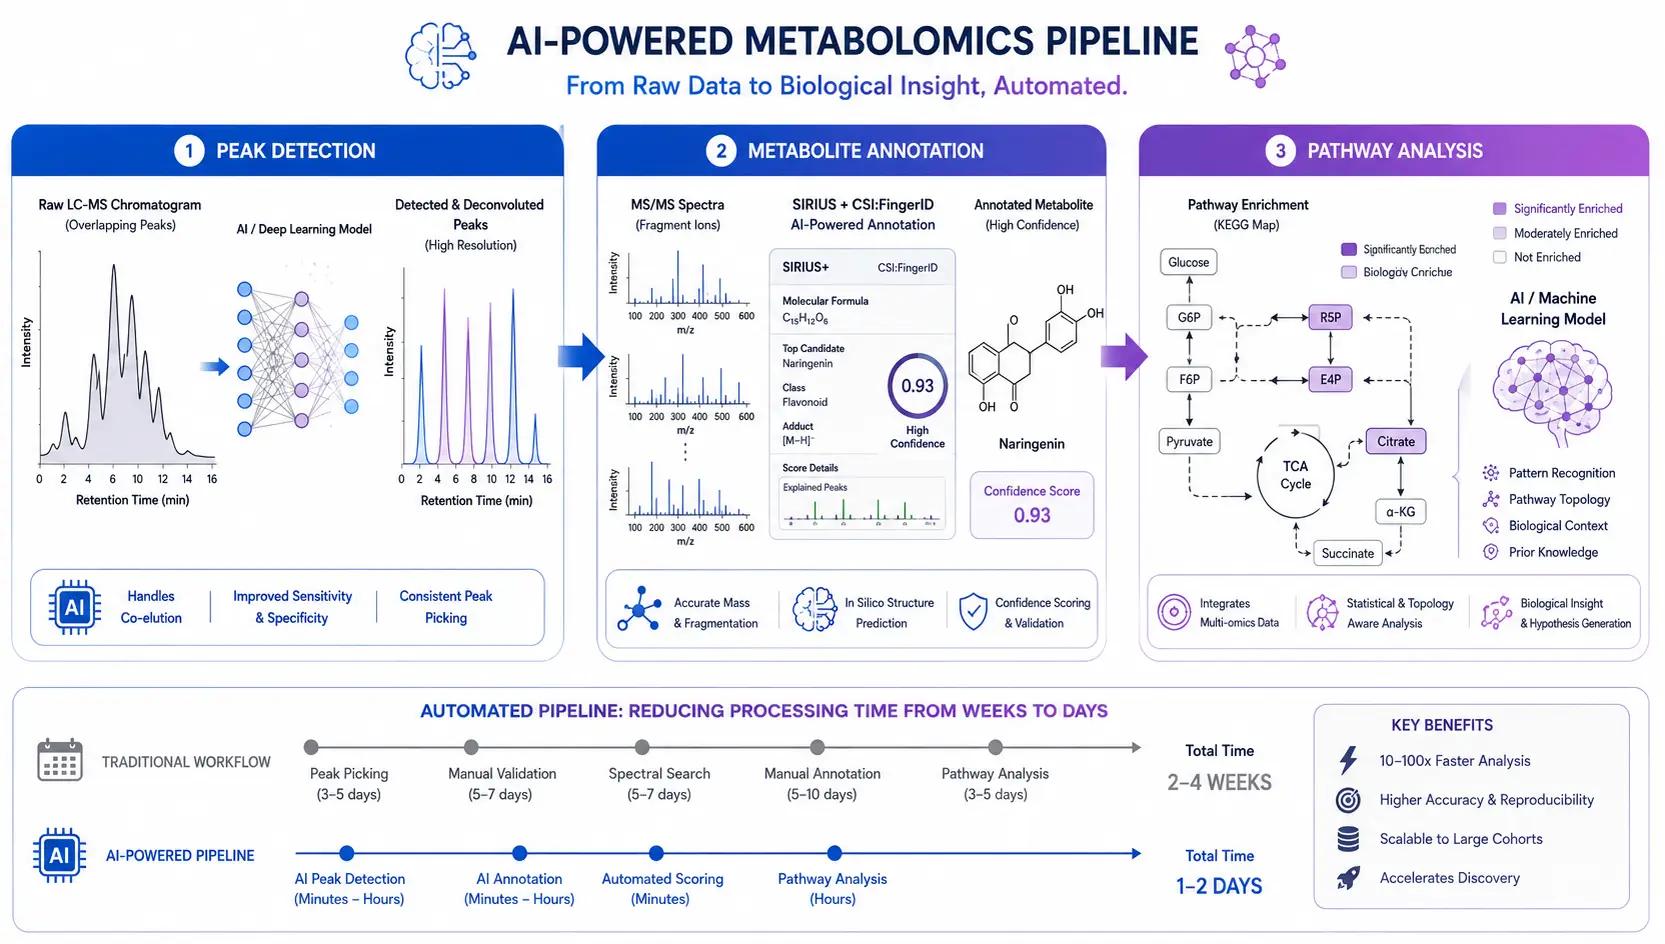 Figure 7. AI-Assisted Metabolomics Data Processing Pipeline
End-to-end machine learning workflow from raw MS data through peak detection, spectral annotation, and pathway enrichment analysis.
Technology Selection Decision Framework
Choosing the appropriate metabolomics workflow depends on the research question, sample type, and available resources. The following prioritization logic guides the decision process.
Step 1: Define the analytical goal. Is the study discovery-driven (untargeted) or hypothesis-driven (targeted)? For discovery, multi-platform untargeted profiling using LC-MS + GC-MS provides the broadest coverage. For hypothesis-testing, targeted MRM or PRM quantification achieves the highest precision.
Step 2: Assess sample constraints. Tissue biopsies require different sample preparation than biofluids. For small tissue samples (<5 mg), spatial metabolomics may be the only option that preserves both spatial context and analyte recovery. For rare cell populations (<10^4 cells), single-cell metabolomics is necessary to avoid averaging artifacts.
Step 3: Determine the required information depth. If pathway activity rates are needed rather than static concentrations, MFA with 13C tracing is mandatory. If tissue distribution patterns matter, MALDI-MSI or DESI-MSI should be prioritized.
Step 4: Evaluate bioinformatics capacity. Untargeted workflows generate datasets that require substantial computational infrastructure for peak picking, alignment, and annotation. Groups without dedicated bioinformatics support should consider using bioinformatics analysis for metabolomics services to handle the data processing pipeline.
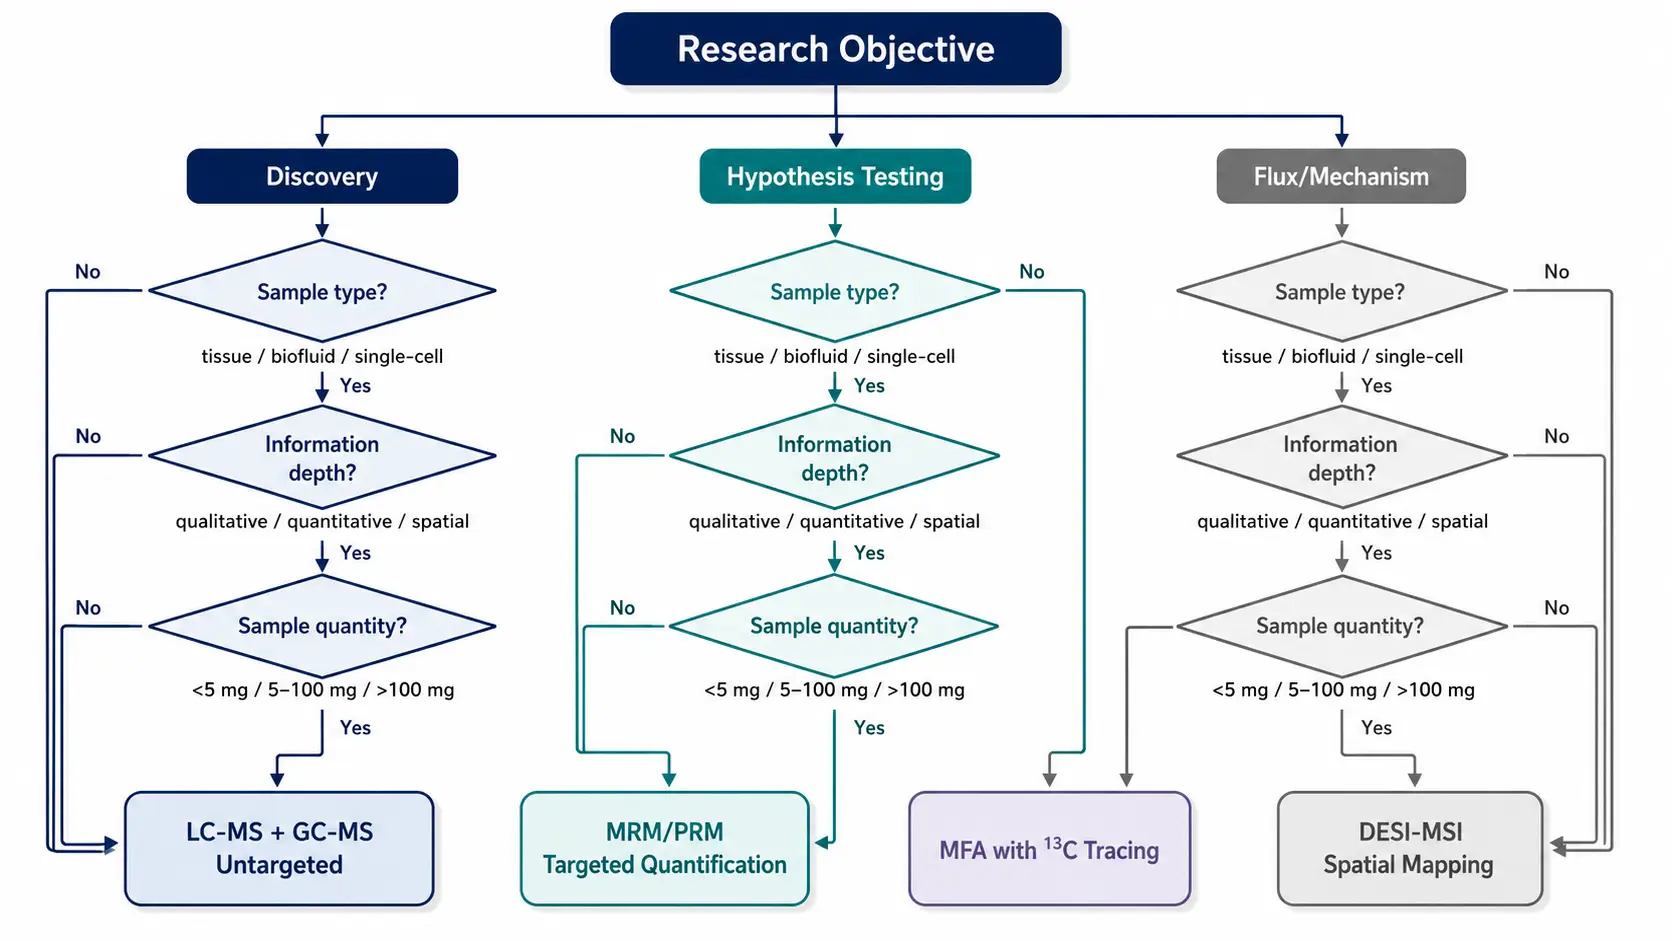 Figure 8. Metabolomics Technology Selection Decision Tree
Structured decision tree guiding workflow selection based on research objective, sample characteristics, and desired information depth.
FAQ
What is the difference between targeted and untargeted metabolomics?
Untargeted metabolomics aims to detect all detectable metabolites without preselection bias, generating discovery-oriented data for hypothesis generation. Targeted metabolomics measures a predefined panel of metabolites with optimized accuracy and precision, suitable for hypothesis testing and biomarker validation.
How do I choose between LC-MS and GC-MS for my sample type?
LC-MS covers non-volatile and thermally labile metabolites including most lipids, amino acids, and nucleotides across a wide polarity range. GC-MS requires derivatization and is limited to volatile or derivatizable compounds—primarily primary metabolites, organic acids, and sugars. For comprehensive coverage, both platforms should be used in parallel.
What is the minimum sample volume needed for single-cell metabolomics?
Single-cell metabolomics analyzes individual cells, so the relevant quantity is cell number rather than volume. Each single-cell measurement consumes one cell. NanoESI-MS requires approximately 1 pL of cell volume, equivalent to a single mammalian cell. For bulk reference, at least 10^5 cells are needed for conventional LC-MS.
How does ion mobility spectrometry improve metabolite identification?
IMS adds collision cross-section (CCS) values as an orthogonal identification metric. Co-eluting isomers that produce identical MS/MS spectra can be distinguished by their different CCS values. CCS measurement reproducibility across laboratories is approximately 2%, making it a reliable confidence metric for metabolite annotation.
Can spatial metabolomics be combined with transcriptomics or proteomics?
Yes. Multi-modal integration of DESI-MSI with spatial transcriptomics (Visium) and MALDI-MSI with immunofluorescence has been demonstrated on adjacent or even the same tissue sections. These integrated approaches correlate metabolite distributions with gene expression and protein localization at 50 micron resolution.
What is metabolic flux analysis and when is it needed?
MFA measures the rate of metabolite flow through metabolic pathways using 13C isotope tracing. It is needed when the research question involves pathway activity regulation rather than metabolite abundance—for example, determining whether a drug inhibits glycolysis at the phosphofructokinase step or whether a metabolic disease shifts carbon flux from glycolysis to glutaminolysis.
How reliable are AI-based metabolite annotation tools?
Current AI annotation tools achieve 70–80% accuracy at the metabolite class level but only 40–50% at the exact isomer level. Orthogonal validation using retention time standards, CCS values, or manual spectral review is recommended before publishing annotations, especially for novel or unexpected metabolite assignments.
What sample preparation steps are critical for reproducible metabolomics data?
The three most critical controls are (1) rapid metabolic quenching to within 2 seconds of sample collection, (2) inclusion of pooled QC samples at every 5–10 injections for batch effect correction, and (3) spiking of stable isotope-labeled internal standards into every sample before extraction. Omitting any of these steps invalidates quantitative comparisons across batches.
References
- Thachil A, Wang L, Mandal R, Wishart D, Blydt-Hansen T. An Overview of Pre-Analytical Factors Impacting Metabolomics Analyses of Blood Samples. Metabolites. 2024;14(9):474. doi:10.3390/metabo14090474
- Demicheva E, Dordiuk V, Polanco Espino F, et al. Advances in Mass Spectrometry-Based Blood Metabolomics Profiling for Non-Cancer Diseases: A Comprehensive Review. Metabolites. 2024;14(1):54. doi:10.3390/metabo14010054
- Bossi E, Limo E, Pagani L, et al. Revolutionizing Blood Collection: Innovations, Applications, and the Potential of Microsampling Technologies for Monitoring Metabolites and Lipids. Metabolites. 2024;14(1):46. doi:10.3390/metabo14010046
- Li S, Looby N, Chandran V, Kulasingam V. Challenges in the Metabolomics-Based Biomarker Validation Pipeline. Metabolites. 2024;14(4):200. doi:10.3390/metabo14040200
- Lopez-Yerena A, Dominguez-Lopez I, Vallverdu-Queralt A, et al. Dried blood spot sample extraction for metabolomics and proteomics. Sci Rep. 2026. doi:10.1038/s41598-026-46874-3