Sodium dodecyl sulfate-polyacrylamide gel electrophoresis (SDS-PAGE) is the most widely used method for separating proteins based on their molecular weight. Originally described by Laemmli in 1970, the technique combines the denaturing power of the anionic detergent SDS with the molecular sieving properties of a crosslinked polyacrylamide gel matrix to resolve complex protein mixtures into discrete bands. Its enduring utility across more than five decades derives from high resolution — separating proteins differing by as little as 1-2 kDa in the optimal mass range of 15-100 kDa — broad applicability to virtually any soluble or solubilized protein, and low cost relative to mass spectrometry-based methods. A 2025 review in the Journal of Food Composition and Analysis documented the continuing evolution of the technique, including critical factors affecting accuracy such as buffer system selection, gel composition, and sample preparation protocols. This guide preserves the existing resource's coverage of SDS-PAGE principles, molecular weight determination, gel reading, and storage, and extends into practical territory: gel casting chemistry and acrylamide percentage selection, electrophoresis buffer system comparison, advanced sample preparation including reduction and alkylation, staining method optimization, systematic troubleshooting, quantitative densitometry, and modern variants including 2D-DIGE and capillary electrophoresis. All methods described are for research use only.
SDS-PAGE analysis services provide protein separation, gel imaging, and band identification by in-gel digestion coupled with LC-MS/MS.
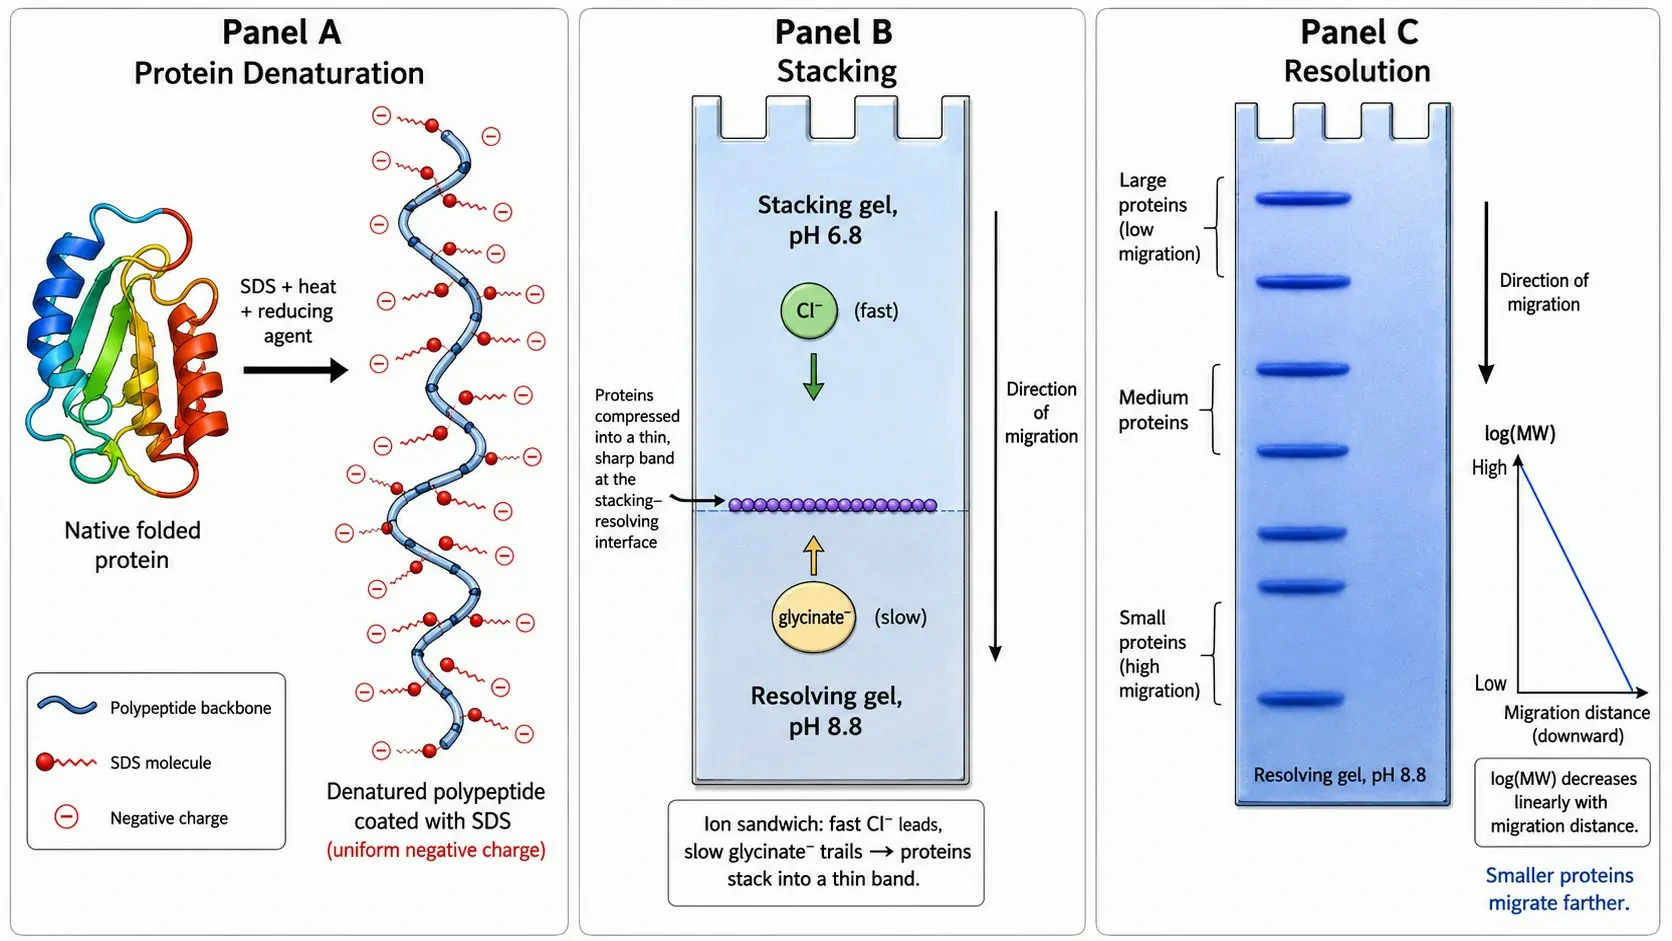 Figure 1: The SDS-PAGE principle — protein denaturation, SDS binding, and electrophoretic separation by molecular weight
The Principle of SDS-PAGE
Electrophoresis is a technique that separates charged molecules by their differential migration in an electric field, widely used to separate proteins, nucleic acids, organic compounds, and inorganic ions. Polyacrylamide gel, formed by the polymerization of acrylamide monomers crosslinked with N,N'-methylenebisacrylamide, serves as the separation matrix. The gel pore size is precisely controlled by two parameters: the total acrylamide concentration (%T, the sum of acrylamide and bisacrylamide as a percentage of the total solution volume) and the crosslinking ratio (%C, the percentage of bisacrylamide in the total monomer). The standard Laemmli gel uses a ratio of 37.5:1 acrylamide:bisacrylamide (%C = 2.6%), which produces pore sizes suitable for separating proteins in the 10-200 kDa range. Higher bisacrylamide ratios produce smaller, more rigid pores; lower ratios produce larger, more flexible pores.
Gel percentage selection is determined by the molecular weight range of the proteins of interest. A 6% gel resolves proteins of 50-300 kDa; 8% resolves 30-200 kDa; 10% resolves 20-150 kDa (the most commonly used percentage); 12% resolves 10-100 kDa; and 15% resolves 5-50 kDa. Gradient gels, where the acrylamide concentration increases from top to bottom (typically 4-20% or 8-16%), separate proteins across a broad molecular weight range — 10-200 kDa in a single gel — and produce sharper bands because the decreasing pore size continuously focuses each protein as it migrates. Pre-cast gradient gels are commercially available and offer better lot-to-lot reproducibility than manually poured gradient gels, which require a gradient maker and careful technique to produce a linear gradient.
The polymerization reaction is initiated by ammonium persulfate (APS), which decomposes in aqueous solution to generate sulfate free radicals. These radicals attack acrylamide monomers, initiating a chain reaction that links acrylamide molecules into linear polymers. TEMED (N,N,N',N'-tetramethylethylenediamine) catalyzes the decomposition of APS, accelerating radical formation. The polymerization is exothermic and is complete within 15-30 minutes at room temperature. Incomplete polymerization leaves residual acrylamide monomer — a neurotoxin — in the gel; adequate polymerization time and complete mixing of APS and TEMED are essential for both safety and gel quality. The gel must be poured between two glass plates separated by spacers of defined thickness: 0.75 mm gels provide the best heat dissipation and sharpest bands but are fragile; 1.0 mm gels are the standard compromise between resolution and durability; 1.5 mm gels accommodate larger sample volumes (up to 50-60 µL per well) but require longer staining and destaining times. Common casting problems include leaking from poorly sealed plate assemblies (prevented by checking the seal with water before pouring the gel) and bubbles trapped in the gel (removed by overlaying the resolving gel solution with water-saturated butanol or isopropanol during polymerization).
How SDS Works: SDS is an anionic detergent that binds to proteins in a defined stoichiometry of approximately 1.4 grams of SDS per gram of protein, or roughly one SDS molecule per two amino acid residues. The hydrophobic dodecyl tail intercalates into the protein's hydrophobic core, while the sulfate head group faces the aqueous solvent. This binding achieves three effects: it disrupts non-covalent interactions — hydrogen bonds, hydrophobic forces, and electrostatic bonds — causing the protein to unfold into an extended, rod-like conformation; it coats the unfolded polypeptide with negatively charged sulfate groups, overwhelming the protein's intrinsic charge and giving all SDS-protein complexes a uniform, mass-proportional negative charge density; and the extended conformation, combined with uniform charge, means electrophoretic mobility depends almost exclusively on molecular weight — the sole variable determining how readily each protein navigates the polyacrylamide gel pores. Disulfide bonds, which are covalent and resist SDS denaturation, are reduced by β-mercaptoethanol (5% v/v) or dithiothreitol (DTT, 50-100 mM). DTT is preferred over β-mercaptoethanol because it has a lower redox potential, a less objectionable odor, and is effective at lower concentrations, though both reagents must be prepared fresh because they oxidize in aqueous solution within 1-2 weeks.
The Stacking and Resolving Gel System: The Laemmli discontinuous buffer system is the defining innovation that gives SDS-PAGE its high resolution. The stacking gel (4-5% acrylamide, 125 mM Tris-HCl, pH 6.8) sits above the resolving gel (7.5-15% acrylamide, 375 mM Tris-HCl, pH 8.8). The running buffer contains 25 mM Tris, 192 mM glycine, and 0.1% SDS, pH 8.3. At pH 6.8 in the stacking gel, glycine exists primarily as the zwitterion with low electrophoretic mobility (pI of glycine = 6.0). Chloride ions from the Tris-HCl buffer have high mobility. SDS-protein complexes have intermediate mobility. As current flows, chloride ions migrate fastest (leading ion), glycinate ions slowest (trailing ion), and the protein-SDS complexes are concentrated into an extremely thin, sharp band at the interface between leading and trailing ions — a process called isotachophoretic stacking. This compresses the entire protein sample, regardless of its initial loading volume, into a band only a few micrometers thick at the stacking-resolving gel boundary, representing a 100-1,000 fold reduction in starting zone width. When the stacked proteins enter the resolving gel at pH 8.8, glycine becomes fully deprotonated, its mobility increases dramatically, the ion sandwich dissolves, and the proteins are released to separate according to molecular weight as they migrate through the size-sieving pores. The migration distance of each protein band, relative to the tracking dye front (bromophenol blue, MW ~670), is inversely proportional to the logarithm of its molecular weight — the foundation of MW determination. 1D SDS-PAGE and IEF services provide standardized gel electrophoresis with molecular weight calibration.
Electrophoresis Buffer Systems Compared
While the Laemmli Tris-glycine-SDS system is the standard for SDS-PAGE, alternative buffer systems offer specific advantages. The Tris-glycine system generates a pH gradient between the stacking (pH 6.8) and resolving (pH 8.8) gels that is essential for the isotachophoretic stacking mechanism. During electrophoresis, the pH of the resolving gel increases to approximately pH 9.5 as the glycine becomes fully deprotonated, and this progressive pH increase contributes to the separation. However, Tris-glycine buffers have limited buffering capacity at the operating pH, and prolonged electrophoresis can cause pH drift that shifts retention times in the later portion of long runs.
Bis-Tris buffer systems use Bis-Tris (bis(2-hydroxyethyl)amino-tris(hydroxymethyl)methane) at pH 6.4-7.2 and operate at neutral pH, which reduces protein modifications during electrophoresis — such as deamidation of asparagine and glutamine residues, which can occur at the alkaline pH of the resolving gel in the Laemmli system. Bis-Tris gels produce sharper bands for some proteins and have a longer shelf life (up to 12 months) because the neutral pH minimizes acrylamide hydrolysis. Tris-acetate buffer systems, operated at pH 7.0-8.5, are designed for the separation of high-molecular-weight proteins (50-500 kDa) and provide better resolution in this range than Tris-glycine gels. The running buffer for SDS-PAGE is typically reused for up to 3-5 runs, but prolonged reuse leads to depletion of the buffering capacity, accumulation of electrolysis products, and pH drift that degrades resolution. The running buffer should be replaced when the pH has drifted by more than 0.3 units or when visible precipitate (from protein elution and buffer component degradation) appears in the buffer tank.
Sample Preparation for SDS-PAGE
The quality of SDS-PAGE results begins with sample preparation. The standard Laemmli sample buffer (2× or 4× concentrated stock) contains 62.5 mM Tris-HCl (pH 6.8), 2% (w/v) SDS, 10% (v/v) glycerol, 5% (v/v) β-mercaptoethanol or 100 mM DTT, and 0.01% (w/v) bromophenol blue. The Tris buffer establishes the correct pH for the stacking mechanism. SDS ensures complete denaturation and uniform charge coating. Glycerol increases sample density so it sinks to the well bottom upon loading. The reducing agent cleaves disulfide bonds. Bromophenol blue provides a visible migration front.
Samples are heated at 95-100°C for 5-10 minutes before loading. This denatures proteins, dissociates non-covalent subunit interactions, and inactivates endogenous proteases — critical because many proteases remain partially active at elevated temperatures even in SDS. For membrane proteins and highly hydrophobic proteins, heating at 70°C for 10 minutes is recommended instead of boiling, because boiling can promote irreversible aggregation of hydrophobic domains exposed after SDS denaturation. Such aggregates fail to enter the gel and produce streaking at the well position. Samples should be centrifuged at 12,000-16,000×g for 1-2 minutes after heating to pellet any insoluble material.
Reduction and Alkylation: For complete and irreversible disulfide bond cleavage, a two-step reduction-alkylation protocol is superior to reduction alone. After reduction with DTT, add iodoacetamide to a final concentration of 50-100 mM and incubate at room temperature in the dark for 30 minutes. Iodoacetamide alkylates the free cysteine sulfhydryl groups, forming stable carbamidomethyl derivatives that cannot re-form disulfide bonds. This is particularly important for proteins with multiple disulfide bonds, such as immunoglobulins and secreted proteins, which can re-oxidize during electrophoresis if not alkylated — producing artifact bands representing partially oxidized intermediates.
Removing Interfering Substances: Nucleic acids in cell lysates increase sample viscosity and produce horizontal streaking. DNA can be sheared by sonication (3-5 pulses of 10 seconds each on ice) or digested with Benzonase nuclease. High salt concentrations (>500 mM) alter protein mobility by compressing the electrical double layer around the SDS-protein complex; samples should be desalted by dialysis, buffer exchange, or TCA precipitation before electrophoresis. Lipids and detergents above their critical micelle concentration compete with SDS for protein binding and produce aberrant migration. TCA precipitation (add TCA to 10-20% final, incubate on ice for 30 minutes, centrifuge, wash pellet with cold acetone) removes salts, detergents, lipids, and nucleic acids while concentrating the protein — but can cause irreversible precipitation of some proteins, particularly low-abundance species.
The amount of protein loaded depends on the detection method. For Coomassie Brilliant Blue: 0.5-5 µg per band. For silver staining: 10-100 ng per band. For SYPRO Ruby fluorescent staining: 1-10 ng per band. Maximum well volume for a 1.0 mm thick, 10-well comb is 20-40 µL. SDS-PAGE sample preparation services include reduction-alkylation and interference removal for challenging sample types.
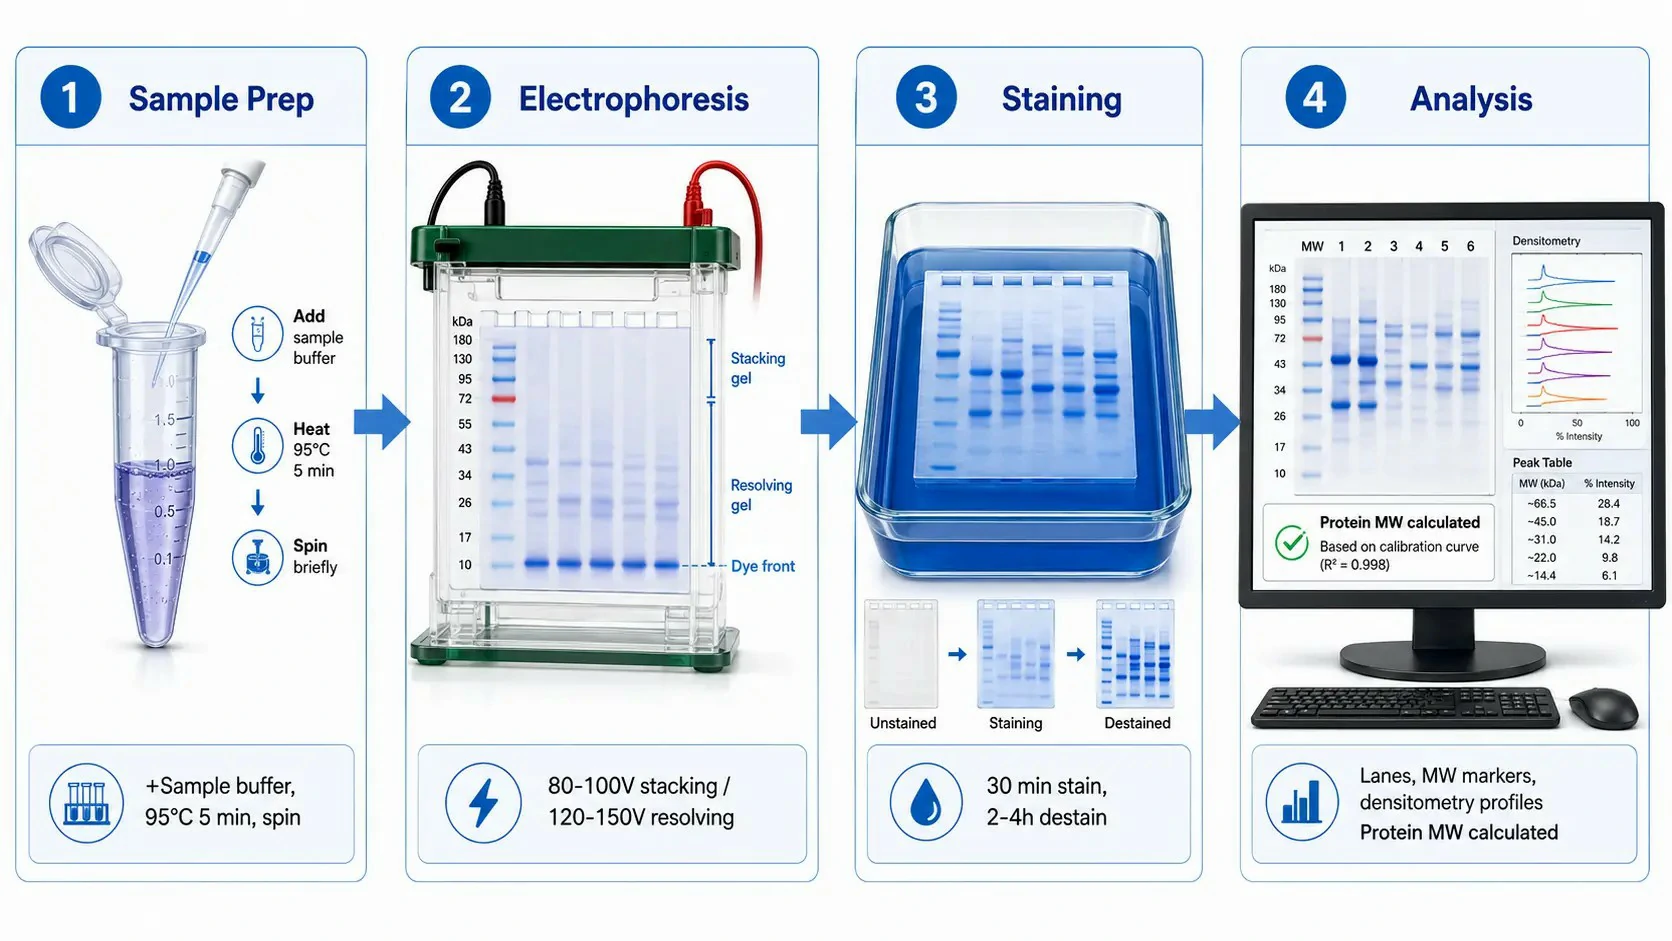 Figure 2: SDS-PAGE workflow — from sample preparation to gel imaging and analysis
How to Determine Molecular Weight of Protein by SDS-PAGE
The molecular weight of an unknown protein is estimated from its migration distance relative to protein standards of known molecular weight. The relationship between log(molecular weight) and relative migration distance (Rf = distance migrated by the protein / distance migrated by the dye front) is approximately linear within the optimal separation range of the gel percentage. Pre-stained molecular weight markers provide a visual reference during electrophoresis and allow real-time monitoring. Unstained markers provide more accurate estimates because the covalently attached dye adds 0.5-2 kDa to the mass and can slightly alter SDS binding and electrophoretic mobility — a shift of 1-3 kDa, which is significant for proteins below 30 kDa.
Typical electrophoresis conditions for a 1.0 mm thick mini-gel (8×10 cm) are 80-100 V through the stacking gel (15-20 minutes) followed by 120-150 V through the resolving gel (45-60 minutes). Running at excessively high voltage generates resistive heating that causes band distortion, non-linear migration, and the characteristic "smiling" effect. Running at too low a voltage allows band broadening by diffusion. The voltage should be adjusted so that the current remains below 30-40 mA per gel to maintain the gel temperature below 30-35°C. For large format gels (16×20 cm), the voltage is scaled proportionally — typically 200-300 V for 4-6 hours — to achieve comparable field strength.
To determine the molecular weight, measure the migration distance of each marker band and the unknown band from the top of the resolving gel. Calculate Rf values. Plot log(MW) versus Rf for the marker proteins and fit a linear regression (typically R²>0.98 for the linear range). The unknown's molecular weight is calculated from its Rf. Accuracy is typically ±5-10%. Proteins that deviate from this relationship — glycoproteins (where the carbohydrate moiety does not bind SDS, reducing the effective charge-to-mass ratio), highly basic proteins such as histones, and highly acidic proteins — may show errors of 20-50%. These deviations themselves provide useful information: an anomalously high apparent molecular weight for a glycoprotein indicates a high carbohydrate content. Protein identification services provide accurate molecular weight by LC-MS/MS when SDS-PAGE estimates require confirmation.
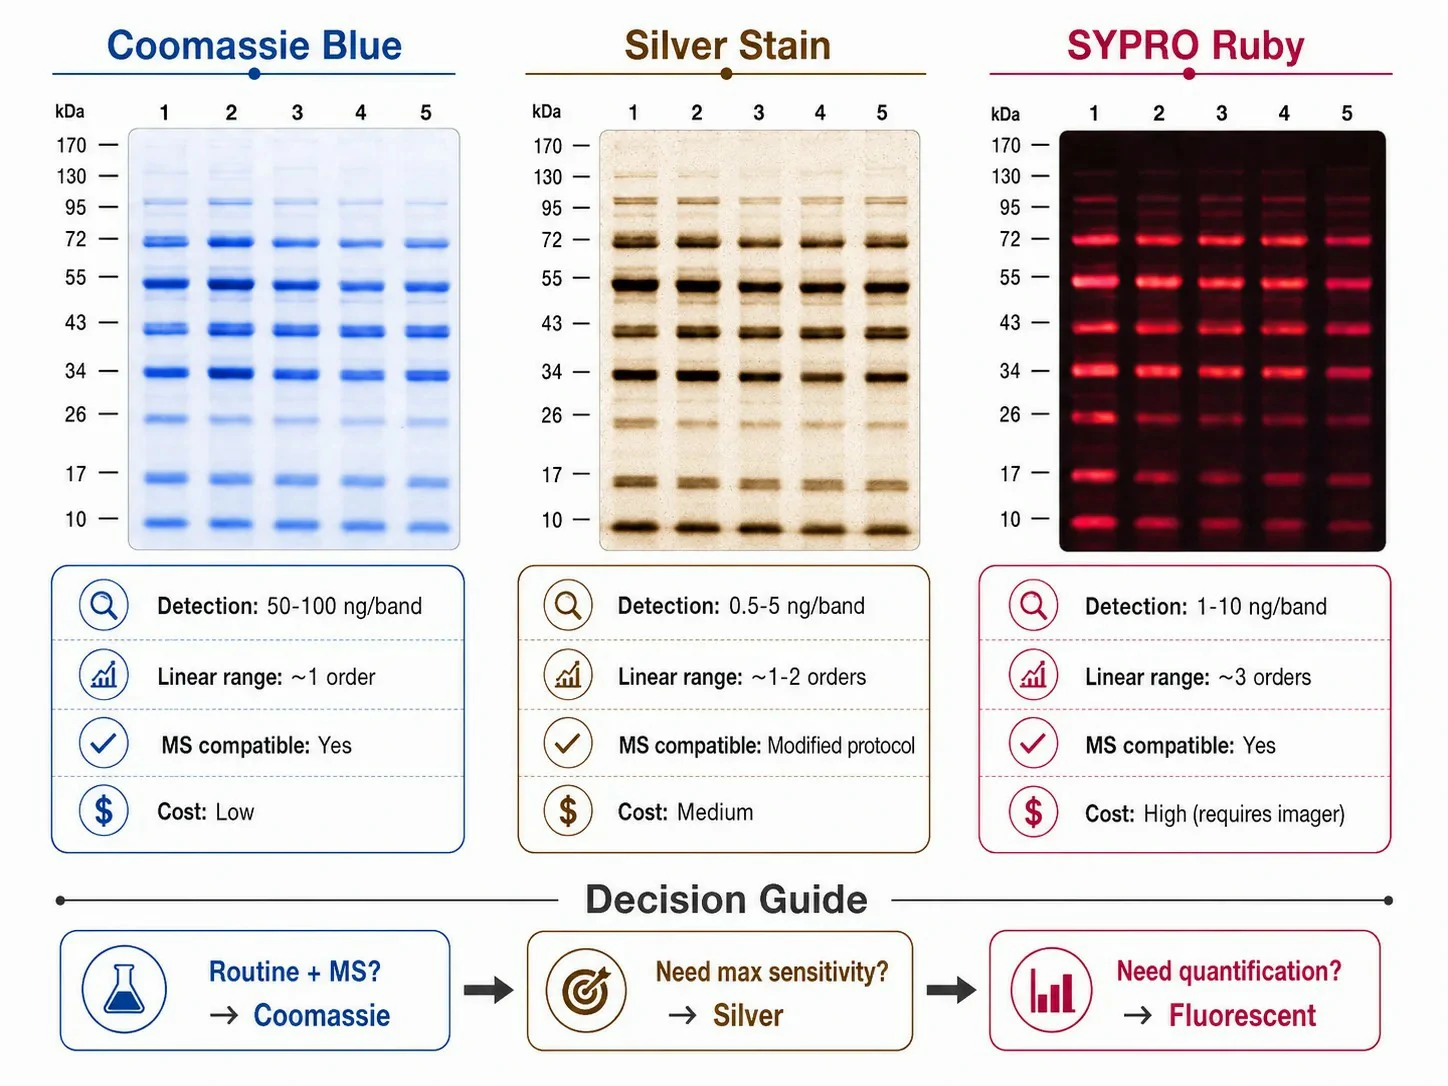 Figure 3: Protein staining methods — Coomassie, silver, and fluorescent comparison
How to Read SDS-PAGE Results
After electrophoresis, proteins must be visualized because polyacrylamide gels and proteins are transparent in visible light. The choice of staining method depends on required sensitivity, downstream application, and available equipment.
Coomassie Brilliant Blue R-250 is used by dissolving 0.1-0.25% dye in 50% methanol and 10% acetic acid. Staining for 30-60 minutes with gentle agitation, followed by destaining in 40% methanol and 10% acetic acid (changed 2-3 times over 2-4 hours), produces blue protein bands on a clear background. The methanol fixes proteins in the gel, preventing diffusion; the acetic acid protonates protein carboxyl groups, enhancing dye binding. The detection limit is 50-100 ng per band. Colloidal Coomassie G-250 forms a colloidal suspension rather than a true solution, producing ~2-fold lower background and a detection limit of 10-20 ng without requiring a separate destaining step — ammonium sulfate in the colloidal formulation drives selective dye binding to proteins. Coomassie is compatible with downstream mass spectrometry after in-gel tryptic digestion, making it the standard for proteomics sample preparation.
Silver staining detects 0.5-5 ng per band through the reduction of silver ions to metallic silver that deposits at protein bands. Ammoniacal silver stains provide the highest sensitivity but use glutaraldehyde fixation, which crosslinks proteins and prevents their extraction for mass spectrometry. Silver nitrate stains compatible with mass spectrometry omit glutaraldehyde (sacrificing some sensitivity to ~5-10 ng) and allow protein identification from excised bands. Silver staining has a narrow linear dynamic range (~1-2 orders of magnitude), making it unsuitable for quantitative comparison of bands with very different intensities.
Fluorescent staining with SYPRO Ruby or Deep Purple provides sensitivity comparable to silver (1-10 ng per band), a wide linear dynamic range (~3 orders), and compatibility with mass spectrometry. It requires a fluorescence imager or laser scanner, increasing equipment cost. The dye binds non-covalently to proteins — SYPRO Ruby through electrostatic and hydrophobic interactions, Deep Purple through a covalent reaction with primary amines — and detection limits depend on the imager sensitivity. For the highest sensitivity, ³⁵S-methionine metabolic labeling or ¹²⁵I protein labeling detects sub-picogram quantities but requires radioisotope facilities.
The staining decision tree: maximum sensitivity without MS → silver (ammoniacal); quantitative dynamic range with MS → fluorescent (SYPRO Ruby); routine detection with lowest cost and MS → Coomassie. Protein identification and quantification services accept gel bands from all three methods for LC-MS/MS analysis.
When reading results, artifacts to recognize: vertical streaking indicates aggregation or incomplete solubilization; horizontal bands across lanes indicate buffer or electrode issues; diffuse bands indicate under-focusing or overload. A single band can contain multiple co-migrating proteins in complex samples. Band intensity is proportional to protein amount, enabling semi-quantitative comparison.
Quantitative Analysis from SDS-PAGE Gels
Densitometry converts the visual band pattern into numerical data. Loading controls — proteins assumed constant across samples — normalize for loading differences. Common controls include β-actin (42 kDa), GAPDH (37 kDa), and tubulin (50 kDa). However, these proteins vary with experimental conditions: GAPDH expression changes under hypoxia, β-actin changes with differentiation state, and tubulin expression varies across cell cycle phases. Total protein normalization using reversible fluorescent dyes that stain all proteins uniformly provides a more robust approach. A 2025 study in the Journal of Food Composition and Analysis identified gel composition, buffer system, and sample preparation as the critical factors affecting SDS-PAGE accuracy and reliability.
Densitometry software measures integrated band intensity (area × average pixel density) after local background subtraction. The normalized intensity of each band is calculated as its integrated intensity divided by the loading control intensity in the same lane, enabling statistical comparison across conditions with at least three biological replicates. The linear dynamic range of the detection method defines the range over which intensity is proportional to protein amount. Bands near detector saturation or near background noise should be excluded. For rigorous quantification, SDS-PAGE densitometry should be validated by orthogonal methods: Western blotting confirms molecular identity, and targeted LC-MS/MS (SRM/MRM) provides absolute quantification. Quantitative proteomics services provide orthogonal validation of SDS-PAGE densitometry by label-free or labeled LC-MS/MS.
Modern SDS-PAGE Variants
2D SDS-PAGE combines isoelectric focusing (first dimension, pI separation) with SDS-PAGE (second dimension, MW separation), resolving 500-2,000 protein spots. It detects post-translational modifications that shift pI — phosphorylation produces characteristic acidic spot trains. 2D-DIGE labels up to three samples with different Cy dyes (Cy2, Cy3, Cy5) of identical mass but distinct fluorescence, running them on a single gel to eliminate gel-to-gel variability. An internal standard (pooled sample, Cy2-labeled) normalizes inter-gel comparisons with CV below 20%. 2D electrophoresis services provide high-resolution protein separation.
Capillary electrophoresis-SDS (CE-SDS) replaces the slab gel with a fused silica capillary containing sieving polymer. It provides automated quantitative analysis with higher resolution than slab gels, requiring nanogram sample quantities, and is the standard for biopharmaceutical monoclonal antibody purity and size heterogeneity analysis. SDS-PAGE protein identification services support both gel-based and capillary electrophoresis formats.
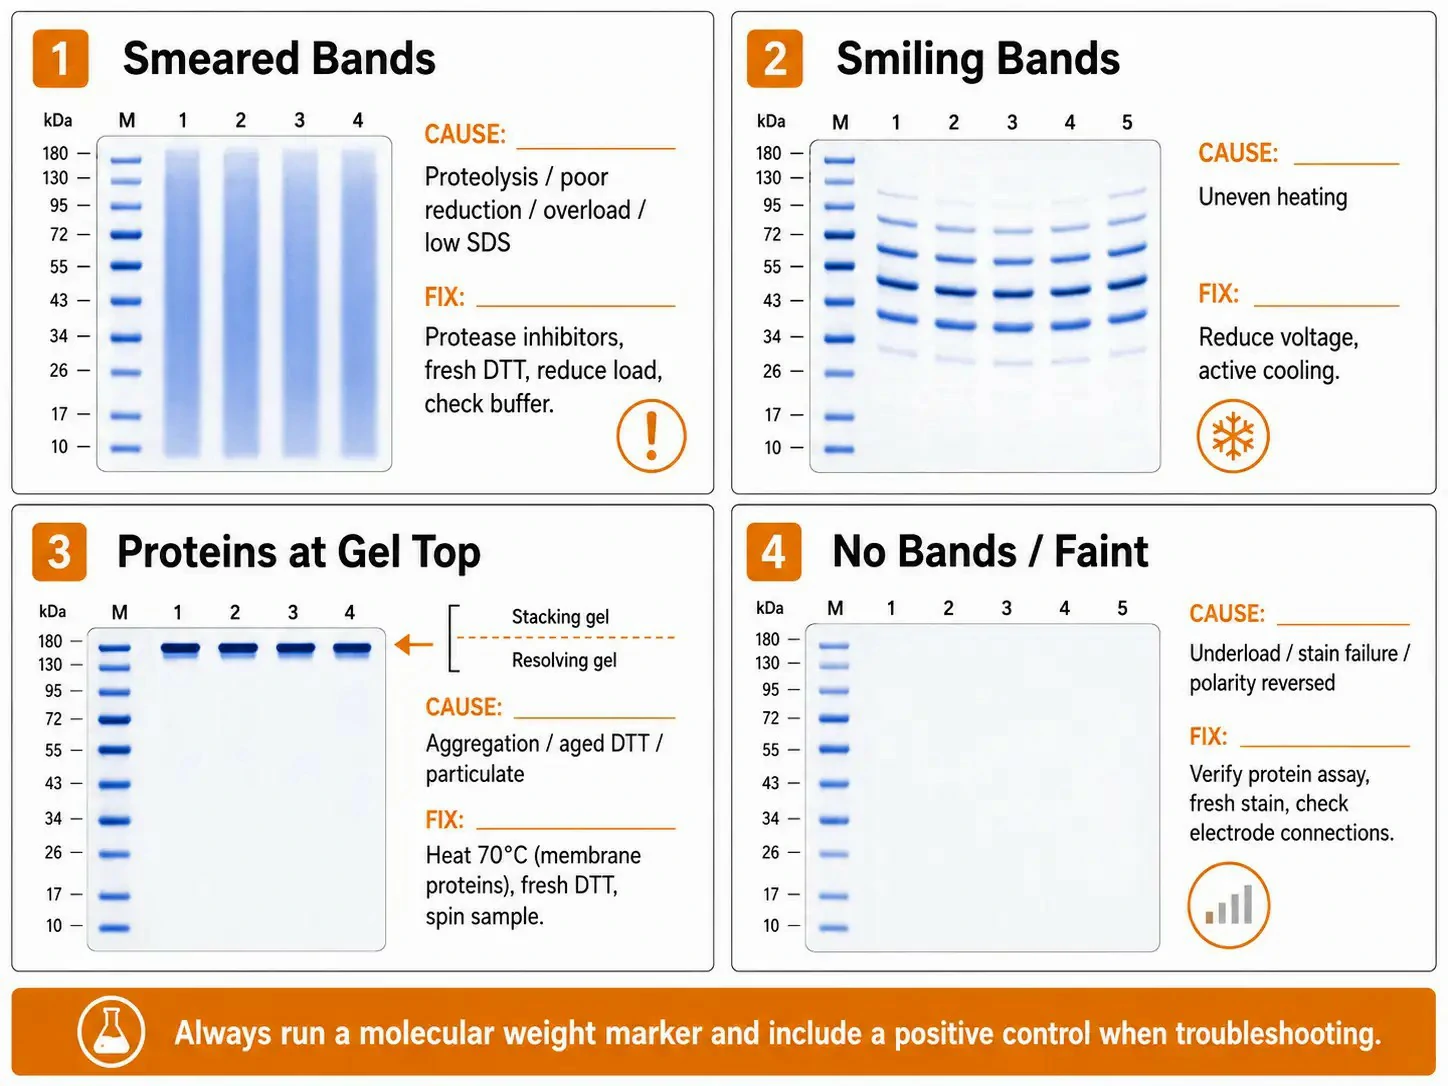 Figure 4: SDS-PAGE troubleshooting guide — common problems and diagnostic solutions
SDS-PAGE Troubleshooting
Smeared bands: Proteolytic degradation produces a continuous smear below the expected band — add protease inhibitors (PMSF, leupeptin, pepstatin) and heat rapidly. Incomplete reduction with aged DTT leaves disulfide oligomers — use fresh DTT (<2 weeks old). Overloading causes band broadening — reduce loading. Insufficient SDS causes incomplete denaturation — verify 2% SDS in the buffer.
"Smiling" bands (curved): Uneven heating causes the gel center to run hotter with lower resistance and higher current. Reduce voltage (from 200 V to 120-150 V), run in a cold room at 4°C, or circulate pre-chilled buffer. Placing an aluminum plate behind the gel cassette improves heat dissipation. A 3-4°C temperature difference between the gel center and edges is sufficient to cause visible smiling.
Proteins at gel top: Membrane proteins boiled at 100°C aggregate irreversibly — heat at 70°C instead. Aged reducing agent leaves disulfide-linked aggregates. Particulates not removed by centrifugation clog wells. Recombinant protein overexpression (30-50% of total protein) saturates gel pores — reduce loading or use a partially purified fraction.
No or faint bands: If markers are visible but samples are empty, the protein assay overestimated concentration — Bradford and BCA assays can overestimate in the presence of detergents, reducing agents, or nucleic acids. If markers and samples are both faint, the staining or destaining failed — Coomassie stain reused too many times loses capacity. If the dye front is absent, check electrode polarity (proteins migrate toward the anode).
Double bands and ghost bands: Doublets can result from incomplete reduction, phosphorylation isoforms, or proteolytic clipping. Ghost bands in blank lanes are usually keratin contamination from skin flakes or dust — wear gloves, use filtered buffers, and work in a clean environment. Keratin contamination is particularly problematic for mass spectrometry because abundant keratin peptides suppress low-abundance protein signals. SDS-PAGE troubleshooting services address difficult samples producing faint, smeared, or otherwise problematic results.
Irreproducible band patterns between gels: If the same sample produces different band patterns on different gels, the most common causes are inconsistent sample preparation (variable heating time or temperature, aged reducing agent), inconsistent gel casting (variation in acrylamide percentage or polymerization time), or running buffer degradation. Standardizing all steps — using aliquoted sample buffer, verifying gel percentages with a refractometer, replacing running buffer after 3-5 uses — improves reproducibility. For critical quantitative comparisons, running all samples to be compared on the same gel eliminates inter-gel variability entirely. If lane-to-lane differences within the same gel are the problem, check that the gel was level during polymerization (an uneven resolving gel surface distorts band migration) and that the electrode assembly is clean (salt deposits on electrodes cause uneven current distribution).
Uneven staining or high background: If the Coomassie gel has dark patches or uneven background, the destaining solution was not agitately sufficiently or was saturated with dye. Changing the destaining solution more frequently (every 30-60 minutes) and adding a Kimwipe or piece of foam to absorb leached dye from the solution accelerates destaining. Silver staining background often results from over-development — the development time should be monitored continuously and stopped when the desired band intensity is reached by immersing the gel in stop solution (5% acetic acid). Fluorescent staining background results from incomplete destaining — SYPRO Ruby requires a 30-minute destain in 10% methanol, 7% acetic acid after staining.
How to Store SDS-PAGE Gel
Short-term storage: wrap gels in plastic wrap or seal in a bag with 5% glycerol at 4°C. Coomassie-stained gels remain intact ~1 week (color fades). Silver-stained gels, with metallic silver deposits, retain patterns for months. Fluorescent-stained gels photobleach within days — capture a high-resolution digital image immediately.
Long-term archival: vacuum-dry gels onto filter paper after soaking in 10% glycerol and 5% methanol to prevent cracking. Dried gels are stable for years. Alternatively, store in 5% acetic acid at room temperature indefinitely. For mass spectrometry, excise bands immediately after imaging and store in 1% acetic acid at 4°C or process directly for digestion within 24-48 hours. Protein identification from gel bands is most reliable when gels are processed promptly and stored under conditions that minimize protein degradation and keratin contamination.
FAQ
What is the role of SDS in SDS-PAGE?
SDS unfolds proteins and coats them with a uniform negative charge proportional to length (1.4 g SDS/g protein), eliminating the influence of native shape and charge so proteins separate solely by molecular weight. Without SDS, proteins would migrate according to their native charge, shape, and size — producing unpredictable band patterns.
Why does SDS-PAGE use stacking and resolving gels?
The stacking gel (pH 6.8) concentrates proteins into a sharp band through isotachophoresis between fast Cl⁻ and slow glycinate ions. The resolving gel (pH 8.8) separates the concentrated proteins by size.
What gel percentage should I use for my proteins?
6%: 50-300 kDa; 8%: 30-200 kDa; 10%: 20-150 kDa; 12%: 10-100 kDa; 15%: 5-50 kDa. Gradient gels (4-20%) cover 10-200 kDa in a single gel.
How accurate is MW determination by SDS-PAGE?
±5-10% for most proteins. Glycoproteins, highly basic/acidic proteins, and phosphorylated proteins may deviate 20-50% because their SDS binding stoichiometry differs from the standard ratio.
Which stain should I use?
Coomassie: routine (>50 ng), MS compatible, cheapest. Silver: max sensitivity (0.5-5 ng) when MS not required. Fluorescent: wide dynamic range for quantification (1-10 ng, 3-log linear) with imager.
How should I prepare membrane proteins?
Heat at 70°C for 10 min, not 100°C — boiling causes aggregation. Use fresh DTT (50-100 mM). Add 6 M urea for particularly hydrophobic proteins.
How do I reduce-alkylate for irreversible disulfide cleavage?
Reduce with DTT (100 mM, 95°C, 5 min), then add iodoacetamide (50-100 mM, 30 min, room temperature, dark). Essential for proteins with multiple disulfide bonds.
References
- Deciphering food proteins: SDS-PAGE applications, critical factors, and advances. Journal of Food Composition and Analysis. 2025;139:106825.
- Optimizing SDS-PAGE for accurate protein characterization and detection sensitivity. International Journal of Innovative Science and Research Technology. 2025;10:1385.
- SDS-PAGE analysis of proteins: Principles, methodology, and applications. Deep Science Research. 2023.
- A protocol for recombinant protein quantification by SDS-PAGE densitometry. MicrobiologyOpen. 2020;9:e1027.
- Improved separation in horizontal protein SDS-PAGE with optimized buffer systems. Methods and Protocols. 2023;6:106.


