- Service Details
- Demo
- Case Study
- FAQ
- Publications
What is SAM and SAH?
It is now well established that deficiencies of the major dietary sources of methyl donors, methionine and choline, lead to the formation of liver cancer in rodents. Although not so widely studied as the liver tumors, extrahepatic tumor formation has also been increased in carcinogen-treated animals fed diets low in the methyl donors methionine, choline, and folic acid. Several plausible mechanisms have been proposed to explain the enhancing effects of dietary methyl deprivation on carcinogenesis. The most widely investigated, however, has been the idea that dietary methyl insufficiency results in abnormal DNA methylation subsequent to the formation of a physiological methyl insufficiency in vivo. A critical metabolite in the investigation of this hypothesis is SAM, the body's chief physiological methyl donor.
S-adenosylmethionine (SAM) is a methyl donor involved in the transfer of a methyl group to DNA, proteins, phospholipids, RNA, and neurotransmitters. Reactions that break down and regenerate SAM have been named the SAM cycle. SAM-dependent methylases use SAM as a substrate to yield s-adenosylhomocysteine (SAH), which is further broken down to homocysteine and adenosine by s-adenosylhomocysteine hydrolase. The homocysteine can be regenerated to methionine and finally SAM by methionine synthases.
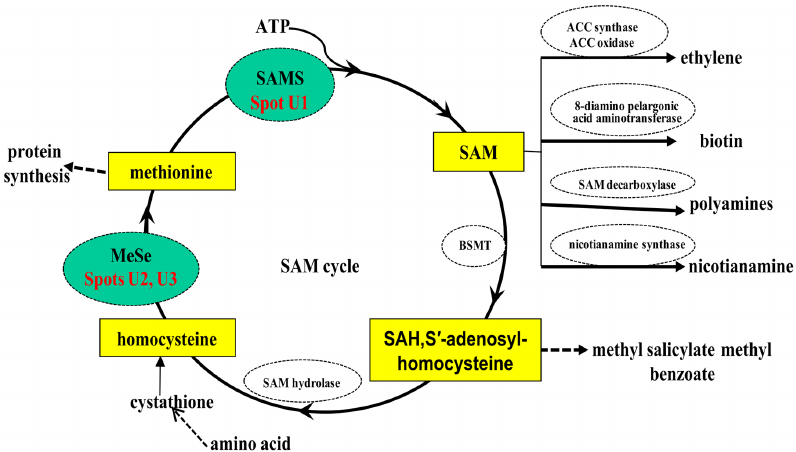
Donation of the SAM methyl group converts SAM into SAH, the latter being a potent inhibitor of methylation. For this reason, the SAM/SAH ratio has been used as an index of methylation potential in a cell. SAH in plasma has been found to be a more sensitive indicator for vascular disease risk than homocysteine. In addition, distinct classes of riboswitches that recognize SAH but not SAH and regulate gene expression have been discovered.
During the past decade, animal models of several disorders of homocysteine metabolism became available for studying the pathogenesis of the respective enzyme deficiencies. In contrast to human patients the animal models offer a unique opportunity to determine concentration of relevant metabolites including SAM and SAH also in tissues, which may help further elucidating the pathogenetic mechanisms in homocystinurias. The aim of this study was to develop an assay to monitor the levels of SAM and SAH in animal tissue samples and to explore the preanalytical conditions for this assay.
Currently, a reliable and reproducible method using highly sensitive HPLC-MS platform for the rapid identification and quantification of SAM and SAH in different sample types has been established by the experienced scientists at Creative Proteomics, which can satisfy the needs of academic and industrial study in your lab.
SAM and SAH Analysis in Creative Proteomics
Quantitative Analysis of SAM and SAH
Our quantitative analysis services provide accurate metabolite measurements of SAM and SAH concentrations in various biological samples.
Ratio Analysis of SAM to SAH
The SAM/SAH ratio is a critical indicator of cellular methylation potential. Our ratio analysis service provides detailed insights into the methylation status of your samples, helping to elucidate regulatory mechanisms in various biological contexts.
Metabolomic Profiling
This service offers a comprehensive analysis of related metabolites in the methylation pathway. Using advanced LC-MS technology, we provide a broad view of the metabolic state of your samples, including:
- Methionine Cycle Intermediates: Quantification of methionine, homocysteine, and cysteine.
- Transmethylation Pathway Metabolites: Analysis of methylation-related metabolites such as dimethylglycine and betaine.
Customized Analysis
We understand that each research project is unique. Therefore, we offer customized SAM and SAH analysis services tailored to your specific needs. Our team works closely with you to design and implement assays that address your research questions.
Analytical Techniques for SAM and SAH Analysis
High-Performance Liquid Chromatography (HPLC)
HPLC is a robust technique used in our SAM and SAH analysis services. It allows for the separation and quantification of these molecules with high precision. By employing specific columns and optimized mobile phases, HPLC ensures accurate detection and measurement, making it a cornerstone of our analytical process.
- Agilent 1260 Infinity II HPLC System: Known for its reliability and performance, this system is equipped with a binary pump, an autosampler, and a UV detector. The precise control of solvent gradients ensures optimal separation of SAM and SAH.
- Waters Alliance HPLC System: This system features a quaternary solvent manager and a photodiode array detector, providing high sensitivity and resolution for complex sample matrices.
Liquid Chromatography-Mass Spectrometry (LC-MS)
LC-MS combines the separation capabilities of liquid chromatography with the detection power of mass spectrometry. This technique provides high sensitivity and specificity, allowing for the detection of SAM and SAH even in complex biological matrices. Our LC-MS setup is fine-tuned to deliver reliable quantification and detailed molecular insights.
- Thermo Fisher Scientific Q Exactive Orbitrap LC-MS/MS System: This high-resolution system offers exceptional mass accuracy and sensitivity, ideal for detecting low-abundance metabolites in complex samples.
- Agilent 6545XT AdvanceBio LC/Q-TOF: Provides accurate mass measurements and high resolution, making it suitable for detailed metabolite profiling and quantitative analysis.
Enzyme-Linked Immunosorbent Assay (ELISA)
For researchers seeking a more accessible method, we offer ELISA-based analysis of SAM and SAH. This technique leverages specific antibodies to detect and quantify these molecules. ELISA is a cost-effective and straightforward approach, suitable for high-throughput screening and preliminary studies.
- BioTek Synergy HTX Multi-Mode Reader: This versatile plate reader supports absorbance, fluorescence, and luminescence detection modes, making it ideal for a wide range of ELISA applications.
- Thermo Fisher Scientific Multiskan FC Microplate Photometer: Known for its reliability and accuracy, this microplate reader provides consistent and reproducible results for ELISA assays.
Sample Requirements for SAM and SAH Analysis
| Sample Type | Minimum Volume | Notes |
|---|---|---|
| Plasma/Serum | 200 µL | Collected in EDTA or heparin tubes |
| Tissue | 50 mg | Snap-frozen and stored at -80°C |
| Cell Culture Supernatant | 1 mL | Collected at the desired time point |
| Urine | 1 mL | First morning void preferred |
| Cerebrospinal Fluid | 200 µL | Stored at -80°C immediately after collection |
Notes:
Sample Collection: Ensure samples are collected and processed promptly to prevent degradation.
Storage: Store samples at -80°C to maintain stability. Avoid repeated freeze-thaw cycles.
Shipment: Ship samples on dry ice to ensure they remain frozen during transit.
Documentation: Include detailed sample information, including collection time, storage conditions, and any treatments or conditions applied.
Report
- A detailed technical report will be provided at the end of the whole project, including the experiment procedure, instrument parameters.
- Analytes are reported as uM or ug/mg (tissue), and CV's are generally<10%.
- The name of the analytes, abbreviation, formula, molecular weight and CAS# would also be included in the report.

PCA chart

PLS-DA point cloud diagram

Plot of multiplicative change volcanoes

Metabolite variation box plot

Pearson correlation heat map
Analysis of S-Adenosylmethionine and S-Adenosylhomocysteine: Method Optimisation and Profiling in Healthy Adults upon Short-Term Dietary Intervention
Journal: Metabolites
Published: 2022
Background
This study focuses on optimizing the quantification of S-adenosylmethionine (SAM) and S-adenosylhomocysteine (SAH) in biological samples. It establishes reference ranges for healthy adults, validates the assay against existing LC-MS/MS methods, and investigates the impact of diet on plasma and urine concentrations of these metabolites. SAM and SAH play crucial roles in methylation processes and their concentrations are indicative of various health conditions.
Materials & Methods
1. Specimen Collection, Pre-Analytics, and Storage
- Plasma Collection: EDTA-blood samples were collected and immediately processed. Plasma was separated by centrifugation and stored at −80°C until analysis.
- Urine Collection: Spot urine samples were collected and stored at −80°C without acidification.
- Cell Lysate Preparation: Human renal epithelial cells were lysed using ice-cold PBS with protease inhibitors and stored following established protocols.
2. Targeted Metabolomics Analysis
Sample Preparation and Extraction
- Stock Solutions: SAM and SAH stock solutions were prepared in water and stored at −80°C.
- Internal Standard Solution: Isotopically labeled SAM and SAH were used as internal standards.
- Extraction Solution: 0.1% formic acid in methanol was used for extraction.
Calibration Curves
- Preparation: Calibration curves were prepared by serial dilution of SAM and SAH standards in matrix-matched solutions.
- Quality Controls: In-house quality control samples were prepared at low, medium, and high concentrations.
- Chromatographic Separation: Analytes were separated on a C8 column using an isocratic elution with 0.1% formic acid in water and methanol.
- Mass Spectrometry: Detection and quantification were performed using triple quadrupole mass spectrometry in positive ion mode.
- Data Analysis: Quantification was performed using Analyst® software, with calibration curves used for quantification.
4. Validation of the Method
- Linearity and Sensitivity: Calibration curves showed good linearity over the concentration range of 0.010-5 µM for SAM and 0.003-5 µM for SAH.
- Precision and Accuracy: Intra-day and inter-day precision and accuracy were evaluated using quality control samples.
Results
1. Linearity Range and Limit of Quantification
The assay demonstrated a linear calibration curve for SAM and SAH from 0 to 1 µM, extendable to 10 µM. The limits of detection were 5 nM for SAM and 1 nM for SAH, with limits of quantification at 10 nM and 3 nM, respectively.
 Overview of sample preparation, chromatographic separation, and the linearity of SAM and SAH calibration curves.
2. Recovery, Carry Over, and Analysis of Matrix Effect
The recovery of SAM and SAH from plasma was about 50%, which is lower than other methods due to the exclusion of solid-phase extraction. Carry over was minimal, and matrix effects were significant in plasma and urine.
The recovery rates of SAM and SAH from plasma were approximately 50%, which is lower compared to other methods using solid-phase extraction. No significant carry over was observed. Notable matrix effects were identified in plasma, urine, cell lysates, and culture medium. These effects necessitate the use of isotopic dilution for accurate quantification.
3. Determination of SAM and SAH in the Plasma of Healthy Adults
The concentrations of SAM and SAH were measured in plasma samples from 33 healthy adults, showing values of 120.6 ± 18.1 nM for SAM and 21.5 ± 3.2 nM for SAH, which are consistent with reference values reported in other studies.
4. Determination of SAM and SAH in the Plasma of Patients with Inborn Errors of Metabolism
SAM and SAH concentrations in plasma from patients with inborn errors of metabolism were measured and compared with another method. Bland–Altman plots showed agreement between the two methods.
 Correlation and Bland–Altman plots of SAM and SAH determinations in plasma by the new method versus an existing diagnostic method.
5. Profile of SAM and SAH in a Randomised Control Trial in Healthy Subjects with Dietary Intervention
At baseline, healthy omnivores exhibited plasma concentrations of SAM, SAH, and creatinine within reference ranges.
Plasma and urinary concentrations of SAM and SAH were measured before and after a 4-week dietary intervention with vegan (VD) and meat-rich (MD) diets. No significant dietary impact was observed on these metabolite levels.
 Plasma concentrations of SAM, SAH, the SAM:SAH ratio (SAM/SAH), and creatinine in an RCT with a 4 week intervention with vegan (VD) and meat-rich (MD) diets.
 Urinary concentration of SAM, SAH, and the SAM:SAH ratio (SAM/SAH) in an RCT with a 4 week intervention with vegan (VD) and meat-rich (MD) diets.
 Multiple linear regression analysis of systemic (plasma) and excreted (urinary) SAM and SAH and their SAM:SAH ratios.
Reference
- Bravo, Aida Corrillero, et al. "Analysis of S-adenosylmethionine and S-adenosylhomocysteine: method optimisation and profiling in healthy adults upon short-term dietary intervention." Metabolites 12.5 (2022): 373.
What is the difference between SAM and SAH?
Answer: S-adenosylmethionine (SAM) and S-adenosylhomocysteine (SAH) are key molecules in cellular methylation processes. SAM is a universal methyl donor, transferring its methyl group to various substrates, including DNA, proteins, and lipids. This methylation is crucial for numerous biological processes, such as gene regulation, signal transduction, and protein function. After donating its methyl group, SAM is converted into SAH.
SAH is subsequently hydrolyzed to homocysteine and adenosine by the enzyme SAH hydrolase. Elevated levels of SAH can inhibit methylation reactions by competing with SAM, thus maintaining a balance between methylation and demethylation activities in cells. Therefore, the ratio of SAM to SAH is an important indicator of the cellular methylation capacity.
What is the SAM SAH ratio?
The SAM ratio is a critical indicator of the methylation potential within a cell. This ratio reflects the balance between methylation and demethylation activities. A high SAM ratio suggests a high methylation potential, as there is more SAM available relative to SAH. Conversely, a low SAM ratio indicates a reduced methylation capacity, which can result from elevated SAH levels that inhibit methyltransferase enzymes.
This ratio is significant because it influences various biological processes, including gene expression, DNA repair, and epigenetic modifications. Abnormal SAM ratios are associated with several diseases, such as cardiovascular diseases, neurodegenerative disorders, and cancer. Therefore, monitoring the SAM ratio is essential in both clinical diagnostics and research settings to assess methylation status and its implications for health and disease.
What sample types can be used for SAM and SAH analysis?
- Plasma/Serum: These are commonly used for clinical and research purposes due to the ease of collection and the ability to reflect systemic levels of metabolites.
- Urine: Urinary analysis can provide information on the excretion and metabolism of SAM and SAH, offering insights into renal function and systemic methylation status.
- Cell Lysates: Analysis of SAM and SAH in cultured cells helps in understanding intracellular methylation dynamics and the impact of various treatments or genetic modifications.
- Tissues: Tissue samples from biopsies can be analyzed to study the local methylation status in specific organs or pathological conditions.
- Cerebrospinal Fluid (CSF): CSF analysis is particularly relevant for studying neurological conditions and brain metabolism.
How do matrix effects influence SAM and SAH analysis?
Matrix effects refer to the influence of other components in a sample that can affect the accuracy and reliability of SAM and SAH measurements. These effects can manifest as suppression or enhancement of the analyte signal in mass spectrometry, leading to inaccurate quantification.
Matrix effects can be influenced by several factors, including:
- Sample Complexity: Biological samples such as plasma, urine, and tissues contain a wide variety of compounds that can co-elute with SAM and SAH, interfering with their detection and quantification.
- Ion Suppression/Enhancement: Co-eluting compounds can compete for ionization in the mass spectrometer, resulting in suppressed or enhanced signals for SAM and SAH.
- Extraction Efficiency: Variations in the efficiency of sample preparation and extraction methods can lead to inconsistent recoveries of SAM and SAH, affecting measurement accuracy.
To mitigate matrix effects, several strategies can be employed:
- Sample Clean-up: Techniques such as solid-phase extraction (SPE) can remove interfering substances from the sample, reducing matrix effects.
- Matrix-Matched Calibration: Using calibration standards prepared in a matrix similar to the sample can help account for matrix effects and improve quantification accuracy.
- Internal Standards: Isotopically labeled internal standards can compensate for matrix effects by undergoing the same sample preparation and analysis processes as the target analytes, providing a reference for accurate quantification.
What is the recovery rate of SAM and SAH in different sample types?
The recovery rate of SAM and SAH refers to the efficiency with which these analytes can be extracted and quantified from different sample types. Recovery rates can vary depending on the sample matrix and the extraction method used. Typical recovery rates for SAM and SAH are as follows:
- Plasma/Serum: Recovery rates for SAM and SAH from plasma or serum samples are generally high, often exceeding 80-90%. The use of protein precipitation or solid-phase extraction methods can enhance recovery and purity of the analytes.
- Urine: Urinary samples tend to have variable recovery rates, ranging from 70-90%, due to differences in urine composition and concentration. Dilution and appropriate clean-up steps are necessary to achieve consistent recovery.
- Cell Lysates: Recovery from cell lysates can be challenging due to the presence of cellular debris and other metabolites. Optimization of lysis and extraction protocols is crucial to achieve recovery rates of 75-85%.
- Tissues: Tissue samples typically have recovery rates of 60-80%, influenced by the complexity of the tissue matrix and the efficiency of homogenization and extraction procedures.
- Cerebrospinal Fluid (CSF): CSF samples generally have high recovery rates (85-95%) due to the relatively low complexity of the matrix compared to other biological fluids.
Inflammation primes the kidney for recovery by activating AZIN1 A-to-I editing
Heruye, Segewkal, et al.
Journal: bioRxiv
Year: 2023
doi: 10.1101/2023.11.09.566426
NUDT22 promotes cancer growth through pyrimidine salvage and the TCA cycle
Melanie Walter, Florian Mayr, Bishoy Magdy Fekry Hanna, et al
Journal: Research Square
Year: 2022
https://doi.org/10.21203/rs.3.rs-1491465/v1
Metabolites and Genes behind Cardiac Metabolic Remodeling in Mice with Type 1 Diabetes Mellitus
Kambis, T. N., Shahshahan, H. R., et al.
Journal: International journal of molecular sciences
Year: 2022
https://doi.org/10.3390/ijms23031392
Quantification of choline in serum and plasma using a clinical nuclear magnetic resonance analyzer
Erwin Garcia, lrina Shalaurova, et al
Journal: Clinica Chimica Acta
Journal: 2022
https://doi.org/10.1016/j.cca.2021.11.031