Pipecolic Acid Analysis Service
Creative Proteomics offers precise, matrix-adaptable analysis of pipecolic acid and its metabolic network. Our high-resolution methods reveal subtle shifts in lysine catabolism, plant stress signaling, and microbial metabolism.
What Sets Us Apart:
- Ultra-trace detection (LOD ≤ 0.05 ng/mL)
- Broad metabolite coverage in one run
- Tailored workflows for complex sample types
- Publication-ready data with pathway mapping
Accelerate data clarity, pathway insight, and analytical confidence—on your terms
Submit Your Request Now
×
What You Will Receive
- Quantitative Data: Absolute concentrations of pipecolic acid and related metabolites
- Full Data Report: Raw & processed data, statistical outputs, and annotated tables
- Pathway Visualization: Custom charts mapping pipecolic acid to lysine degradation & SAR pathways
- Custom Panel Integration: Optional inclusion with amino acid or microbial metabolite panels
- What We Provide
- Advantages
- Technology Platform
- Sample Requirements
- Demo
- FAQs
- Case Study
What Is Pipecolic Acid?
Pipecolic acid (piperidine-2-carboxylic acid) is a non-proteinogenic cyclic amino acid derived from lysine catabolism. As a critical metabolic intermediate in both plants and mammals, pipecolic acid plays key roles in stress responses, immune signaling, and neurodevelopment. In plants, it functions as a long-distance signaling molecule in systemic acquired resistance (SAR), while in humans, altered pipecolic acid levels are implicated in peroxisomal disorders, epilepsy, and immune dysregulation.
Due to its involvement in diverse biological pathways and its diagnostic potential, accurate quantification of pipecolic acid and its related metabolites is essential for translational research, metabolic pathway elucidation, and biomarker discovery.
Why Analyze Pipecolic Acid?
Quantitative analysis of pipecolic acid provides critical insight into:
- Lysine metabolism in plants, microbes, and mammals
- Plant immunity, especially SAR-related signaling
- Peroxisomal function, particularly in genetic metabolic disorders such as hyperpipecolatemia
- Neurodevelopmental abnormalities associated with pipecolic acid accumulation
- Metabolite profiling in precision agriculture, microbiome studies, and clinical diagnostics
At Creative Proteomics, our pipecolic acid analysis service delivers targeted, high-sensitivity quantification and comprehensive metabolic context for both biological and environmental samples.
Pipecolic Acid Analysis Service Offered by Creative Proteomics
Quantitative Pipecolic Acid Profiling: High-sensitivity measurement of pipecolic acid levels across diverse biological matrices using LC-MS/MS with isotope-labeled internal standards.
Metabolic Pathway Mapping: Detection of pipecolic acid and its upstream/downstream intermediates within the lysine degradation pathway for metabolic flux evaluation.
N-Hydroxypipecolic Acid (NHP) Co-Analysis: Simultaneous quantification of NHP, a key signaling metabolite in systemic acquired resistance (SAR) pathways in plants.
Customized Multi-Metabolite Panels: Tailored analysis panels that include pipecolic acid alongside related amino acids and organic acids relevant to microbial or plant metabolism.
Matrix-Specific Method Development: Protocol optimization for complex samples such as leaf extracts, fermentation broths, and microbial cultures to ensure matrix compatibility and analytical accuracy.
Isomer Resolution and Identification: Advanced chromatographic methods for separating structural isomers and confirming molecular identity via MS/MS fragmentation patterns.
Batch-to-Batch Comparison and Statistical Analysis: Designed for research workflows requiring comparative quantification across treatment groups or time points, with optional PCA and heatmap outputs.
List of Detected Pipecolic Acid and Related Metabolites
| Metabolite | Pathway / Function | Detection Range | LOD (ng/mL) |
|---|---|---|---|
| Pipecolic Acid | Lysine Catabolism Intermediate | 0.1–2,000 ng/mL | 0.05 |
| Δ¹-Piperideine-6-carboxylate | Cyclization Intermediate | 0.2–1,500 ng/mL | 0.08 |
| α-Aminoadipic Acid | Lysine Catabolite | 0.5–1,000 ng/mL | 0.10 |
| Saccharopine | Early Lysine Condensation Product | 0.2–1,200 ng/mL | 0.07 |
| Piperideine Carboxylic Acid | Oxidative Intermediate | 0.3–1,800 ng/mL | 0.09 |
| L-Lysine | Metabolic Precursor Amino Acid | 1–5,000 ng/mL | 0.15 |
| Pipecolic Acid Lactam | Cyclic Lactam form of Pipecolic Acid | 0.1–1,000 ng/mL | 0.06 |
| L-Pipecolate | Reduced form involved in alternative pathways | 0.2–1,200 ng/mL | 0.07 |
| 2-Aminoadipic Semialdehyde | Intermediate in Lysine Degradation | 0.3–1,000 ng/mL | 0.08 |
| Glutarate | Downstream Lysine Degradation Product | 0.5–1,200 ng/mL | 0.10 |
| α-Ketoadipate | Final intermediate before entry into TCA cycle | 0.2–1,000 ng/mL | 0.09 |
| Metabolite | Pathway / Function | Detection Range | LOD (ng/mL) |
| Pipecolic Acid | Lysine Catabolism Intermediate | 0.1–2,000 ng/mL | 0.05 |
| Δ¹-Piperideine-6-carboxylate | Cyclization Intermediate | 0.2–1,500 ng/mL | 0.08 |
| α-Aminoadipic Acid | Lysine Catabolite | 0.5–1,000 ng/mL | 0.10 |
| Saccharopine | Early Lysine Condensation Product | 0.2–1,200 ng/mL | 0.07 |
| Piperideine Carboxylic Acid | Oxidative Intermediate | 0.3–1,800 ng/mL | 0.09 |
| L-Lysine | Metabolic Precursor Amino Acid | 1–5,000 ng/mL | 0.15 |
| Pipecolic Acid Lactam | Cyclic Lactam form of Pipecolic Acid | 0.1–1,000 ng/mL | 0.06 |
| L-Pipecolate | Reduced form involved in alternative pathways | 0.2–1,200 ng/mL | 0.07 |
| 2-Aminoadipic Semialdehyde | Intermediate in Lysine Degradation | 0.3–1,000 ng/mL | 0.08 |
| Glutarate | Downstream Lysine Degradation Product | 0.5–1,200 ng/mL | 0.10 |
| α-Ketoadipate | Final intermediate before entry into TCA cycle | 0.2–1,000 ng/mL | 0.09 |
Advantages of Pipecolic Acid Assay
- Ultra-Low Detection Limit: Quantification down to 0.05 ng/mL, allowing reliable analysis of trace-level metabolites in complex matrices.
- Wide Linear Dynamic Range: Supports accurate quantification from 0.1 to 2,000 ng/mL, accommodating both low- and high-abundance analytes in a single run.
- Exceptional Precision and Reproducibility: Relative Standard Deviation (RSD) maintained at ≤ 4% intra-batch and ≤ 6% inter-batch, ensuring consistent data quality.
- High Throughput Capability: Analytical platform supports processing of up to 200 samples per week, significantly shortening project turnaround time.
- Multiplex Detection: Simultaneous quantification of 6–12 pathway-related metabolites in a single assay, reducing sample volume requirements and analytical cost.
- Stable Isotope Quantification Ready: Enables 13C- or 15N-labeled metabolic flux analysis with calibration curve R² ≥ 0.995, supporting advanced pathway studies.
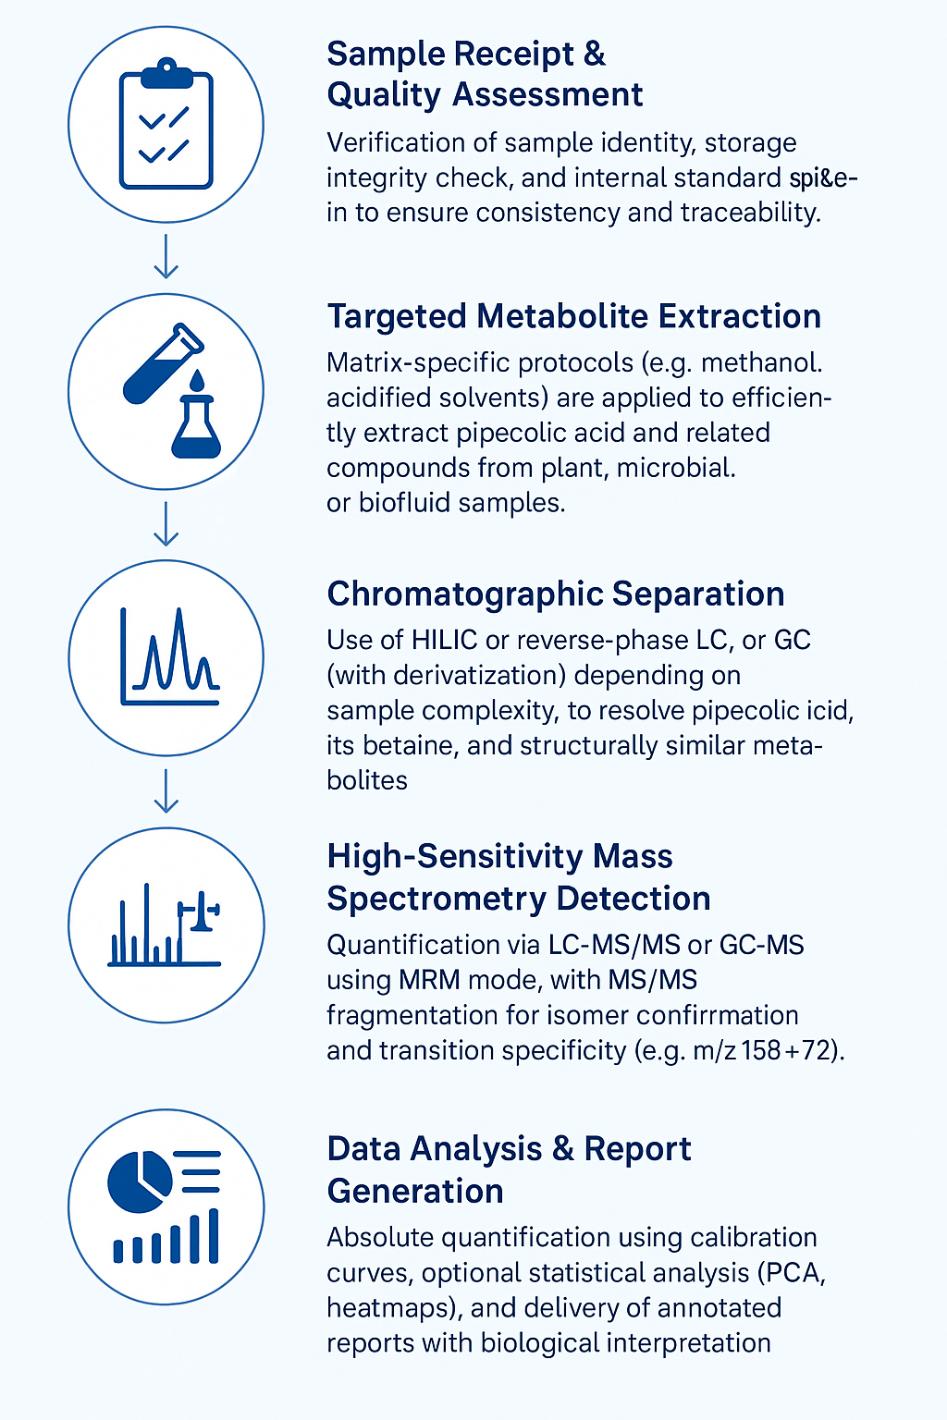
Workflow for Pipecolic Acid Analysis Service
Technology Platform for Pipecolic Acid Analysis Service
LC-MS/MS
Best for: High-sensitivity quantification of pipecolic acid and related metabolites in complex biological matrices
| Parameter | Specification |
|---|---|
| Platform | Agilent 6495C Triple Quadrupole LC–MS/MS |
| Technique | Targeted Multiple Reaction Monitoring (MRM) |
| Sensitivity | LOD < 0.05 ng/mL |
| Quantitative Range | 0.1–2,000 ng/mL |
| Matrices | Plant tissues, plasma, microbial cultures, cell lysates |
| Calibration | Internal standard (e.g., ¹³C₅-pipecolic acid) |
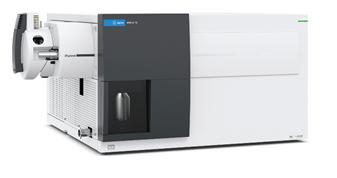 Agilent 6495C Triple Quadrupole (Figure from Agilent)
GC–MS (with Derivatization)
Best for: Volatile or derivatized pipecolic acid in food, microbial, or processed samples
| Parameter | Specification |
|---|---|
| Platform | Agilent 7890B GC + 5977A Single Quadrupole MS |
| Technique | GC–MS after silylation derivatization (e.g., BSTFA) |
| Target Compounds | Pipecolic acid, piperideine derivatives, organic acid esters |
| Use Case | Functional foods, fermentation profiling, volatile acid mapping |
| Confirmation | MS spectra matching of derivatized forms |
 Agilent 7890B-5977A (Figure from Agilent)
HPLC-UV
Best for: Routine quantification in large sample sets when MS sensitivity is not required
| Parameter | Specification |
|---|---|
| Platform | Agilent 1260 Infinity II HPLC |
| Detection | UV absorbance at 210–220 nm |
| Separation Time | ≤15 min per sample (pipecolic acid and related amino acids) |
| Matrix Compatibility | Plant extracts, fermentation broth, purified fractions |
| Use Case | Cost-effective screening, QA/QC workflows |
 Agilent 1260 Infinity II HPLC (Fig from Agilent)
Sample Requirements for Pipecolic Acid Analysis Service
| Sample Type | Recommended Volume / Weight | Storage Conditions | Remarks | Sample Type |
|---|---|---|---|---|
| Plant Tissue (leaf, root, seed) | ≥ 100 mg (fresh or freeze-dried) | −80°C | Remove soil/debris; flash-freeze in liquid nitrogen | Plant Tissue (leaf, root, seed) |
| Cell Culture Pellet | ≥ 1 × 10⁷ cells or 50 mg | −80°C | Wash with PBS and remove supernatant before freezing | Cell Culture Pellet |
| Bacterial Pellet | ≥ 1 × 10⁹ cells or 50 mg | −80°C | Harvest during log phase; snap freeze immediately | Bacterial Pellet |
| Biological Fluids (e.g., serum, plasma, urine) | ≥ 100 µL | −80°C | Avoid repeated freeze-thaw cycles | Biological Fluids (e.g., serum, plasma, urine) |
| Fermentation Broth / Culture Supernatant | ≥ 500 µL | −80°C | Centrifuge to remove solids if possible | Fermentation Broth / Culture Supernatant |
| Extracted Samples (optional) | ≥ 100 µL | −80°C | Clearly label solvent system used (e.g., MeOH:H₂O) | Extracted Samples (optional) |
Demo Results

GC–MS run and mass spectrum of pipecolic acid (Franz, M. Heiko, et al., 2018)

Product ion fragmentation spectrum for (a) AA(Aze)AA, (b) AAPAA, (c) AA(Pip)AA, (d) AA(NMeA)AA, and (e) AA(D-Pro)AA (Raulfs, Mary Disa M., et al., 2014)

Chromatographic separation of some proline-derived compounds and pipecolic acid betaine by HPLC ESI-MS/MS (Servillo, Luigi, et al., 2012)
FAQ of Pipecolic Acid Analysis Service
How do you ensure accurate quantification of low-abundance pipecolic acid in complex plant matrices like citrus or legumes?
We implement derivatization (e.g., AccQ-tag labeling) and selective ion monitoring (e.g., m/z 300 → 130 for pipecolic acid derivatives) to bypass interference from co-eluting amino acids such as glutamic acid, lysine, or pyroglutamate—especially important in fruit and leaf extracts with high nitrogen background.
Is it possible to distinguish between pipecolic acid and its betaine (homostachydrine) in a single run?
Yes. Our LC-MS/MS method resolves both compounds chromatographically and confirms each via distinct MS/MS transitions (e.g., 158 → 72 for pipecolic acid betaine), even when their concentrations differ by orders of magnitude—as shown in citrus juice vs. leaf extracts.
Do you offer detection of stereoisomers (e.g., D- vs. L-pipecolic acid)?
Standard workflows quantify total pipecolic acid, but on request, we offer chiral separation methods (e.g., derivatization with Marfey's reagent + LC-MS) to resolve enantiomers in samples such as legumes or microbial fermentation broths.
How do you deal with method interference from endogenous methylated amino acids in stress-related plant samples?
We routinely screen and exclude overlapping fragments (e.g., N-methylproline, betonicine) using comparative fragmentation libraries and retention time standards to prevent misidentification of pipecolic acid betaine—particularly relevant for drought-stressed tissues.
Can I use this analysis to study osmolyte accumulation under abiotic stress conditions?
Absolutely. We provide multiplex analysis of pipecolic acid, proline, stachydrine, and GABA betaine in a single panel, enabling comprehensive osmolyte profiling in response to salt, drought, or temperature shifts in plants or microbes.
What if my sample is low-volume or has been previously extracted?
We accept extracted materials (≥100 µL), provided the solvent composition is documented. Our team can evaluate extract quality for signal integrity, and if needed, advise on re-extraction or pre-concentration options.
Learn about other Q&A.
Pipecolic Acid Analysis Service Case Study

Title: Occurrence of Pipecolic Acid and Pipecolic Acid Betaine (Homostachydrine) in Citrus Genus Plants
Journal: Journal of Agricultural and Food Chemistry
Published: 2011
- Study Summary
- Background
- Methods
- Results
- Reference
This study reports, for the first time, the occurrence of pipecolic acid and its methylated derivative pipecolic acid betaine (homostachydrine) in citrus plants, including orange, lemon, and bergamot. Using synthesized standards and sensitive LC-MS/MS methods, the researchers quantified both compounds across various citrus tissues and confirmed their presence using structural and fragmentation analysis.
In plants, betaine accumulation is a conserved biochemical response to abiotic stress such as salinity, drought, or temperature fluctuation. While betaines derived from proline are known osmolytes in Citrus genus plants, pipecolic acid betaine, a structural homolog of proline betaine, had not previously been detected in woody plants. Given the known roles of pipecolic acid in stress signaling and its presence in non-woody species, this study aimed to investigate whether it and its betaine derivative are also present in citrus.
The authors combined synthesis, purification, and LC-ESI-MS/MS techniques to analyze pipecolic acid and pipecolic acid betaine in various plant matrices:
- Pipecolic acid betaine synthesis was achieved through methylation of pipecolic acid with methyl iodide in the presence of KHCO₃.
- Structural confirmation and fragmentation patterns were established using quadrupole ion-trap mass spectrometry, highlighting unique transitions (notably m/z 158 → 72) that allow unambiguous detection.
- Sample matrices included citrus leaves, seeds, and juices, as well as alfalfa leaves (as positive control).
- To overcome interference in pipecolic acid analysis, derivatization with AccQ reagent was employed, allowing specific MS/MS detection using transitions such as m/z 300 → 130 and 300 → 171.
Creative Proteomics offers a complete solution for pipecolic acid analysis based on these advanced strategies:
- Targeted quantification via LC-MS/MS with matrix-matched calibration
- Co-analysis of pipecolic acid betaine (homostachydrine) and N-methylated proline derivatives
- Structural confirmation using MS/MS fragmentation profiling
- Optional derivatization-based methods to eliminate signal interference in complex plant or microbial matrices
- Multi-matrix support including fruit juice, seeds, leaves, and microbial cultures
- Pipecolic acid and pipecolic acid betaine were both detected in citrus plants, with the highest concentrations found in bergamot leaves (pipecolic acid: 16–24 mg/kg; betaine: 8–10 mg/kg).
- Juices showed much lower levels, with betaine concentrations often below 1 mg/kg.
- The successful synthesis and MS/MS characterization of pipecolic acid betaine enabled confident quantification in complex plant matrices, even at trace levels.
- The study suggests that methyltransferases involved in proline methylation may also catalyze methylation of pipecolic acid, although at lower efficiency, making pipecolic acid betaine a potential metabolic byproduct rather than a major osmolyte in citrus.
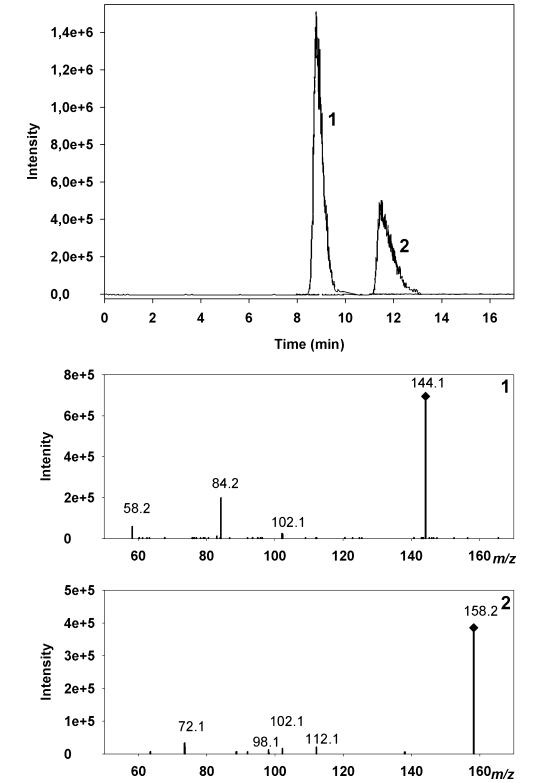 Chromatographic separation of Medicago sativa leaf extract by HPLC–ESI–MS/MS. Extracted ion chromatograms show transitions 144.1→84.2 (Peak 1) and 158.2→72.1 (Peak 2).
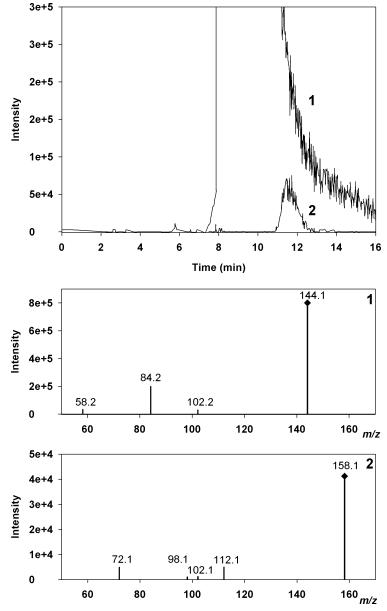 Chromatographic separation of bergamot juice using HPLC–ESI–MS/MS. Extracted ion chromatograms show MS² transitions 144.1→84.2 (Peak 1) and 158.1→72.1 (Peak 2).
Reference
- Servillo, Luigi, et al. "Occurrence of pipecolic acid and pipecolic acid betaine (homostachydrine) in Citrus genus plants." Journal of Agricultural and Food Chemistry 60.1 (2012): 315-321. https://doi.org/10.1021/jf204286r.
Publications
Here are some of the metabolomics-related papers published by our clients:

- A human iPSC-derived hepatocyte screen identifies compounds that inhibit production of Apolipoprotein B. 2023. https://doi.org/10.1038/s42003-023-04739-9
- The activity of the aryl hydrocarbon receptor in T cells tunes the gut microenvironment to sustain autoimmunity and neuroinflammation. 2023. https://doi.org/10.1371/journal.pbio.3002000
- Lipid droplet-associated lncRNA LIPTER preserves cardiac lipid metabolism. 2023. https://doi.org/10.1038/s41556-023-01162-4
- Inflammation primes the kidney for recovery by activating AZIN1 A-to-I editing. 2023. https://doi.org/10.1101/2023.11.09.566426
- Anti-inflammatory activity of black soldier fly oil associated with modulation of TLR signaling: A metabolomic approach. 2023. https://doi.org/10.3390/ijms241310634
- Plant Growth Promotion, Phytohormone Production and Genomics of the Rhizosphere-Associated Microalga, Micractinium rhizosphaerae sp. 2023. https://doi.org/10.3390/plants12030651