Label-Free Quantification Services for Deep Proteome Profiling
At Creative Proteomics, our label-free quantification (LFQ) services are designed to support both exploratory and hypothesis-driven research by enabling the precise measurement of protein abundance across diverse sample types—including cell lysates, tissue homogenates, and biofluids.
Our platform delivers not just a list of proteins, but meaningful biological insights. Clients receive:
- A detailed catalog of all confidently identified proteins
- Statistical comparisons highlighting significant changes in protein expression
- Functional annotation and pathway enrichment for downstream interpretation
Submit Your Request Now
×
- Clearly shows how protein levels vary across your experimental groups—ideal for screening, validation, or biomarker studies.
- Compatible with a wide range of biological samples, including low-input or complex matrices like plasma and plant tissue.
- Delivers publication-ready results with statistical confidence and functional context—no extra analysis required on your end.
- What is
- Service Details
- FAQ
- Case Study
- Demo
- Publication
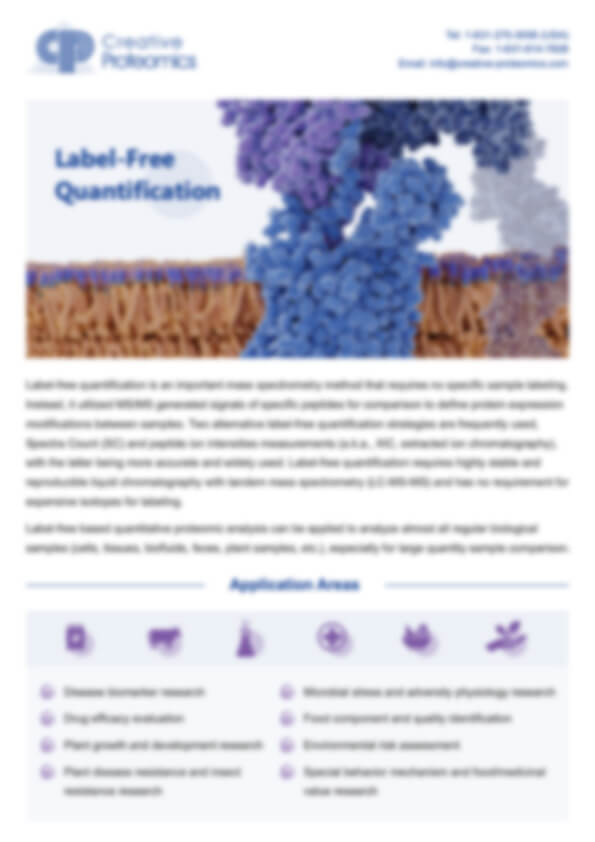
What is Label-free quantification
Label-free quantification (LFQ) is a powerful mass spectrometry-based protein quantification approach that enables researchers to compare protein levels across multiple biological samples—without the need for isotope labeling or chemical tags. This streamlined technique has become a cornerstone of modern proteomics for its simplicity, scalability, and precision.
How It Works
In label-free workflows, proteins are enzymatically digested into peptides, which are then analyzed using tandem mass spectrometry (MS/MS). Advanced algorithms identify peptides via database matching, and quantify them based on either:
- Spectral counting (number of MS/MS spectra per peptide), or
- Chromatographic peak intensity (area under the curve in extracted ion chromatograms)
Why Choose Label-Free Quantification?
Compared to traditional 2D electrophoresis (2DE) or isotope-based methods, LFQ offers key advantages:
Higher throughput: Ideal for large-scale studies without complex sample prep
Improved sensitivity: Expands dynamic range 3–4x compared to 2DE
Automation-ready: Easily integrated with high-throughput platforms
Cost-effective: No need for expensive labeling reagents or protocols
Considerations for Use
While LFQ is widely adopted for its convenience, it's best suited for:
- Projects where relative protein abundance is sufficient
- Samples with consistent preparation and minimal technical variability
- Labs equipped with reproducible LC-MS/MS instrumentation
However, it may be less ideal when:
- Absolute quantification is required
- Biological variability is high and normalization is challenging
| Category | Label-free | Labelled |
|---|---|---|
| Machine time | more | less |
| Wet lab complexity time | little | medium |
| Comparability of samples | difficult | easy |
| Data analysis | complex | complex |
| Study design | flexible | fixed |
Whether you're mapping signaling pathways, validating biomarkers, or profiling stress responses, Creative Proteomics' label-free quantification service delivers high-confidence, reproducible results—tailored to your research needs.
Label Free Quantification Options: DDA, DIA & 4D DIA
We offer all three workflows—DDA, DIA, and 4D-DIA —and tailor our recommendation based on your project's experimental goals, sample characteristics, and budget:
| Method | Abbreviation | Technical Overview | Ideal Use Cases | Key Advantages |
|---|---|---|---|---|
| Data Dependent Acquisition | DDA | MS selects the top N most intense ions for fragmentation. Good for building spectral libraries and deep peptide mapping |
|
|
| Data Independent Acquisition | DIA | MS fragments all ions in preset m/z windows, offering comprehensive, reproducible datasets |
|
|
| Four Dimensional DIA | 4D DIA | Builds on DIA by adding ion mobility separation (CCS dimension) for enhanced depth, selectivity, and quantitation |
|
|
Choosing the Right Method
- Exploratory studies or building spectral libraries → Choose DDA for precise peptide mapping.
- Need scaled, reproducible quantification across many samples → DIA is the optimal choice.
- Analyzing highly complex or limited samples with maximal depth and accuracy → Go for 4D DIA for state-of-the-art performance.
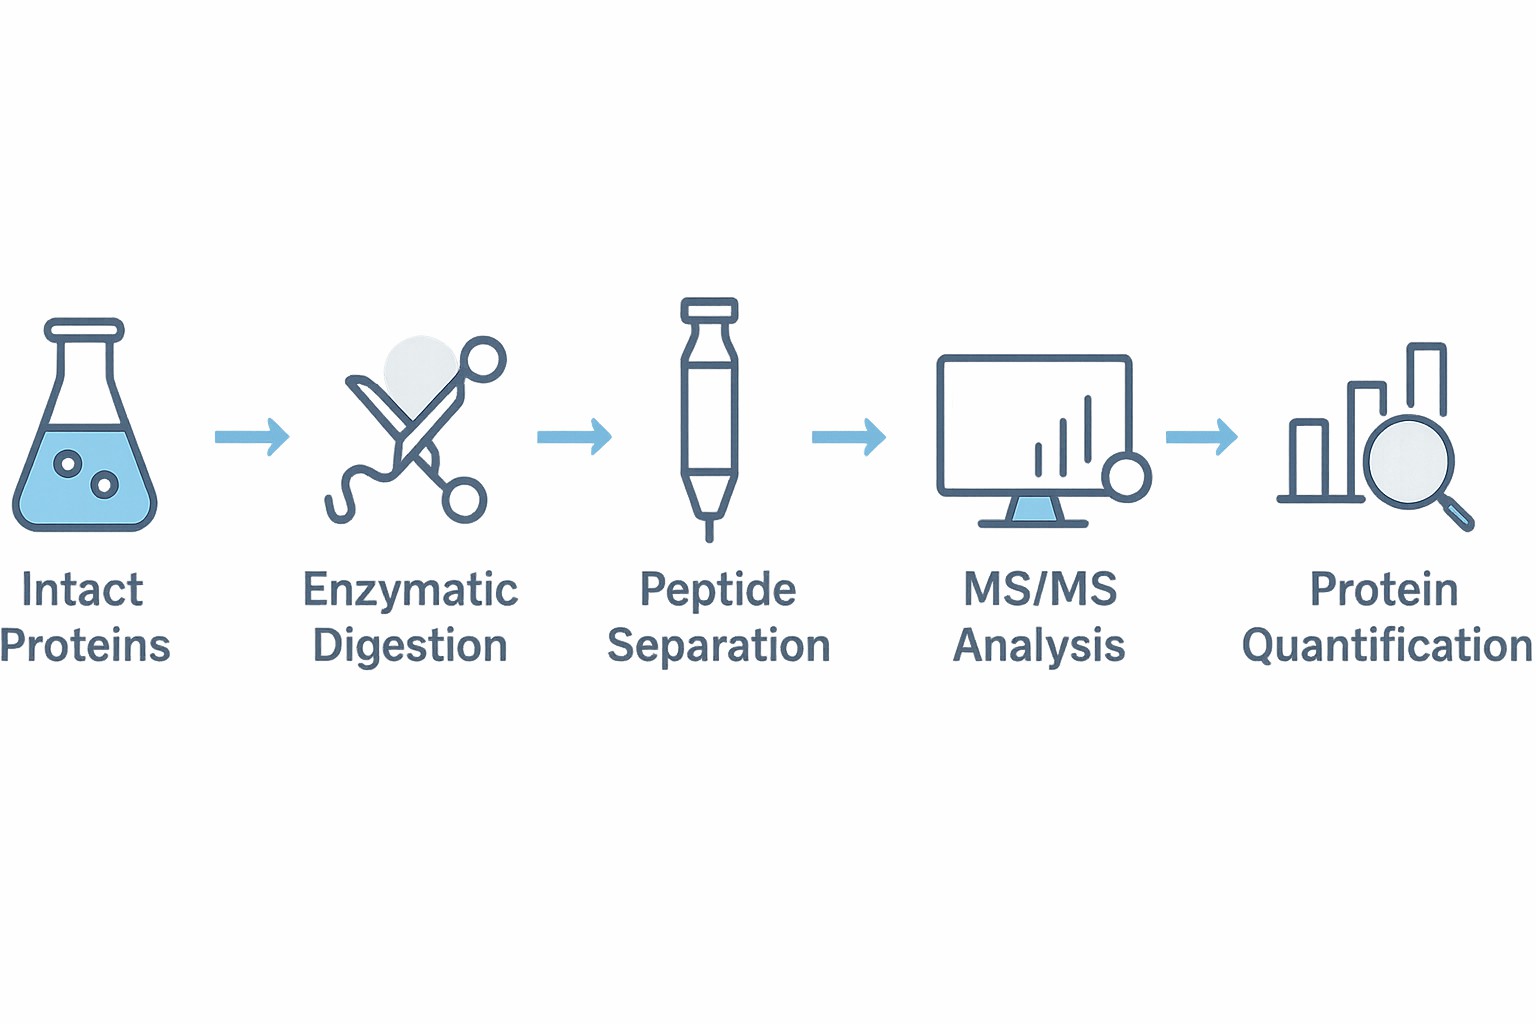
Our Proven Four-Step LFQ Workflow
Sample Preparation
Proteins are extracted from the sample matrix and processed through reduction, alkylation, and enzymatic digestion—ensuring optimal peptide generation for mass spectrometry.
Separation and Mass Spectrometry (LC-MS/MS)
Digested peptides are separated via liquid chromatography and analyzed by tandem mass spectrometry to achieve high-resolution identification and quantification.
Data Processing & Quantification
Advanced bioinformatics pipelines are used to identify peptides, quantify their abundance across samples, and assess statistical significance of observed differences.
Biological Data Interpretation
Results are integrated with pathway and network databases to reveal mechanistic insights, signaling cascades, or disease-relevant biomarkers.
Whether you're investigating disease mechanisms, monitoring therapeutic effects, or performing biomarker discovery, our label-free proteomics service equips you with reproducible, biologically relevant data—ready for publication or pipeline decisions.
Interpreting Results
Our label-free proteome quantification service delivers not only accurate protein abundance data but also deep biological interpretation to support your research objectives. After mass spectrometry analysis and quantitative processing, we provide a complete suite of downstream bioinformatics analyses to help you extract meaningful insights:
- Data Output Statistics & Quality Control: Evaluate instrument performance, replicate consistency, and peptide/protein coverage to ensure data reliability.
- Protein Identification & Quantification: Confident identification and relative quantification of proteins across sample groups.
- GO & Pathway Annotation: Functional classification of identified proteins by Gene Ontology (GO) terms and KEGG pathways, offering insight into biological processes, molecular functions, and cellular components.
- COG Analysis: Cluster of Orthologous Groups (COG) annotation to infer evolutionary relationships and functional roles.
- Enrichment Analysis of Differential Proteins:
- GO Enrichment: Identify biological functions significantly enriched among up- or down-regulated proteins.
- Pathway Enrichment: Detect key pathways with significant changes in protein involvement, supporting mechanism-of-action studies.
- COG Enrichment: Highlight overrepresented functional categories in differentially expressed proteins to guide further hypothesis generation.
This layered interpretation framework enables a seamless transition from raw spectral data to biological conclusions—empowering you to publish, validate, or move forward with confidence.
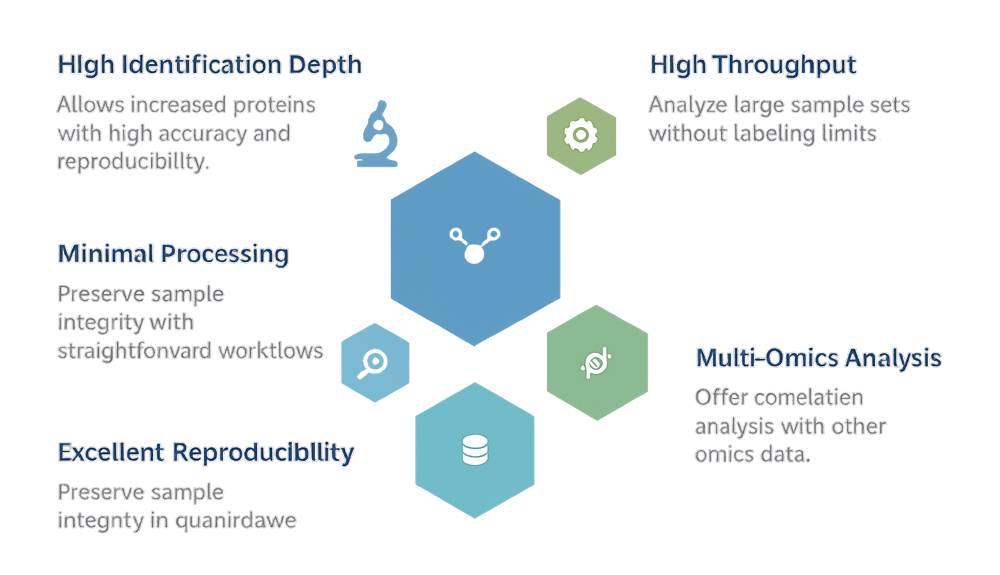
Why Choose Label-Free Quantification with Creative Proteomics?
Our label-free quantification service streamlines proteomic analysis without compromising data quality or scalability. Here's why it works for so many of our clients:
✅ No sample number limit – Easily compare multiple conditions or biological replicates
✅ Minimal processing required – Preserves protein integrity and reduces prep bias
✅ High compatibility – Effective for tissues, cells, fluids, or protein extracts
✅ Excellent reproducibility – Consistent results across batches and instruments
We combine these advantages with a cost-effective, time-saving platform to support both broad proteome surveys and focused protein quantification needs.
Analytics Platform for Proteomics Services
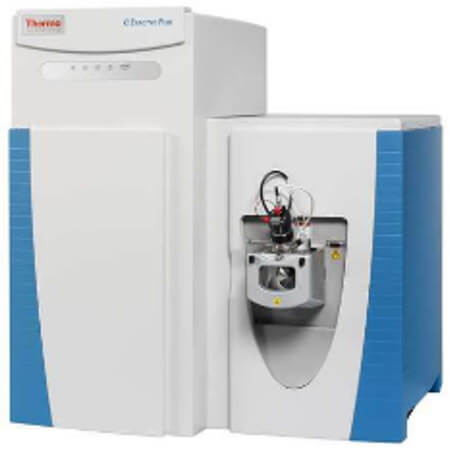
Thermo Q ExactiveTM series
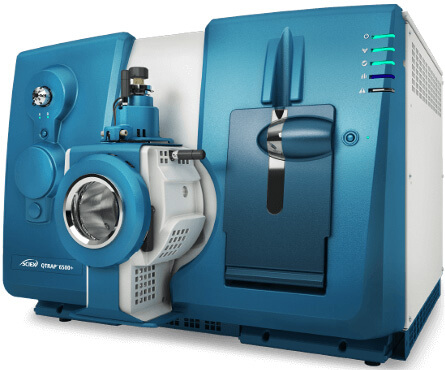
AB Sciex 6500+
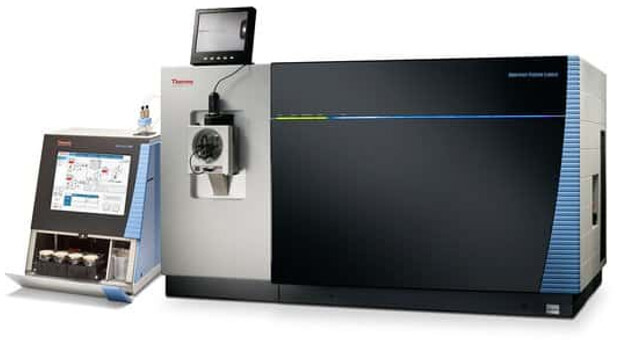
Thermo Orbitrap Fusion Lumos
Bruker timsTOF Pro
Sample Requirements
To ensure accurate and reliable results, we require the following sample inputs for label-free protein quantification:
Animal tissue: ≥ 1 mg
Plant tissue: ≥ 10 mg
Cultured cells: ≥ 1×10⁶ cells
Biofluids: Please contact us for case-specific guidance
Protein extract: ≥ 300 µg total protein
We accept a wide variety of sample types and encourage early consultation to ensure compatibility with our platform.
What You'll Receive
Clients receive a comprehensive data package, including:
- A detailed experiment report (sample prep, instrumentation, workflow)
- Full raw data files from LC-MS/MS runs
- Processed data outputs, including protein ID, quantification tables, and statistical plots
Frequently Asked Questions
What are the key features of label-free quantification?
Label-free quantification (LFQ) stands out for its simplicity and minimal sample manipulation. Its core features include:
- Minimal sample preparation: No need for expensive isotope labels or chemical tags
- Preserves biological integrity: Fewer steps reduce the risk of introducing artifacts
- Lower cost and resource demand: Ideal for large-scale or budget-sensitive studies
- Scalable to multiple samples: Avoids limitations imposed by fixed multiplexing kits
- High dependency on LC-MS/MS performance: Requires stable and reproducible chromatography and mass spectrometry for accurate results
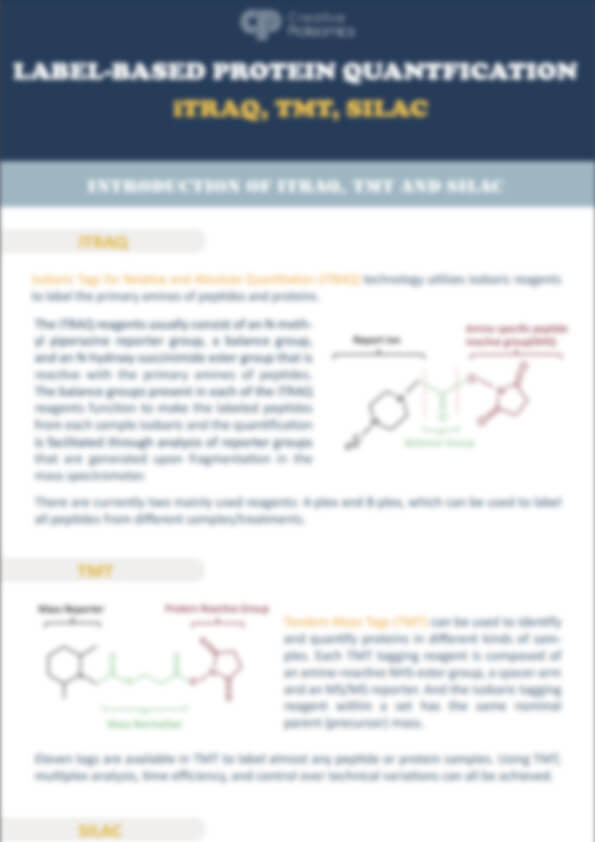
How does label-free quantification compare to iTRAQ?
Each method has unique strengths and trade-offs. Here's a quick comparison:
| Feature | iTRAQ | Label-Free Quantification |
|---|---|---|
| Sample Labeling | Requires chemical labeling (2–8 samples multiplexed) | No labeling; direct quantification |
| Throughput | High (up to 8 samples simultaneously) | Flexible, no fixed channel limits |
| Cost | High reagent cost; complex workflow | More economical; minimal reagents required |
| Data Depth | Effective for low MW peptides and PTM analysis | Higher protein coverage per run |
| Ease of Use | Labor-intensive; multiple labeling steps | Simpler workflow; fewer technical steps |
| Accuracy & Variability | Generally robust quantification | Depends heavily on MS stability and reproducibility |
| Ideal Use Cases | Comparative studies with limited sample numbers | Exploratory studies with broad dynamic range |
In summary:
- iTRAQ is best suited for controlled, small-to-medium scale comparisons where labeling precision is critical.
- Label-free is preferred for large sample sets, exploratory projects, or when sample source diversity makes labeling impractical.
Learn about other Q&A.
Client Case Study: Label-Free Proteomics Reveals Systemic Impacts on the Retina in APOB100 Mice
El-Darzi, N., Mast, N., Li, Y., & Pikuleva, I. A. (2024). APOB100 transgenic mice exemplify how the systemic circulation content may affect the retina without altering retinal cholesterol input. Investigative Ophthalmology & Visual Science, 65(13), 19. https://doi.org/10.1167/iovs.61.13.19
- Background
- We Provide
- Key Results
- Conclusion
In this study, researchers aimed to explore whether changes in the systemic lipid profile—specifically those induced by APOB100 overexpression in the liver—could affect retinal physiology despite unchanged cholesterol influx. The retina, traditionally viewed as cholesterol-autonomous, may still be vulnerable to systemic metabolic cues. The research required high-resolution, label-free proteomic profiling to detect subtle yet biologically significant protein expression shifts in mouse retina tissue.
Creative Proteomics delivered a full-spectrum label-free quantitative proteomics solution, including:
- Sample Processing: Retina tissue homogenization, protein extraction, reduction, alkylation, and enzymatic digestion.
- LC-MS/MS Analysis: High-resolution acquisition on a Q-Exactive Orbitrap platform with nano-LC front-end.
- Protein Identification & LFQ Quantification: Performed using MaxQuant with stringent FDR control and LFQ intensity normalization.
- Bioinformatics & Functional Interpretation: Differential expression statistics and GO enrichment analyses to map changes to biological pathways.
- 2,281 proteins were confidently identified; 1,468 proteins met strict quantitative quality thresholds.
- 294 proteins were significantly dysregulated in APOB100 vs. wild-type retinas (log₂FC > ±1.5, p < 0.05).
- Enrichment analysis of upregulated proteins revealed pathways involved in lipid droplet metabolism, oxidative stress response, and mitochondrial function (e.g., SOD2, GST, NQO1).
- Downregulated proteins mapped to ion transport and photoreceptor-related processes, suggesting systemic stress affects visual function pathways.
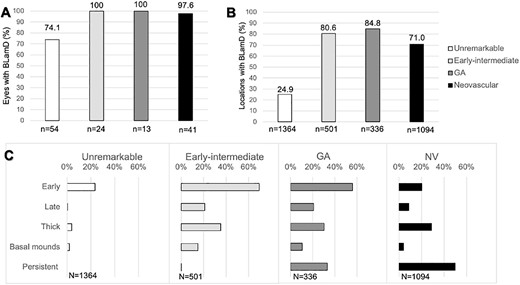 Figure B–C. GO enrichment analysis of significantly upregulated (B) and downregulated (C) proteins in the retina of APOB100 transgenic mice. Highlighted functions include lipid droplet metabolism, oxidative stress response, ion transport, and photoreceptor maintenance.
This study demonstrated that label-free proteomics can sensitively detect systemic, non-cholesterol-driven alterations in the retina. Creative Proteomics' robust LC-MS/MS and bioinformatics workflows enabled the discovery of metabolic reprogramming and stress-response signatures, offering insight into how peripheral lipid metabolism can indirectly reshape retinal proteome homeostasis.
Demo

Typical quantification-only results in a label-free proteomics workflow, including sample bar charts, box plots, peptide coverage distribution, and protein abundance heatmap.

Representative visual outputs from a label-free quantitative proteomics analysis, including PCA clustering, hierarchical heatmap, volcano plot of differential proteins, and quality control metrics.
Publication

- Uptake of Polystyrene Nanoplastic and its Impacts on the Proteome of Salmonid cells (Master's thesis, UiT The Arctic University of Norway). Uptake of Polystyrene Nanoplastic and its Impacts on the Proteome of Salmonid cells. https://munin.uit.no/handle/10037/29530
- Phenothiazines rapidly induce laccase expression and lignin-degrading properties in the white-rot fungus Phlebia radiata. Journal of Fungi. https://doi.org/10.3390/jof9030371
- Metabolic and morphotypic trade-offs within the eco-evolutionary dynamics of Escherichia coli. Microbiology Spectrum. https://doi.org/10.1128/spectrum.00678-22