

Triglycerides (triacylglycerols, TAGs) are a class of glycerolipids and are not a single molecular species but a family of thousands of distinct lipid molecules defined by the combination of three fatty acyl chains esterified to a glycerol backbone. The fatty acyl chains vary in length (C8 to C24), degree of unsaturation (0 to 6 double bonds), and positional distribution (sn-1, sn-2, sn-3), creating a molecular diversity that is directly relevant to biological function. A TAG containing three saturated fatty acids behaves differently in cellular membranes and lipoprotein particles than a TAG containing one saturated and two polyunsaturated chains, yet conventional clinical assays measure total TAG concentration without resolving these species. Modern LC-MS-based lipidomics addresses this gap by providing fatty acyl chain-level resolution, enabling researchers to link specific TAG species to metabolic pathways, dietary interventions, and disease states in animal models. This guide covers the complete analytical pipeline for TAG analysis, from lipid extraction and LC-MS method development through data processing and quality control, with emphasis on the experimental design decisions that determine whether a TAG profiling study produces biologically meaningful data. All applications discussed herein are intended for research use only. For additional insights into glycerolipids structure synthesis, explore our in-depth resource.
Triglyceride Structural Diversity and Its Analytical Implications
The analytical complexity of triglycerides arises directly from their structural diversity. Understanding how structural features affect chromatographic and mass spectrometric behavior is prerequisite to method design.
Fatty Acyl Chain Diversity
A typical mammalian lipidome contains TAG species with fatty acyl chains ranging from short-chain fatty acids like caprylic acid (C8:0) to long-chain polyunsaturated docosahexaenoic acid (C22:6, 22 carbons, 6 double bonds). Each additional carbon increases the hydrophobicity and therefore the reversed-phase retention time by approximately 0.5-1 minute under standard C18 gradient conditions. Each double bond decreases retention by approximately 0.3-0.5 minutes due to the kinked conformation of unsaturated chains reducing interaction with the stationary phase. This means that TAG 50:1 (one double bond, 50 total carbons) and TAG 50:2 (two double bonds) can be partially or completely separated by LC, but their mass spectra differ by only 2 Da, requiring high-resolution MS to distinguish them. The sn-positional distribution of fatty acids on the glycerol backbone (which chain occupies sn-1, sn-sn-2, or sn-3) does not affect the molecular mass but does influence MS/MS fragmentation patterns. In positive ion mode, TAGs form [M+NH4]+ adducts that fragment by neutral loss of one fatty acyl chain as a free fatty acid or ammonium fatty acid carboxylate, producing a diacylglycerol (DAG) fragment ion. The relative abundance of the [DAG]+ ions from loss of the sn-2 chain versus sn-1/sn-3 chains differs because the sn-2 ester bond is thermodynamically less stable, enabling positional isomer assignment from the MS/MS spectrum. A 2024 study in the Journal of Agricultural and Food Chemistry demonstrated that this fragmentation difference can be exploited to distinguish TAG regioisomers in complex food lipid extracts, achieving correct sn-position assignment for 87% of identified TAG species.
Analytical Implications of Isomeric TAG Species
TAG isomers that share the same total carbon number and double bond count but differ in the distribution of chains between the three positions (e.g., TAG 16:0/18:1/18:0 versus TAG 18:0/16:0/18:1) are the most challenging analytical target because they have identical molecular weight and similar retention times. Resolving these isomers requires either extended LC gradients (60-90 minutes) on high-resolution C18 columns, or MALDI imaging mass spectrometry or ion mobility spectrometry (IMS), where the collision cross-section difference between positional isomers is typically 1-3% under nitrogen drift gas. For most research applications where total TAG species profiling rather than full positional assignment is the goal, MS/MS-based identification at the sum-composition level (e.g., TAG 50:1) provides sufficient biological information, and the additional resolution of positional isomers is reserved for focused mechanistic studies.
Figure 1: Triglyceride Structural Diversity and Corresponding Analytical Challenges
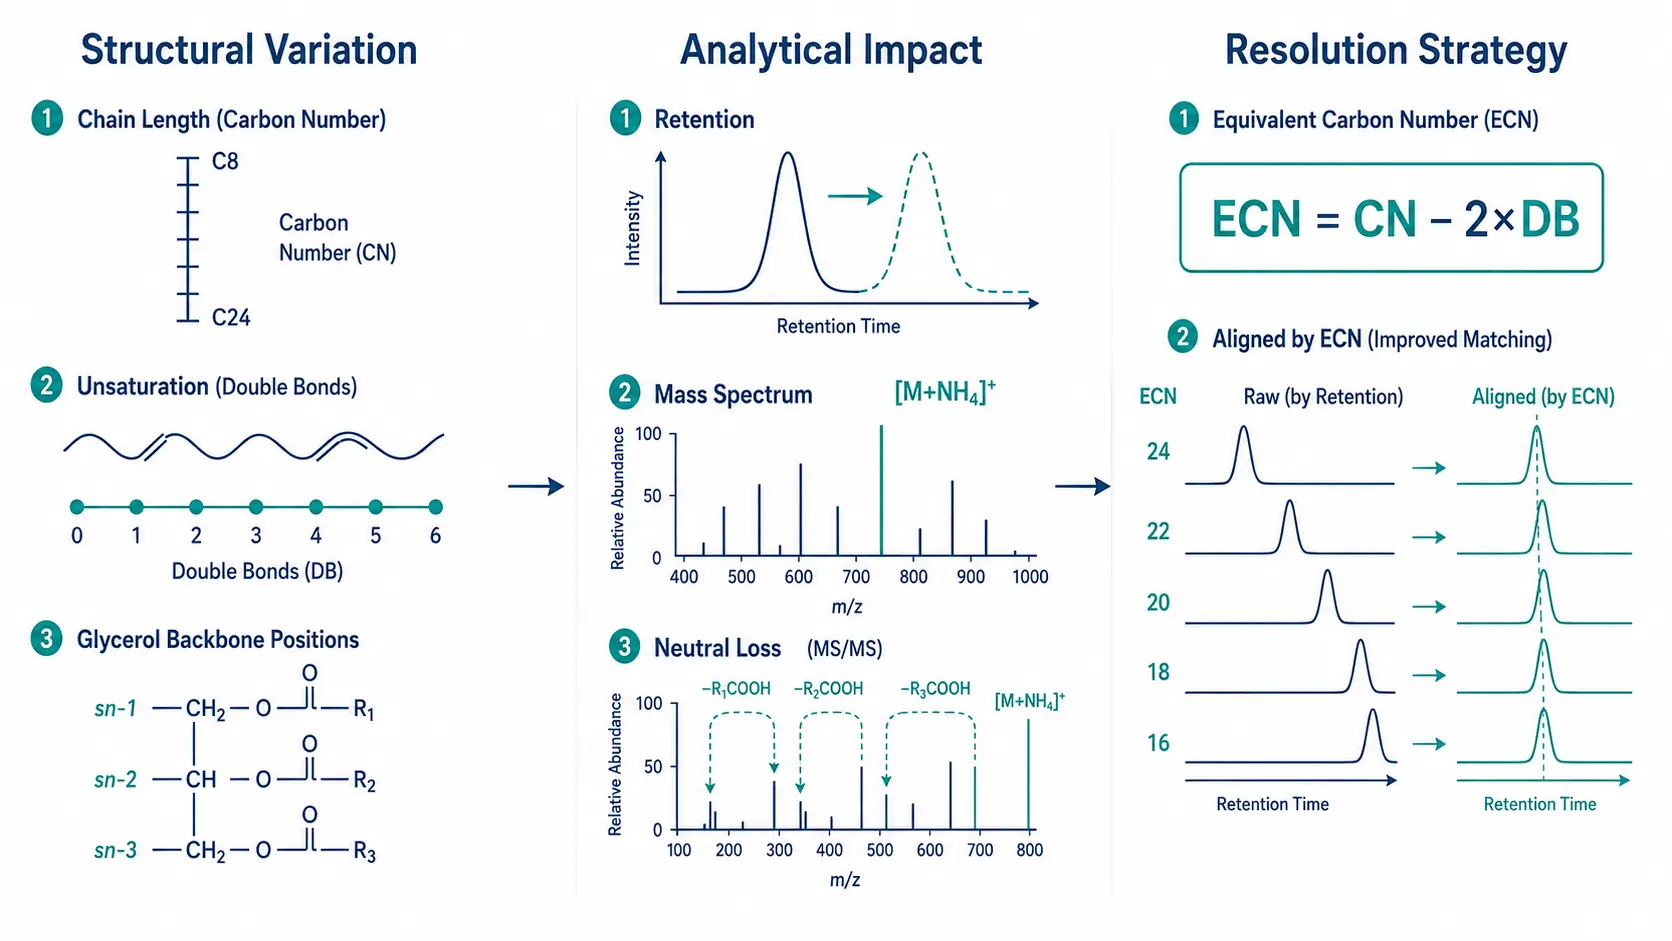 Correlation diagram mapping fatty acyl chain length, unsaturation, and sn-positional variation to their effects on LC retention, MS ionization, and MS/MS fragmentation patterns.
Lipid Extraction and Sample Preparation for Triglyceride Analysis
The lipid extraction step determines which TAG species are recovered and therefore which biological conclusions can be drawn. Biased extraction systematically distorts the TAG profile.
Extraction Method Selection
Three extraction methods dominate TAG lipidomics. The Folch method (chloroform:methanol:water, 8:4:3 v/v/v) has been the historical gold standard for total lipid extraction, recovering >95% of TAGs from tissues and plasma. The MTBE method (methyl-tert-butyl ether:methanol:water, 10:3:2.5 v/v/v) has gained popularity because the lower density of MTBE relative to water simplifies the collection of the organic phase, improving throughput and reproducibility. A 2023 systematic comparison of extraction methods published in Metabolites evaluated recoveries of 12 major lipid classes across Folch, MTBE, and BUME (butanol:methanol) protocols. For TAGs specifically, MTBE recovery was 93-97% of Folch recovery across plasma, liver, and adipose tissue samples, with equivalent reproducibility (CV 8-12% for both methods). BUME extraction showed lower TAG recovery (72-85% of Folch), particularly for long-chain polyunsaturated TAG species, due to the lower solvent polarity. The practical recommendation is to use MTBE for high-throughput studies (>100 samples) where extraction speed is prioritized, and Folch for targeted quantification of specific TAG species where maximum recovery is essential. For lipidomics profiling services, both Folch and MTBE protocols are available depending on the sample type and research question.
Internal Standard Strategy and Sample Stability
TAG internal standards must be synthetic TAGs containing non-endogenous fatty acyl chains, most commonly TAG 15:0/15:0/15:0 (tripentadecanoin) or TAG 17:0/17:0/17:0 (triheptadecanoin). The internal standard is added to the sample before extraction at a concentration that falls within the expected linear range of the TAG species being quantified—typically 10-50 microgram per sample for total TAG quantification, or 1-5 microgram per sample for individual species profiling. The internal standard corrects for extraction efficiency, injection volume variation, and ionization suppression simultaneously, but it cannot correct for differences in ionization efficiency between the internal standard and individual TAG species that have different chain lengths and unsaturation levels. Correction factors for individual TAG species relative to the internal standard must be determined empirically using purified TAG standards or by assuming equal ionization efficiency within a narrow structural range (e.g., TAG 48-56 carbon species versus TAG 15:0/15:0/15:0). Sample stability is a second critical pre-analytical variable: TAGs in plasma or tissue homogenates stored at -80 deg C are stable for at least 6 months, but each freeze-thaw cycle reduces TAG recovery by 5-10% due to oxidation and aggregation at the air-liquid interface. Single-use aliquots for each time point in longitudinal studies eliminate this source of variability.
Figure 2: Lipid Extraction Method Selection for Triglyceride Analysis
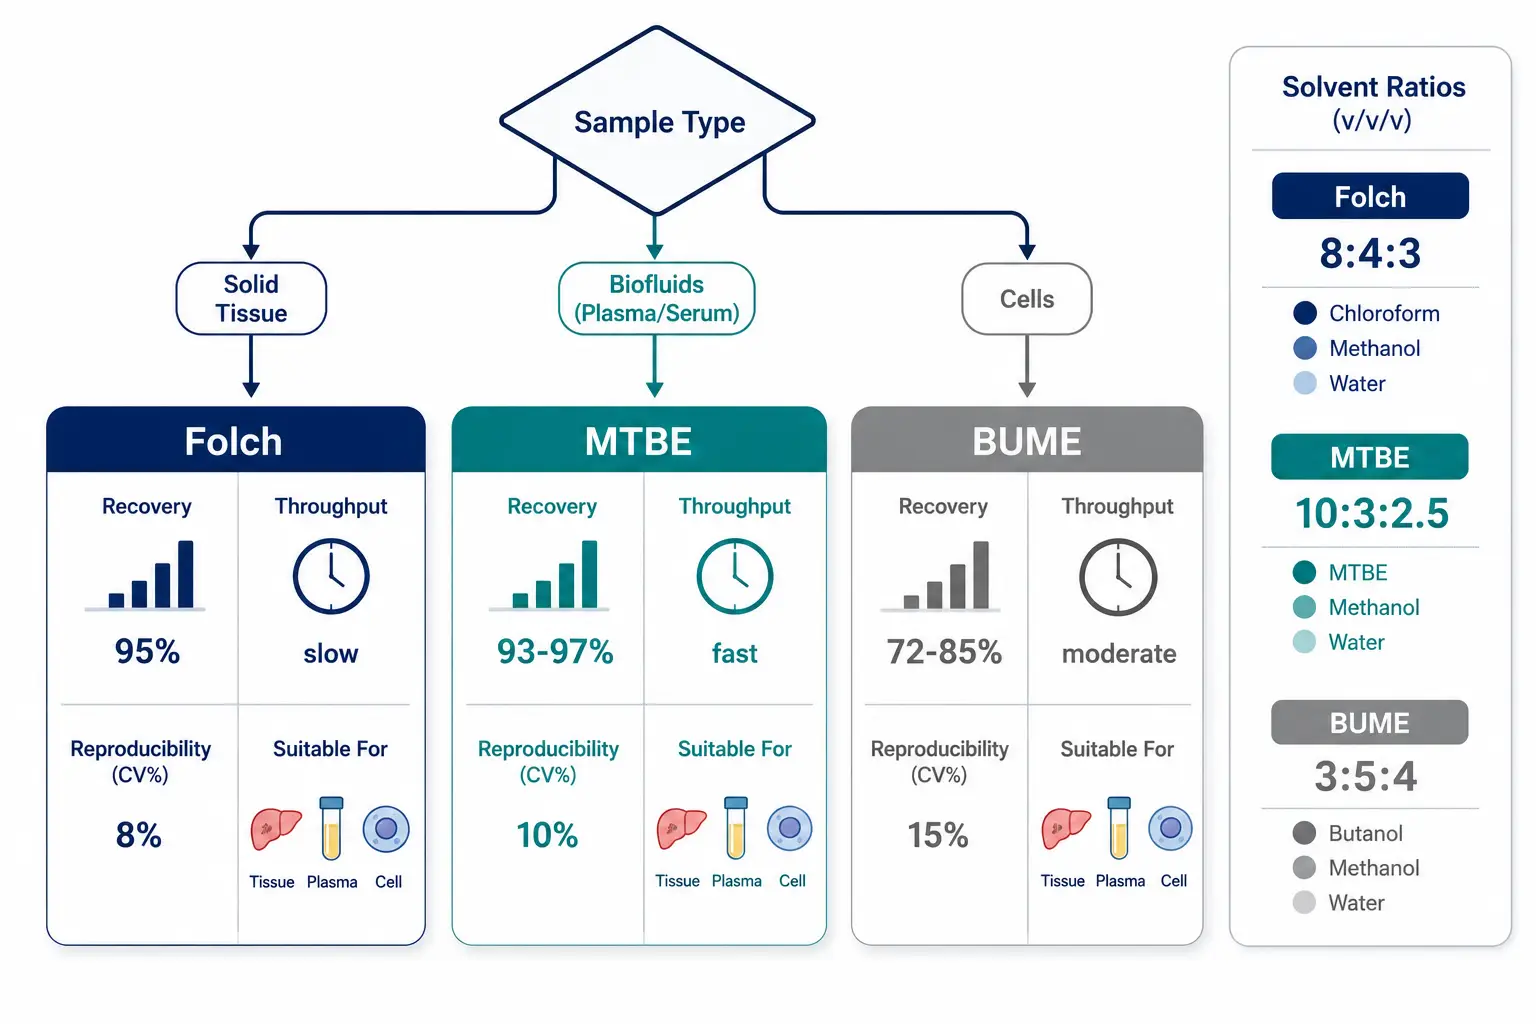 Decision tree comparing Folch, MTBE, and BUME extraction methods across recovery rate, throughput, reproducibility, and compatibility with different sample types.
LC-MS-Based Triglyceride Profiling
LC-MS is the central analytical platform for TAG profiling, providing the chromatographic resolution and mass spectrometric specificity required to distinguish individual TAG species in complex lipid extracts.
Chromatographic Separation
Reversed-phase C18 columns (2.1 x 100 mm, 1.7 micrometer particle size) with a mobile phase of water, acetonitrile, and isopropanol (all containing 10 mM ammonium formate and 0.1% formic acid) provide the standard separation for TAG species. The gradient starts at 30% isopropanol, increases to 60% over 10 minutes, then to 90% over 15 minutes, and holds at 90% for 5 minutes before re-equilibration. Under these conditions, TAGs elute in order of increasing equivalent carbon number (ECN = total carbon number - 2 x double bond count). TAG 48:0 (ECN 48) elutes at approximately 8 minutes, TAG 50:1 (ECN 48) at approximately 9 minutes, and TAG 56:6 (ECN 44) at approximately 6 minutes. The overlapping ECN values for different chain-length/unsaturation combinations mean that LC alone cannot fully resolve all TAG species; co-eluting TAGs with identical ECN require MS/MS-based distinction. A 2025 Shimadzu application note described an LC-MS/MS method using 195 scheduled MRM transitions to cover the major TAG species in human plasma, with a cycle time of 1.2 seconds and dwell time of 6 milliseconds per transition, achieving limits of quantification between 0.1 and 1 nanomole per milliliter for individual TAG species.
Column selection is a critical parameter that affects both separation resolution and method robustness. C18 columns with high carbon load (18-20%) provide the best separation for TAG species differing by one double bond but show batch-to-batch retention time variability that requires periodic adjustment of the gradient profile. C30 columns offer improved separation of TAG regioisomers at the cost of longer analysis times (45-60 minutes per injection) and higher backpressure. For most high-throughput TAG profiling applications, a 2.1 x 100 mm C18 column with 1.7-2.6 micrometer particle size operating at 0.4-0.6 mL/min and 55-65 deg C provides the optimal balance between resolution (baseline separation of TAG species differing by 2 ECN units) and throughput (15-20 minutes per injection). The column temperature is an underappreciated variable: increasing the column temperature from 45 deg C to 65 deg C reduces analysis time by 30-40% by decreasing mobile phase viscosity, but also reduces the retention factor for long-chain polyunsaturated TAGs, potentially causing them to elute in the void volume if the temperature exceeds 70 deg C.
Ionization and Fragmentation
For comprehensive characterization of TAG species, total fatty acid profiling can complement intact TAG analysis by providing quantitative data on the overall fatty acid composition independently of TAG speciation.
TAGs ionize efficiently in positive electrospray ionization (ESI+) as ammonium adducts [M+NH4]+ when ammonium formate or ammonium acetate is included in the mobile phase. The [M+NH4]+ ion undergoes collision-induced dissociation to produce a neutral loss of one fatty acyl chain as the corresponding free fatty acid or ammonium fatty acid carboxylate, yielding a diacylglycerol (DAG) fragment ion [M+H-RCOOH]+. The m/z of the DAG fragment identifies the fatty acyl chain that was lost, enabling the fatty acid composition of the TAG to be deduced. For a TAG containing palmitic acid (C16:0), oleic acid (C18:1), and linoleic acid (C18:2), three DAG fragment ions corresponding to the loss of each chain will be observed in the MS/MS spectrum. The relative abundances of these fragments provide information about the sn-positional distribution, as the sn-2 chain is lost more readily than sn-1 or sn-3 chains. For quantitative analysis, the most abundant MRM transition (precursor [M+NH4]+ to the most abundant DAG fragment) is used as the quantifier, and a second transition is monitored as the qualifier for identity confirmation. Targeted lipidomics services typically deploy scheduled MRM methods with 100-300 transitions for comprehensive TAG quantification in a single 20-minute injection.
Pseudotargeted and DIA-Based Approaches
Pseudotargeted TAG analysis, introduced in a 2025 Analytica Chimica Acta study, combines the coverage of untargeted lipidomics acquisition with the quantitative precision of targeted MRM. The workflow uses a data-independent acquisition (DIA) method that fragments all precursor ions within sequential 10-Da windows across the m/z range 400-1000, generating comprehensive MS/MS spectra for every detectable TAG species. The MS/MS data are then processed using the DIATAGeR software tool (also published in 2025), which annotates each TAG spectrum by matching the observed DAG fragment masses against a theoretical TAG library containing over 50,000 possible fatty acyl chain combinations. In a benchmark test using NIST SRM 1950 human plasma standard, the pseudotargeted DIA approach identified 214 TAG species compared to 167 by conventional targeted MRM, and the quantitative precision (median CV 11%) was comparable to MRM for TAG species present above 1 nanomole per milliliter.
The pseudotargeted approach offers particular advantages for discovery-oriented studies where the TAG species of interest are not known in advance. In a conventional targeted MRM workflow, the method must be designed before data acquisition begins, and any TAG species not included in the MRM list will be missed. The DIA-based pseudotargeted workflow records fragmentation data for all detectable precursors, allowing the researcher to expand the TAG annotation list after acquisition if new biological questions emerge. The trade-off is that DIA data files are approximately 5-10 times larger than MRM data files, requiring proportionally more data storage and processing time. For studies with fewer than 50 samples where comprehensive TAG discovery is the primary goal, the pseudotargeted DIA approach is recommended. For studies with more than 200 samples where the TAG species of interest are well-defined, targeted MRM provides superior throughput and data processing efficiency.
Figure 3: TAG Species LC-MS Separation and MRM Transition Layout
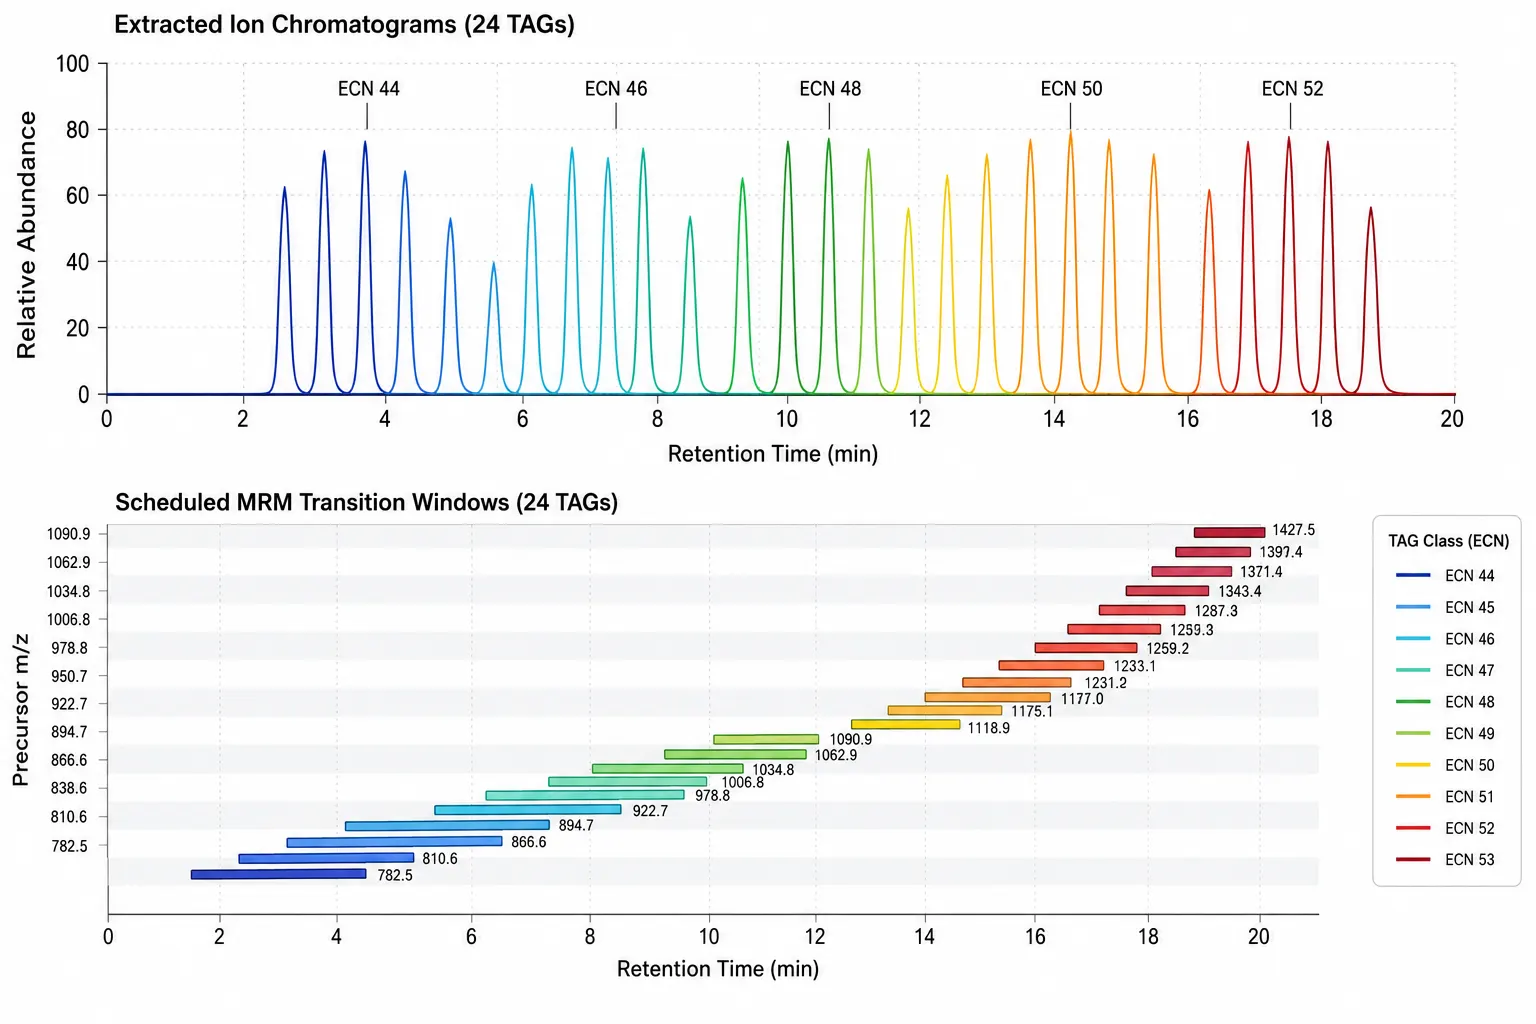 Overlaid extracted ion chromatograms for 24 TAG species across the LC gradient, with scheduled MRM transition windows annotated by retention time and precursor ion m/z.
Data Processing and Lipid Annotation
TAG annotation from LC-MS data requires matching the observed precursor mass and MS/MS fragment spectrum to a lipid database. The lipid classification system defines each TAG by its total carbon number and total double bond count (e.g., TAG 50:1), and optionally by its specific fatty acyl composition (e.g., TAG 16:0/16:1/18:0) when MS/MS data support chain-level assignment. LipidMaps is the primary reference database, providing theoretical m/z values for over 40,000 TAG species across mammalian, plant, and microbial species. MS-DIAL is the most widely used open-source software for TAG annotation from DIA data, incorporating retention time prediction, MS/MS spectral matching, and isotopic pattern filtering into an automated pipeline. For targeted MRM data, the annotation is straightforward because each MRM transition is designed for a specific TAG species; the challenge is peak integration consistency across large batches, which requires automated peak picking algorithms with manual review of integration quality for low-abundance species. Normalization is essential before comparing TAG profiles across samples: normalization to the internal standard corrects for extraction and injection variation, while normalization to total TAG signal (the sum of all identified TAG peak areas) corrects for differences in total lipid content between samples and reveals relative changes in TAG composition independent of concentration differences. A commonly used normalization strategy for large-scale TAG profiling studies is probabilistic quotient normalization (PQN), which calculates the median fold-change across all detected TAG species relative to a reference sample and uses this value to scale each sample, effectively removing dilution effects unrelated to biological variation. For longitudinal studies where samples are analyzed across multiple batches, batch correction using QC sample-based LOESS regression or the ComBat algorithm removes systematic drift in TAG signal intensities without distorting biological differences between groups. The choice of normalization method can significantly affect the final biological interpretation; comparing PQN, total area normalization, and internal standard normalization on the same dataset often yields different lists of significantly changed TAG species. The normalization strategy should therefore be pre-registered in the study plan rather than selected post hoc.
Quality Control and Method Validation
TAG analysis presents specific QC challenges that differ from those of other lipid classes. The wide dynamic range of TAG concentrations across sample types (plasma contains micromolar to millimolar TAG levels, while cell extracts may contain nanomolar levels) requires the calibration curve to span at least four orders of magnitude. The NIST SRM 1950 human plasma standard reference material provides certified concentrations for 30 TAG species and is the recommended QC material for TAG analysis methods. A pooled QC sample injected at regular intervals (every 10 injections) monitors retention time stability, signal intensity drift, and carryover. For TAG analysis specifically, carryover between injections is a persistent problem because highly hydrophobic long-chain TAG species (C56-C60) adsorb to the LC column and slowly elute during subsequent injections. A blank injection (isopropanol) after every five sample injections, with the blank data inspected for the presence of TAG peaks above 5% of the previous sample's signal, is the recommended carryover monitoring strategy. Mammalian lipidomics profiling requires rigorous standardization. Method validation parameters for TAG analysis should include linearity assessment across the expected concentration range (typically 0.01-100 nanomole per milliliter for plasma TAG species), accuracy determined by spike-recovery experiments using purified TAG standards added to the matrix before extraction (acceptable recovery range 80-120%), and precision evaluated by replicate analysis of a pooled QC sample (RSD below 20% for individual TAG species, below 15% for total TAG quantification). The limit of detection for individual TAG species by LC-MS/MS is typically 0.01-0.1 nanomole per milliliter, depending on the ionization efficiency of the specific fatty acyl chain composition. Lipidomics pathway analysis services incorporate these validation and QC protocols to ensure data quality across large-scale studies.
Applications in Metabolism Research
TAG profiling provides the quantitative foundation for studying lipid metabolism in cellular and animal models. In dietary intervention studies, TAG fatty acyl chain composition directly reflects the dietary fatty acid intake: feeding mice a diet enriched in C18:2 (linoleic acid) produces a measurable increase in TAG species containing C18:2 within 3-7 days, and the rate of incorporation differs between tissues (liver incorporates dietary fatty acids into TAG within 24 hours, while adipose tissue requires 5-7 days). In cell culture models, including exosome lipidomics applications, 13C-labeled glucose or fatty acid tracers are used to track de novo lipogenesis: incorporation of 13C into newly synthesized TAG species can be quantified by the shift in the precursor ion mass, enabling calculation of the fractional synthesis rate for individual TAG species. Hepatic TAG accumulation in non-alcoholic fatty liver disease models is the most widely studied application, where changes in the TAG species profile (increases in C16:0 and C18:1-containing species, decreases in C20:4 and C22:6-containing species) precede histological changes and serve as early biomarkers of metabolic stress. All studies described are conducted in research model systems and are not intended for clinical or diagnostic use. An important experimental design consideration for TAG metabolism studies is the choice of fasting versus fed state for sample collection. In animal models, plasma TAG levels and composition change significantly within 2-4 hours of feeding, with a marked increase in TAG species containing dietary fatty acids. Standardizing the fasting period (typically 6-12 hours for mice) before sample collection reduces this variability. For cell culture experiments, replacing fetal bovine serum with delipidated serum or defined fatty acid-albumin complexes for 24-48 hours before treatment creates a controlled lipid background. Fatty acid metabolism analysis services provide the analytical infrastructure for these types of metabolic labeling and profiling studies.
Figure 4: Triglyceride Metabolism Research Experimental Design Framework
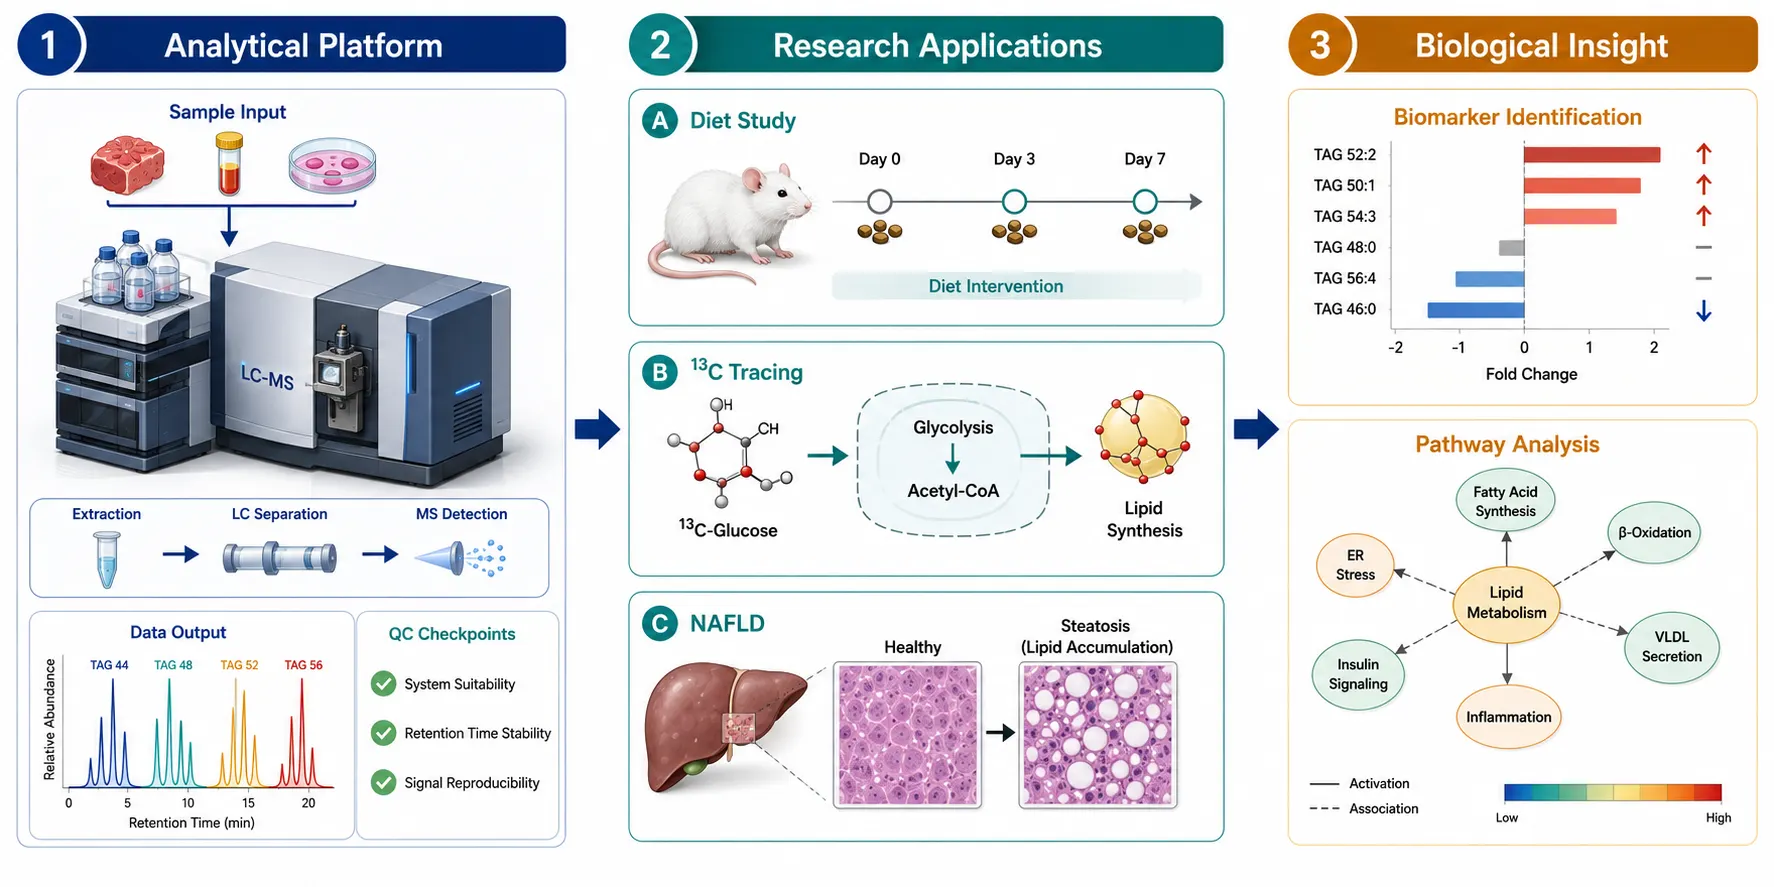 Integrated workflow connecting TAG profiling methodology with downstream research applications in dietary intervention studies, 13C tracing, and NAFLD biomarker discovery.
Frequently Asked Questions
What is the difference between total triglyceride measurement and fatty acyl chain profiling?
Total triglyceride measurement using enzymatic assays reports a single concentration value without distinguishing individual TAG species. Fatty acyl chain profiling by LC-MS resolves hundreds of individual TAG species and quantifies each separately, providing information about which fatty acids are esterified in the TAG pool.
Which lipid extraction method gives the best recovery for triglycerides?
Folch extraction provides the highest TAG recovery (greater than 95%) but requires chloroform handling and longer processing time. MTBE extraction recovers 93-97% of Folch recovery with higher throughput and simpler phase separation. BUME extraction is not recommended for TAG analysis due to lower recovery for polyunsaturated species.
What internal standards are recommended for quantitative TAG analysis?
TAG 15:0/15:0/15:0 (tripentadecanoin) or TAG 17:0/17:0/17:0 (triheptadecanoin) are the preferred internal standards because their acyl chains are not endogenously present in mammalian samples. The internal standard is added before extraction at 10-50 micrograms per sample.
How do I choose between LC-MS and GC-MS for fatty acid composition analysis?
LC-MS analyzes intact TAG molecules and reports the fatty acyl chain composition of individual TAG species. GC-MS requires hydrolysis of TAGs to free fatty acids followed by derivatization, reporting the total fatty acid composition without linkage information. LC-MS is preferred when TAG species-level information is needed; GC-MS is sufficient for total fatty acid profiling.
References
- Sarafian MH, Gaudin M, Lewis MR, et al. Evaluation of Lipid Extraction Protocols for Untargeted Lipidomics. Metabolites. 2023;13(9):1002. doi:10.3390/metabo13091002
- Sokol E, Ulmer CZ, Gao Y, et al. Recent Analytical Methodologies in Lipid Analysis. Int J Mol Sci. 2024;25(4):2249. doi:10.3390/ijms25042249
- Kofronova M, Cizkova A, Jirasko R, et al. The MALDI Method to Analyze the Lipid Profile, Including Triacylglycerols. Curr Issues Mol Biol. 2026;48(1):59. doi:10.3390/cimb48010059
- Cajka T, Hricko J, Rudi Kulhava L, et al. A Critical Overview of HPLC-MS-Based Lipidomics in Food and Nutrition Research. Foods. 2023;12(17):3177. doi:10.3390/foods12173177
- Zullig T, Kofeler HC. Current status and advances in untargeted LC-MS tissue lipidomics. Metabolites. 2023;13(12):1178. doi:10.3390/metabo13121178















