Triglyceride Analysis Service
Creative Proteomics offers triglyceride analysis using advanced LC-MS/MS technology, delivering precise quantification and comprehensive profiling of TG species. Our solutions are designed to support lipid metabolism studies, metabolic flux tracking, and bioprocess optimization.
Key Benefits
- Precise Triglyceride Species Quantification
- Comprehensive Lipid Subclass Profiling
- Advanced Isomer Separation
- Stable Isotope Tracing for Metabolic Flux Analysis
- Bioprocess Monitoring for Optimal Production
Submit Your Request Now
×
What You Will Receive
- Raw Data Files: Proprietary instrument formats (.raw, .wiff) plus open-standard .mzML files.
- Processed Data Tables: Annotated triglyceride species with absolute and relative quant values.
- Statistical Visuals: Heatmaps, PCA, volcano plots, and saturation distribution charts.
- Interpretive Report: Lipid class summaries, pathway mapping, QC performance, and expert insights.
- What We Provide
- Advantages
- Technology Platform
- Sample Requirement
- Demo
- FAQs
What are Triglycerides?
Triglycerides (TGs), also known as triacylglycerols, are the major form of energy storage in cells and a key component of lipid droplets. In research and bioproduction systems, TG levels and composition provide a direct readout of lipid metabolism status, including de novo lipogenesis, fatty acid utilization, and lipid storage dynamics.
Changes in the carbon chain length and degree of unsaturation of TG molecules reflect shifts in substrate availability, enzymatic activity (e.g., DGAT, ATGL), and cell-state–specific remodeling. Accurate profiling of TGs enables:
- Lipid metabolism monitoring in models of obesity, insulin resistance, NASH, or thermogenesis.
- Assessment of lipid flux under nutrient stress, drug treatment, or genetic perturbation.
- Quality control in cell culture systems, where TG accumulation may indicate metabolic drift or stress adaptation.
- Bioprocess optimization, especially in microbial or algal oil production pipelines, where TG yield and composition are key performance indicators.
In short, TG profiling bridges molecular mechanism and functional phenotype, providing measurable insights into both health-related and industrial lipid pathways. Our advanced LC-MS/MS platform allows confident, species-level triglyceride quantification across biological and engineered systems.
What Problems We Solve for Our Clients
- Low detectability of hydrophobic TGs: Orthogonal LC (C30 RP; APCI/ESI+) and isotope-labeled internal standards boost sensitivity and correct matrix effects.
- Isobaric and isomeric interference: C30 selectivity and species-specific MRM/HRAM confirmation separate close neighbors (e.g., TG 52:2 positional isomers).
- Batch effects and drift: Pooled-QC insertion, isotopic normalization, and LOESS drift correction stabilize long runs.
- Inconsistent reporting formats: Delivery includes species tables, subclass sums, and publication-ready visuals aligned to your experimental design.
- Cross-matrix comparability: Harmonized extraction and recovery checks enable side-by-side comparisons across plasma, tissues, cells, media, and oils.
Creative Proteomics Triglyceride Analysis—What We Offer
- Targeted TG panel (up to 800+ species): Species-level quantitation (e.g., TG 52:2; TG 18:1/18:1/16:0) with isotope dilution.
- Subclass profiling: Carbon:double-bond sums (e.g., TG(48:2), TG(50:1)…), saturation indices, chain-length distributions.
- Isomer-aware separation: C30 reversed-phase LC for regioisomer resolution where feasible.
- Extended neutral lipid panel (optional): DG, MG, cholesterol esters, and free fatty acids to contextualize TG dynamics.
- Stable-isotope tracing (optional): 13C-glycerol, 13C-acetate, or 13C-palmitate incorporation into TG for flux readouts.
- Lipid droplet and organelle fractions (optional): TG quant after subcellular isolation.
- Bioprocess monitoring: TG content and composition in culture supernatants, cell pellets, and oil phases.
- Custom method development: Matrix-specific calibration, recovery experiments, and additional targets on request.
List of Triglyceride Analyses and Detectable Analytes
| Analysis Module | Representative Detectable Analytes | Reporting Format | Typical LOQ* | Notes |
|---|---|---|---|---|
| Species-resolved TG (targeted LC-MS/MS) | TG 46:0, TG 48:1, TG 50:2, TG 52:2, TG 54:3, TG 56:5, TG 58:9, TG 60:11; examples include: TG 18:0/18:1/18:2, TG 16:0/18:2/20:4 | Absolute (nmol/mL, nmol/g), Relative (%) | 5–20 ng/mL | Isotope dilution; chain-specific internal standards |
| TG subclass profiling (sum by chain length & unsaturation) | TG(48:0–48:6), TG(50:0–50:7), TG(52:0–52:8), TG(54:0–54:9), TG(56:0–56:10) | mol% of total TG or absolute | N/A | Useful for pathway-level interpretation |
| Saturated / MUFA / PUFA TG | TGs containing 0, 1, ≥2 double bonds (e.g., TG(54:0), TG(54:1), TG(54:6)) | Grouped by saturation class | — | Indicates oxidative potential or dietary/lipid source |
| TG regioisomers (optional) | TG 18:1/18:1/16:0 vs. 18:1/16:0/18:1, TG 18:2/18:2/16:0, etc. | Species-level with partial isomer resolution | Matrix-dependent | C30 LC required; not all regioisomers separable |
| Diacylglycerols (DG) | DG 32:0, 34:1, 36:2, 38:4 (e.g., 18:1/18:1, 18:2/20:4) | nmol/mL, % of neutral lipids | 2–10 ng/mL | Precursor/product in TG metabolism |
| Monoacylglycerols (MG) | MG 16:0, 18:1, 18:2 | nmol/mL | ~5 ng/mL | Often trace-level; useful in hydrolysis studies |
| Cholesteryl Esters (CE) | CE 16:0, 18:2, 20:4, 22:6 | nmol/mL | ~10 ng/mL | Part of extended neutral lipid panel |
| Free Fatty Acids (FFA) | FFA 14:0 to 24:6 (e.g., palmitate, oleate, linoleate, DHA) | nmol/mL or µmol/L | ~5–10 ng/mL | Important for interpreting lipid turnover |
| Stable isotope–labeled TG (optional) | 13C- or 2H-labeled TGs: e.g., TG(18:1/18:1/16:0)+M+2, M+3… | Atom% excess or % labeled fraction | — | Requires tracer setup; ideal for metabolic flux studies |
| Lipid droplet–associated TG | Same TG panel as above, quantified in LD fractions | nmol per fraction | As above | Enriched from organelles or density gradient |
*LOQ = Limit of Quantification; depends on matrix, ionization, and species. All values determined during method setup.
Advantages of Our Triglyceride Analysis Services
- Sensitivity: LOQ as low as 5–20 ng/mL for many TG species (biofluids).
- Linearity: Dynamic range ≥4–5 orders of magnitude with R² ≥ 0.995.
- Precision: Intra-run CV ≤10%, inter-run CV ≤15% for representative species.
- Mass accuracy (HRAM mode): ≤3 ppm with internal lock-mass.
- Retention-time stability: Median RT drift ≤0.15 min with RT alignment.
- Recovery: Spike-recovery typically 85–110%, matrix-specific.
- Carryover control: ≤0.1% with strong-wash and randomized sequences.
- QC architecture: Pooled-QC every ~10 injections, isotopic normalization, LOESS correction, and system-suitability checkpoints.
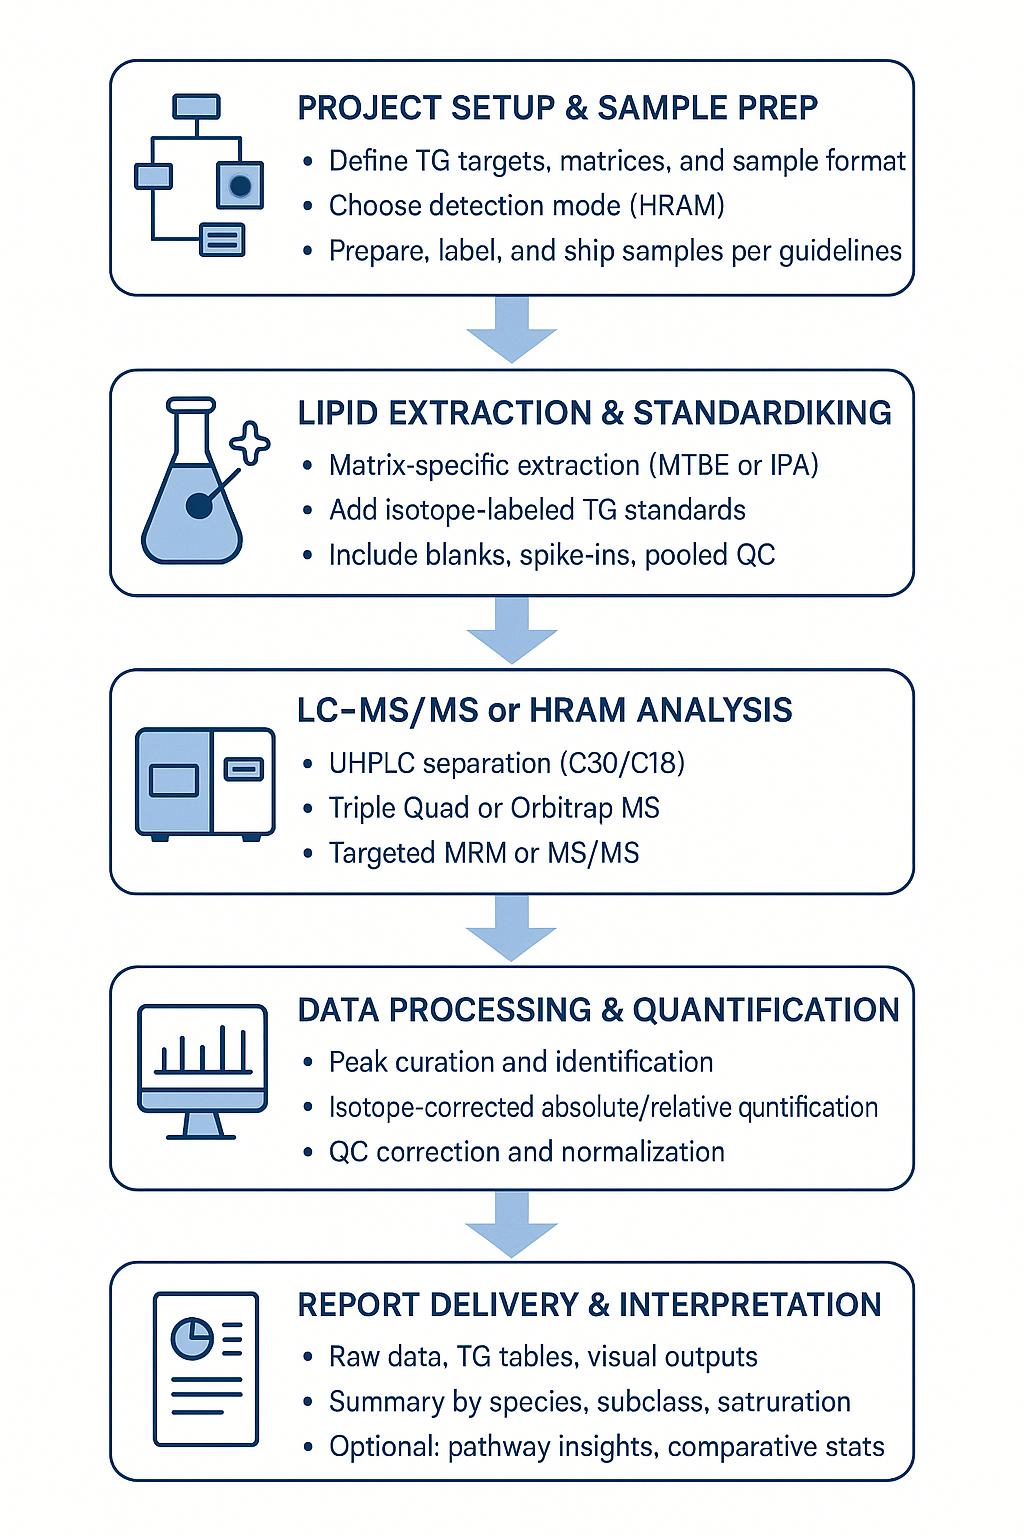
Workflow for Triglyceride Analysis Service
1. Consultation & design → Define matrices, targets, and reporting structure.
2. Method setup → Matrix-matched calibration, internal standard selection, and QC plan.
3. Extraction & acquisition → Harmonized lipid extraction; LC-APCI/ESI-MS with QC-guided sequences.
4. Identification & quantitation → Species confirmation (MS/MS or HRAM), absolute/relative quant with correction factors.
5. QC review & normalization → Precision checks, drift correction, outlier handling.
6. Delivery & debrief → Structured data tables, subclass summaries, publication-quality visuals, and interpretation guidance.
Technology Platform for Triglyceride Analysis Service
Chromatography
UHPLC systems: Thermo Scientific™ Vanquish™, Agilent 1290 Infinity II, Waters ACQUITY UPLC I-Class.
Columns: C30 RP (e.g., 150 × 2.1 mm, 2.6 µm) for TG isomer resolution; C18 RP for high-throughput panels.
Mobile phases: A—ACN/H2O with 10 mM ammonium formate; B—IPA/ACN with 10 mM ammonium formate.
Flow & program (typical): 0.25–0.35 mL/min; 45–95% B gradient, total 20–35 min depending on matrix.
Column temp: 45–55 °C; autosampler 4–10 °C.
Ionization & MS acquisition
Sources: APCI(+) for nonpolar TGs; ESI(+) for broad lipid panels.
Key source settings (typical): Vaporizer 380–420 °C (APCI); capillary 300–350 °C; spray 3.2–3.8 kV (ESI); sheath/aux gas per platform.
High-resolution MS (HRAM) options: Thermo Q Exactive™ Plus/HF Orbitrap™; resolving power 70k–120k (m/z 200).
Triple-quad options: Agilent 6495C.
Acquisition modes:
- Targeted MRM for TG [M+NH4]+ with fatty-acid neutral losses (RCOOH/RCOONH4).
- HRAM full-scan with data-dependent MS/MS for identity confirmation.
- Polarity: positive mode primary; negative screening optional for complementary classes.
Agilent 1260 Infinity II HPLC (Fig from Agilent)
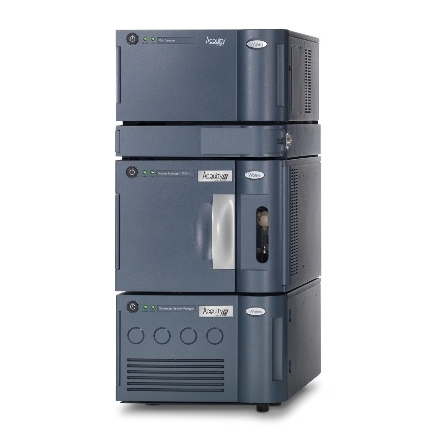
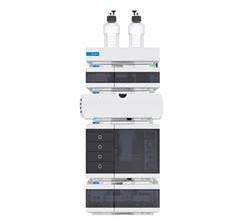
Waters ACQUITY UPLC System
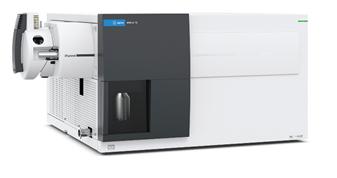
Agilent 6495C Triple Quadrupole (Figure from Agilent)
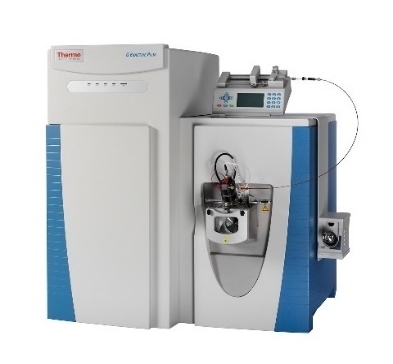
Thermo Fisher Q Exactive (Figure from Thermo Fisher)
Sample Requirements for Triglyceride Analysis Service
| Matrix | Recommended Amount | Container | Stabilization | Storage & Shipping |
|---|---|---|---|---|
| Human/animal plasma or serum | ≥ 50–100 µL | Low-bind screw-cap tube | No detergents/chaotropes; note anticoagulant | Store ≤ −80 °C; ship on dry ice |
| Tissue (liver, adipose, muscle, etc.) | 20–30 mg wet weight | Pre-weighed cryovial | Rinse to remove blood if needed; snap-freeze | Store ≤ −80 °C; ship on dry ice |
| Cell pellets | ≥ 5 × 10^5 cells | Low-bind tube | Wash PBS (no Mg^2+/Ca^2+), remove media completely | Store ≤ −80 °C; ship on dry ice |
| Culture media / supernatant | ≥ 200 µL | Low-bind tube | Clarify by quick spin; avoid phenol red if possible | Store ≤ −80 °C; ship on dry ice |
| Oils/bioprocess samples | ≥ 50 µL | Glass vial with PTFE-lined cap | Provide composition info if blends | Store 4 °C (short) or ≤ −20 °C; ship cold |
| Isotope-tracing samples (optional) | As above | As matrix-appropriate | Document tracer, dose, and labeling scheme | Match storage to matrix |
Demo Results
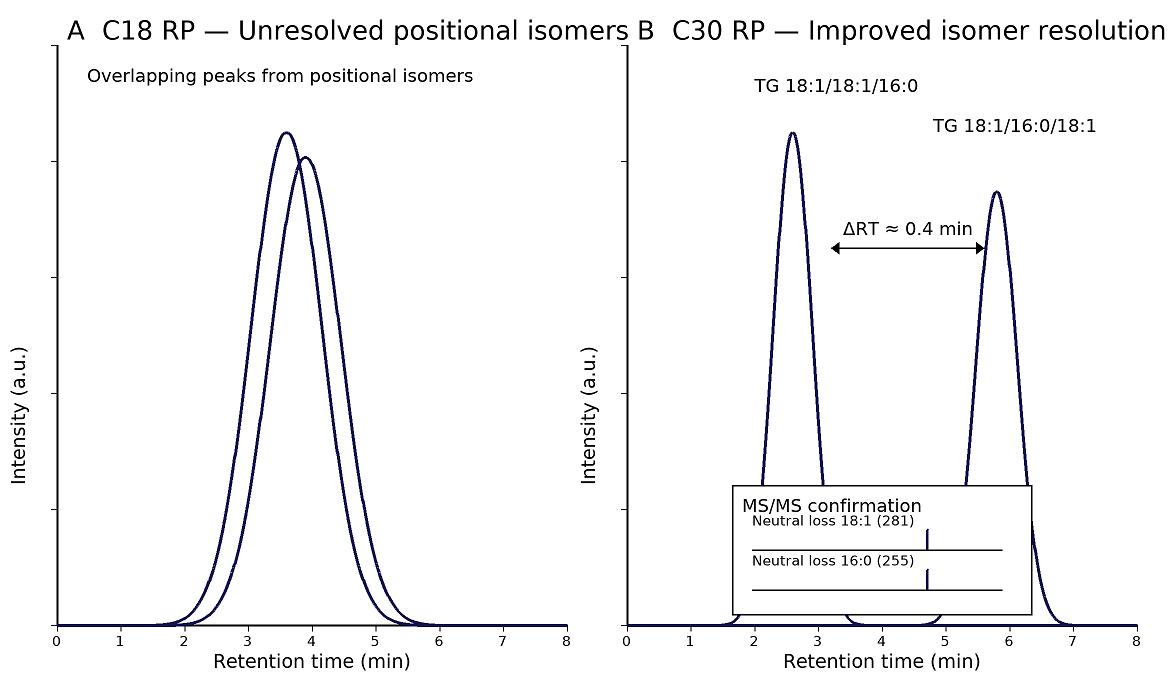
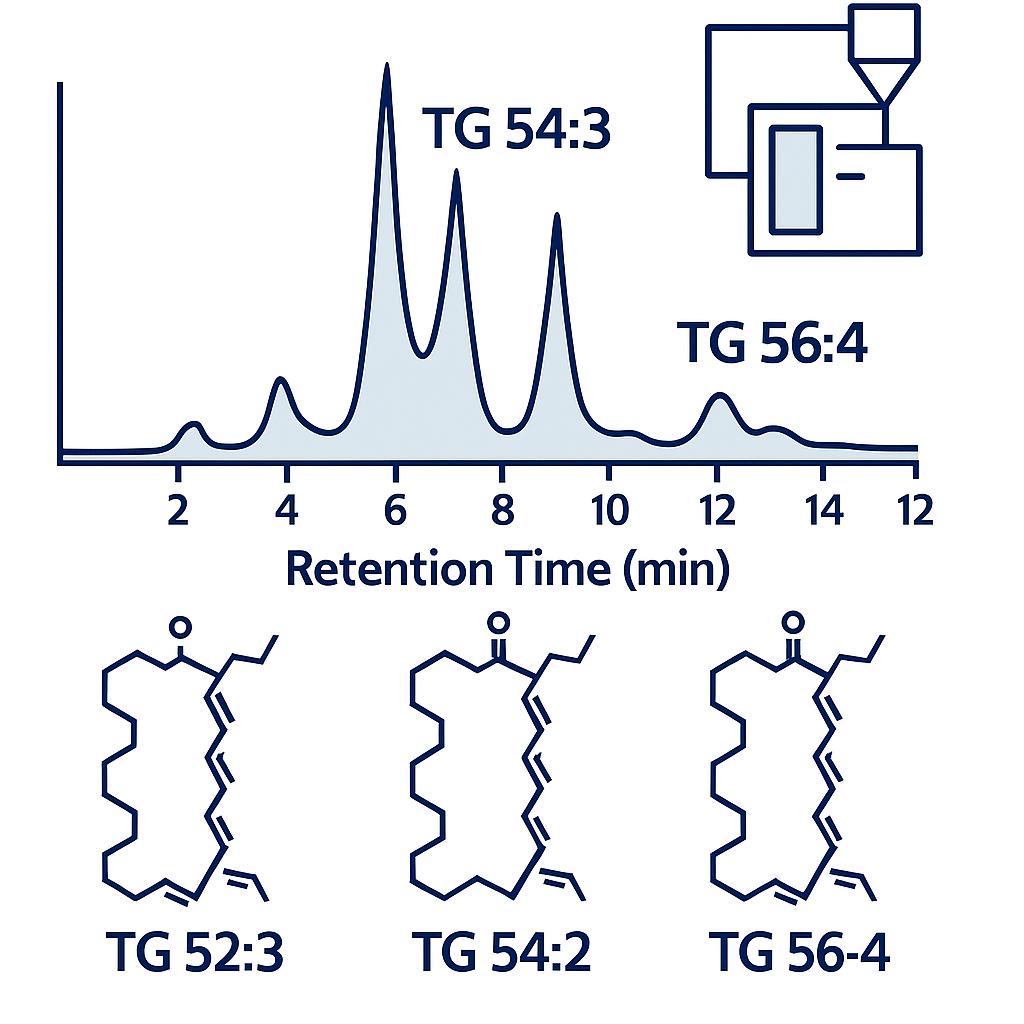
LC–MS/MS chromatograms showing unresolved TG isomers on C18 RP versus clear baseline separation on C30 RP, with MS/MS confirmation.
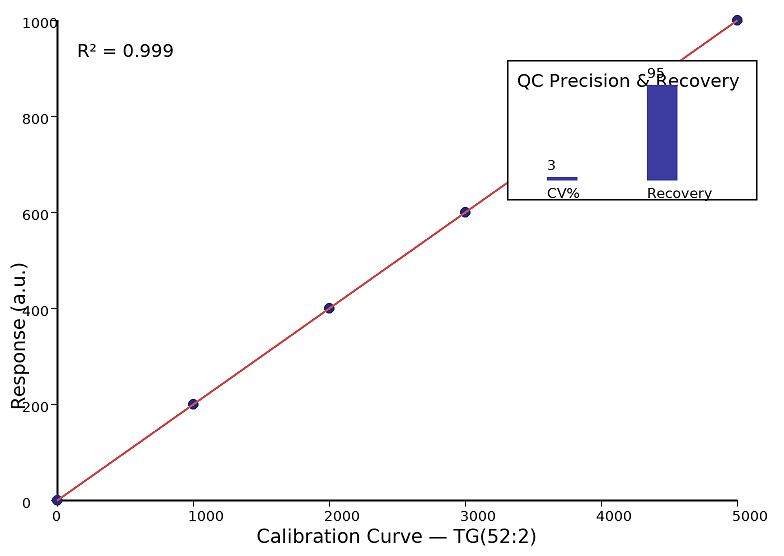
Calibration curve for TG(52:2) with R² = 0.999; inset shows QC precision (CV ≤ 3%) and recovery (~95%).
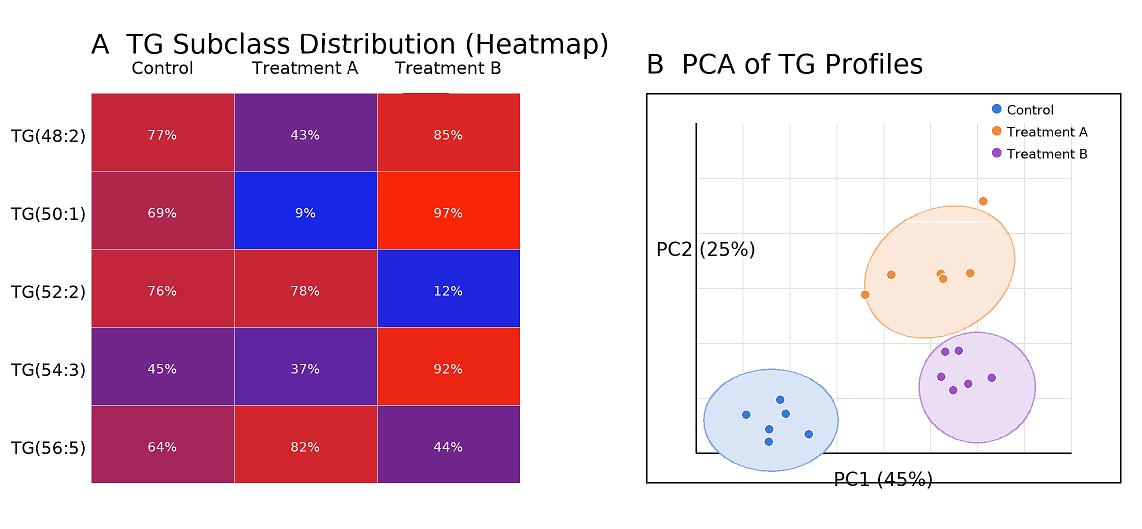
TG subclass profiling across groups. Panel A: heatmap of TG(48:2–56:5). Panel B: PCA showing clear group separation.
FAQ of Triglyceride Analysis Service
How does triglyceride isomer resolution contribute to mechanistic lipid studies?
Distinguishing positional isomers uncovers enzyme-specific activity (e.g., DGAT vs. ATGL), allowing researchers to connect TG remodeling patterns with regulatory pathways.
Why is isotope tracing often integrated into triglyceride analysis?
Stable isotope tracers (e.g., ¹³C-glycerol, ¹³C-palmitate) reveal dynamic flux into TG pools, enabling precise quantification of lipid synthesis, turnover, and channeling under different conditions.
Why analyze triglyceride subclasses instead of only total triglycerides?
Subclass resolution provides pathway-level insight, showing shifts in chain length and saturation that total measurements cannot capture.
Can triglyceride data improve bioprocess monitoring?
Yes. TG content and composition act as indicators of culture stability, metabolic drift, or optimization efficiency in microbial and algal systems.
What makes triglyceride analysis valuable compared to general lipidomics?
It provides targeted sensitivity and isomer resolution, ensuring accurate quantification of neutral lipids critical to both biomedical and industrial research.
What advantages does triglyceride profiling bring to systems biology approaches?
TG data integrates with metabolomics and proteomics to map energy storage and lipid flux, supporting multi-omics interpretation of metabolic reprogramming.
How can triglyceride subclass profiling inform nutritional or pharmacological interventions?
Chain length and saturation patterns reflect substrate supply and oxidative demand, providing markers to evaluate the biochemical impact of diets, supplements, or therapeutic agents.
In what ways does triglyceride quantification enhance bioprocess optimization?
Measuring TG yield and composition informs feed strategy, stress response, and oil productivity in microbial or algal systems, guiding scale-up and product consistency.
How do QC strategies ensure reliability in triglyceride datasets?
Inclusion of isotope-labeled standards, pooled-QC injections, and drift correction algorithms stabilize large runs, ensuring reproducible and comparable TG quantification across cohorts.
Learn about other Q&A about proteomics technology.
Publications
Here are some of the lipidomics-related papers published by our clients:

- White matter lipid alterations during aging in the rhesus monkey brain. 2024.
- Characterization of Dnajc12 knockout mice, a model of hypodopaminergia. 2024.
- Annexin A2 modulates phospholipid membrane composition upstream of Arp2 to control angiogenic sprout initiation. 2023.
- Lipid Membrane Engineering for Biotechnology (Doctoral dissertation, Aston University). 2023.
- Summative and ultimate analysis of live leaves from southern US forest plants for use in fire modeling. 2020.