Adenosine Diphosphate (ADP) Analysis Service
Creative Proteomics offers high-sensitivity ADP quantification using advanced LC-MS/MS technology to support energy metabolism, mitochondrial function, and purine pathway analysis.
We help you:
- Accurately quantify ADP, ATP, and AMP in cells, tissues, and biofluids
- Detect metabolic imbalances and bioenergetic shifts in physiological and pathological states
- Evaluate mitochondrial activity and drug-induced changes in energy homeostasis
- Generate high-quality, reproducible data for biochemical, pharmaceutical, or clinical research
Empower your research with precise, targeted insights into cellular energy dynamics.
Submit Your Request Now
×
What You Will Receive
- Absolute ADP/ATP/AMP quantification
- Linearity R² > 0.999 across 5 logs
- Detection limit: 5 nM
- Multiplex ≥15 metabolites/run
- Sample volume: as low as 50 µL
- Custom pathway and ratio reporting
- What We Provide
- Advantages
- Technology Platform
- Sample Requirements
- Demo
- FAQs
- Case Study
What Is Adenosine Diphosphate?
Adenosine diphosphate (ADP) is a pivotal intermediate in nucleotide metabolism, energy transfer, and signal transduction. Formed via ATP hydrolysis or AMP phosphorylation, ADP plays a critical role in cellular respiration, glycolysis, oxidative phosphorylation, and platelet aggregation. The ADP/ATP ratio is a core indicator of intracellular energy status, while ADP's conversion to ATP underlies mitochondrial efficiency and metabolic adaptation.
Due to its rapid turnover, low abundance, and high polarity, accurate ADP quantification requires sensitive, validated analytical methods—especially in time-sensitive or disease-related studies involving ischemia, cancer metabolism, cardiovascular dysfunction, or mitochondrial pathologies.
Why Quantitative ADP Analysis Matters
Quantifying ADP is essential for elucidating:
- Mitochondrial function and ATP regeneration capacity
- Energy stress responses via AMPK signaling
- Platelet activation pathways in coagulation studies
- Glycolytic and oxidative phosphorylation fluxes
- Purine metabolism disorders and metabolic syndrome
- Pharmacodynamic monitoring of metabolic drugs or toxins
ADP analysis provides valuable insight into bioenergetic flux, cell viability, metabolic plasticity, and therapeutic efficacy in drug discovery, systems biology, and disease modeling.
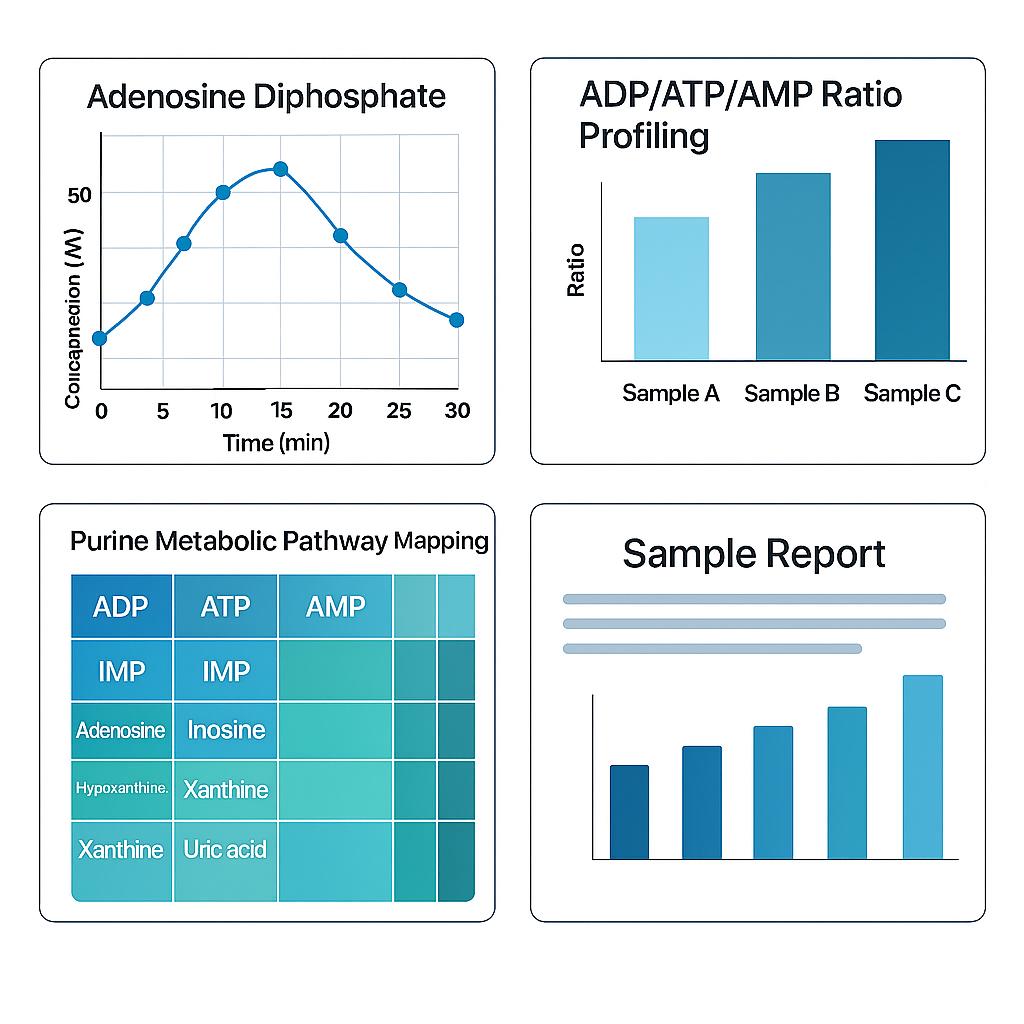
ADP Analysis Service Offered by Creative Proteomics
- Absolute Quantification of ADP: Using isotope dilution LC-MS/MS for highly accurate measurement of ADP in plasma, CSF, tissue, cells, and microbial samples.
- ADP/ATP/AMP Ratio Profiling: Simultaneous quantification of adenine nucleotides to evaluate cellular energy charge and metabolic state.
- Expanded Nucleotide Panel Analysis: Detection of related compounds including GDP, GTP, NAD⁺, FAD, and others to assess broader purine and energy metabolism.
- Purine Metabolic Pathway Mapping: Integrated analysis of upstream and downstream metabolites (e.g., hypoxanthine, inosine, xanthine) to study nucleotide turnover and degradation.
- Custom Targeted Metabolomics Panels: Tailored assays for disease models, drug treatment studies, or organism-specific energy metabolism investigations.
- Time-Course or Dose-Response Studies: Designed for kinetic evaluations, pharmacodynamic tracking, and metabolic shift monitoring under controlled conditions.
- High-Throughput Screening Format (Optional): Compatible with 96- or 384-well plate formats for large-scale studies or compound screening programs.
List of Detected ADP and Related Metabolites
| Analyte Name | Metabolic Pathway | Biological Role / Significance |
|---|---|---|
| ADP (Adenosine Diphosphate) | Purine metabolism, energy metabolism | ATP precursor; key indicator of energy status |
| ATP (Adenosine Triphosphate) | Energy metabolism | Primary cellular energy currency |
| AMP (Adenosine Monophosphate) | Purine salvage, AMPK signaling | Activates AMPK; reflects cellular energy depletion |
| GDP (Guanosine Diphosphate) | GTP cycle, signal transduction | GTP precursor; involved in G-protein signaling |
| GTP (Guanosine Triphosphate) | Translation, cytoskeleton regulation | Required for ribosomal and microtubule function |
| cAMP (Cyclic AMP) | Second messenger signaling | Intracellular signal transduction molecule |
| NAD⁺ (Nicotinamide Adenine Dinucleotide) | Redox metabolism, TCA cycle | Oxidized form; electron carrier in catabolic reactions |
| NADH | Redox metabolism, electron transport | Reduced form; donates electrons to ETC |
| FAD (Flavin Adenine Dinucleotide) | Oxidative phosphorylation | Electron acceptor in mitochondrial metabolism |
| FADH₂ | Electron transport chain | Reduced form; feeds electrons into ETC |
| Phosphocreatine | Energy buffering (CK system) | Supports rapid ATP regeneration in muscle and brain |
| Hypoxanthine | Purine degradation | ADP/AMP catabolite; marker of ischemia and energy crisis |
| Inosine | Purine salvage | Downstream AMP degradation product |
| Xanthine | Purine degradation | Terminal intermediate before uric acid formation |
| Uric Acid | Purine degradation | End-product of purine catabolism in humans |
| Pyruvate | Glycolysis | End-product of glycolysis; links to TCA cycle and fermentation |
| Lactate | Anaerobic metabolism | Elevated during hypoxia or glycolytic shift |
| Succinate | TCA cycle | Mitochondrial metabolite; modulator of immune signaling |
| Fumarate | TCA cycle | Intermediate connecting malate and succinate |
| Malate | TCA cycle | Links to oxaloacetate regeneration and malate-aspartate shuttle |
| Citrate | TCA cycle, lipid biosynthesis | Entry metabolite from acetyl-CoA; regulatory signal for glycolysis |
| Acetyl-CoA | Central carbon metabolism | Precursor for TCA cycle, lipid synthesis, histone acetylation |
| Creatine | Energy buffering | Substrate for creatine kinase system |
| Glucose-6-Phosphate | Glycolysis, pentose phosphate pathway | First committed step of glycolysis |
| Ribose-5-Phosphate | Nucleotide biosynthesis | Precursor for PRPP and purine base assembly |
| PRPP (Phosphoribosyl pyrophosphate) | Purine biosynthesis | Essential for de novo and salvage pathways of nucleotide synthesis |
Advantages of ADP Assay
- High Sensitivity: Detection limit as low as 5 nM for ADP in plasma and cell lysates using isotope-labeled internal standards.
- Excellent Precision: Intra- and inter-assay coefficient of variation (CV) maintained below 5%, ensuring data consistency across replicates.
- Minimal Sample Requirement: Full nucleotide panel analysis from as little as 50 µL of biofluid or 10 mg tissue sample.
- Broad Linear Range: Quantification validated over 4–5 orders of magnitude to accommodate low- and high-abundance metabolic states.
- Multiplex Capability: Simultaneous detection of 15+ nucleotides and energy metabolites in a single LC-MS/MS run, reducing sample consumption.
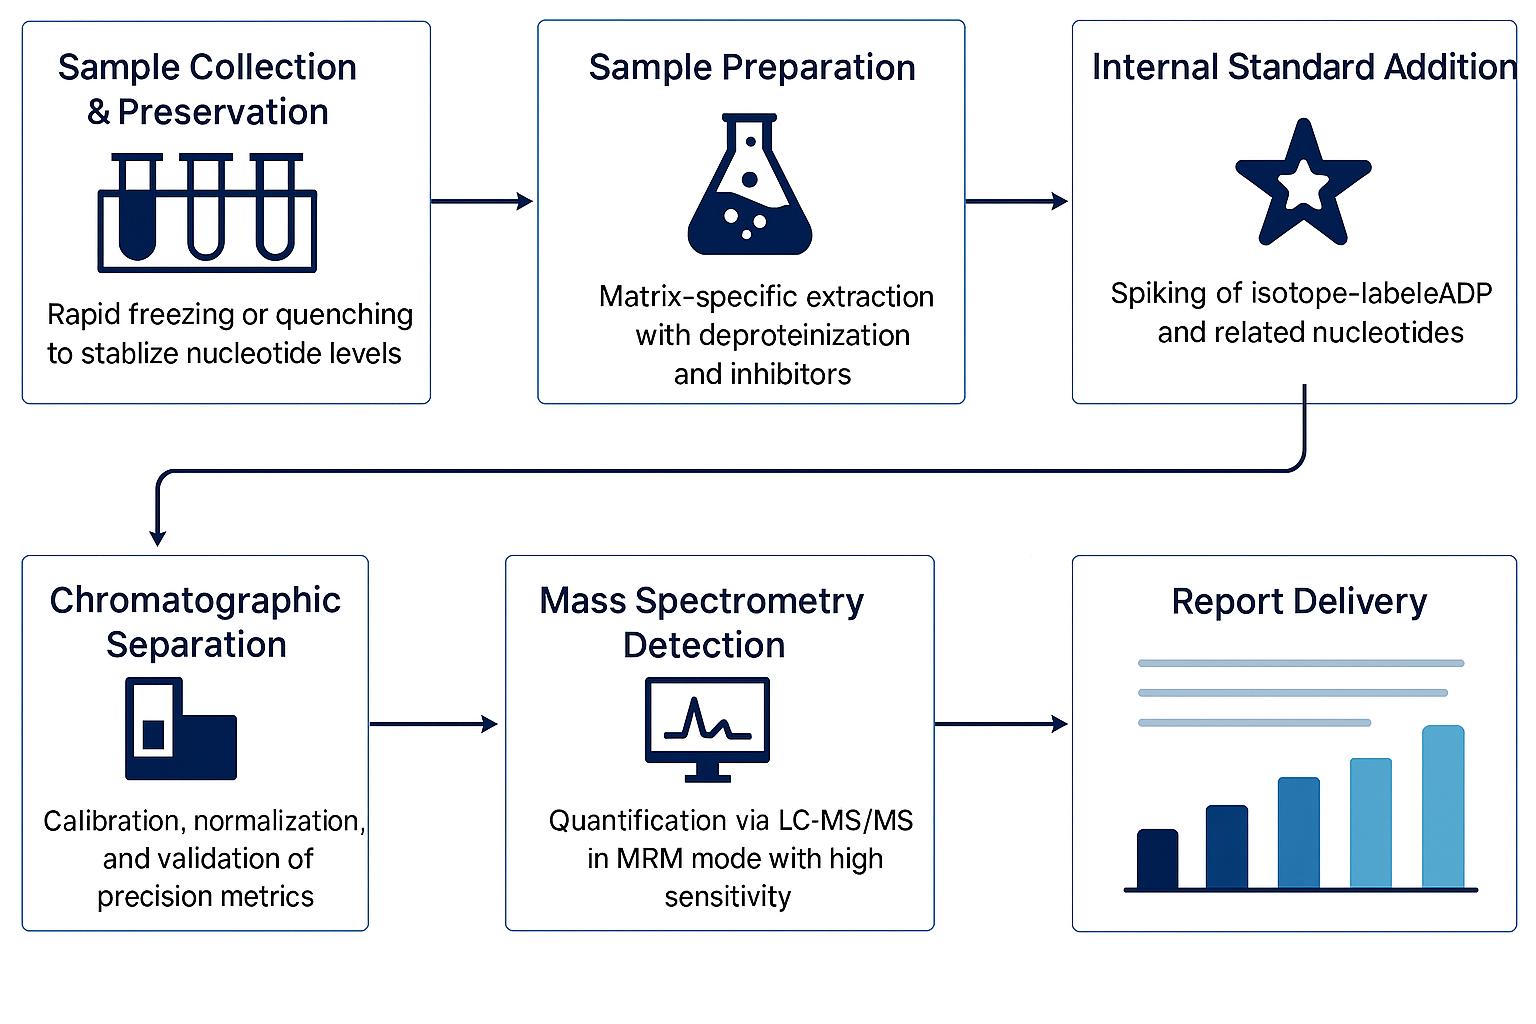
Workflow for ADP Analysis Service
Methods and Instrumentation for ADP Analysis
Agilent 6495C Triple Quadrupole LC-MS/MS: Enables ultra-trace quantification of ADP, ATP, and related metabolites with femtomole-level detection limits.
Agilent 7890B GC System with 5977A MSD: Suitable for derivatized nucleotide intermediates and purine degradation products with volatile or semi-volatile properties.
Agilent 1260 Infinity II HPLC: Offers robust chromatographic separation of polar nucleotides and energy metabolites prior to MS or UV detection.
Agilent 6495C Triple Quadrupole (Figure from Agilent)
Agilent 7890B-5977A (Figure from Agilent)
Agilent 1260 Infinity II HPLC (Fig from Agilent)
Sample Requirements for ADP Analysis Service
| Sample Type | Recommended Volume/Weight | Container | Storage Conditions | Notes | Sample Type |
|---|---|---|---|---|---|
| Plasma / Serum | ≥ 50 µL | 1.5 mL microcentrifuge tube | -80°C; avoid freeze–thaw cycles | Use EDTA anticoagulant; separate plasma within 1 hour of collection | Plasma / Serum |
| Whole Blood | ≥ 200 µL | EDTA tube | -80°C | Must be flash-frozen immediately; avoid hemolysis | Whole Blood |
| Tissue (Animal/Plant) | ≥ 10 mg (wet weight) | Cryotube or pre-weighed vial | Snap-frozen in liquid nitrogen | Provide tissue type and species; avoid delays in freezing | Tissue (Animal/Plant) |
| Cultured Cells | ≥ 1 × 10⁶ cells | Cryovial | -80°C | Pellet cells and wash in cold PBS prior to submission | Cultured Cells |
| CSF (Cerebrospinal Fluid) | ≥ 30 µL | 0.5 mL low-bind tube | -80°C | Handle carefully to avoid contamination or degradation | CSF (Cerebrospinal Fluid) |
| Microbial Biomass | ≥ 1 OD unit (wet pellet) | Sterile microcentrifuge tube | -80°C | Provide strain name and culture conditions if available | Microbial Biomass |
| Urine | ≥ 200 µL | 1.5 mL microcentrifuge tube | -80°C | First morning void preferred; avoid additives | Urine |
Demo Results

Representative MRM chromatograms of ADP (m/z 426 → 134), ATP (m/z 506 → 136), and AMP (m/z 346 → 134), showing clear peak separation and stable signal intensity.

Standard calibration curve for ADP showing excellent linearity (R² = 0.9997) across a 5-point concentration range.

Heatmap displaying relative ADP/ATP, ADP/AMP, and ATP/AMP ratios across five samples under Control and Condition A groups.
FAQ of ADP Analysis Service
Can ADP analysis be performed on frozen archived samples?
Yes. ADP and other nucleotides can be analyzed from archived samples if they were properly frozen at -80°C and not subjected to multiple freeze-thaw cycles. For best results, please consult us regarding pre-freeze handling.
What is the recommended sampling time for dynamic studies (e.g., drug treatment or stress response)?
ADP levels can fluctuate within minutes in response to metabolic changes. For time-course studies, we recommend collecting samples at intervals as short as 5–15 minutes, depending on your experimental design.
How do you prevent nucleotide interconversion during processing?
We apply cold quenching and rapid deproteinization immediately after sample receipt. In addition, we use phosphatase inhibitors during extraction to minimize ADP-to-AMP or ATP-to-ADP conversion.
Can you provide custom panels including other energy metabolites (e.g., NAD⁺, succinate)?
Absolutely. Our platform supports multiplex analysis. You may include additional energy, redox, or purine metabolites in a customized panel tailored to your research needs.
Do I need to send a reference standard or internal control with my sample?
No need. We use validated stable isotope-labeled internal standards in every run to ensure quantification accuracy and correct for matrix effects.
What if I only have very limited sample volume?
We can work with as little as 30–50 µL of plasma or <10 mg of tissue for full nucleotide panel analysis. Please contact us for sample pre-assessment if you're unsure.
Can you help interpret the ADP/ATP/AMP ratios in a biological context?
Yes. Upon request, we offer pathway-level visualization and basic interpretation to help identify bioenergetic states or stress responses, such as mitochondrial dysfunction or glycolytic shifts.
Learn about other Q&A.
ADP Analysis Service Case Study

Title: PAP content in wild-type C24 and fry1 seedlings treated with either salt, ABA, or cold.
Journal: PLOS ONE
Published: 2011
- Background
- Methods
- Results
- Reference
Abiotic stresses such as salinity, drought, and low temperatures can significantly affect plant development and crop yield. Stress-responsive gene regulation is a key adaptive mechanism, but its upstream metabolic controls remain incompletely understood. The Arabidopsis mutant fry1—defective in the bifunctional nucleotidase/phosphatase FRY1/SAL1—exhibits hyperactivation of stress-inducible reporters like RD29A-LUC. While FRY1's inositol polyphosphatase function was previously linked to stress signaling, the physiological role of its nucleotide-related activity, specifically in degrading 3′-phosphoadenosine-5′-phosphate (PAP), was unclear due to technical limitations in measuring PAP in planta.
Sample Preparation:
Fresh tissues were extracted using a −20°C solvent mixture of chloroform, methanol, and acetonitrile with 0.4% formic acid to minimize nucleotide degradation.
Instrument Platform:
LC-MS/MS with triple quadrupole detection (QTRAP 4000), optimized in negative ion mode for PAP.
Ion-pair chromatography with n-hexylamine-modified mobile phases enabled baseline resolution between PAP, ADP, and ATP.
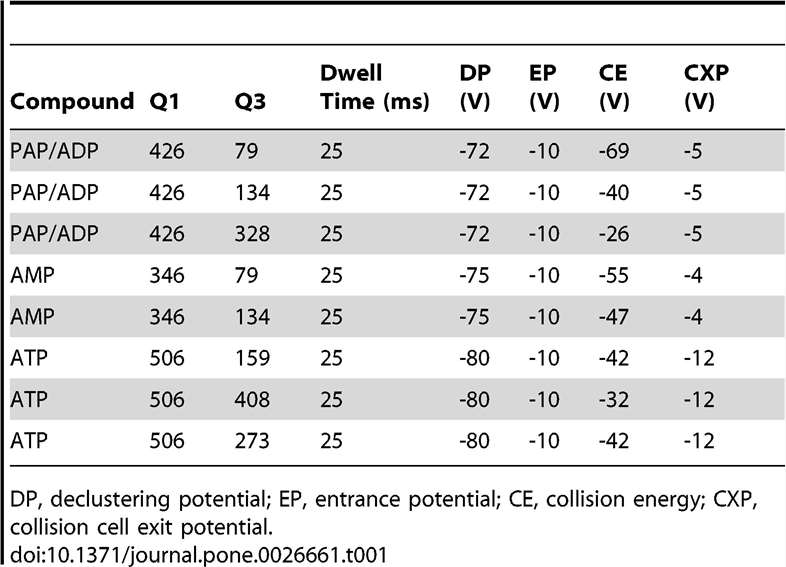
MRM Transitions:
Three transitions (e.g., m/z 426→134 and 426→79) were used to distinguish PAP from isomers with high specificity.
LOD: 4 nM (40 fmol on-column); dynamic range: 4 nM–10 µM (R² = 0.9998)
Validation:
- Consistent AMP/ADP/ATP levels aligned with enzymatic/spectroscopic benchmarks.
- Repeatability: RSD = 15.98% for PAP quantification (n = 3).
- Ion suppression: Negligible, confirmed by matrix-spike recovery.
Creative Proteomics offers similar LC-MS/MS-based nucleotide profiling platforms, optimized for:
- Sub-femtomole quantification of nucleotide intermediates (e.g., PAP, ADP)
- Purine metabolism and stress signaling studies
- Pathway-wide mapping in plant, microbial, and mammalian systems
- Matrix compatibility with plant extracts, plasma, tissues, or culture media
In Vivo PAP Accumulation in fry1
- Wild-type Arabidopsis showed undetectable PAP levels; fry1 mutants accumulated >10 nmol/g FW.
- Salt (NaCl), ABA, and cold treatments did not alter PAP levels significantly in either genotype.
Specificity of FRY1 Activity
Among FRY1 homologs (SAL2–SAL4, AHL), only fry1 and hos2 mutants accumulated PAP, confirming FRY1 as the dominant PAP-hydrolyzing enzyme in planta.
Functional Rescue via Overexpression
Overexpressing truncated FRY1 (cytosolic/nuclear), full-length FRY1 (chloroplastic), SAL2, or yeast MET22 restored wild-type morphology and reduced PAP levels in fry1 mutants. These transgenes also suppressed superinduction of RD29A-LUC under stress.
Suppression of PAP by Precursor Limitation
- Triple mutants (fry1 apk1 apk2) showed >70% reduction in PAP compared to fry1 alone.
- Corresponding normalization of morphology and RD29A-LUC expression further supports PAP's role as a regulatory metabolite.
Genetic Interaction with ABA Signaling Components
abh1 mutation suppressed RD29A-LUC superinduction in fry1, while abi1 did not, implicating PAP in non-canonical ABA signaling pathways.
Salt Tolerance Unaffected by FRY1 Overexpression
Despite full enzymatic activity and restored PAP levels, FRY1-overexpressing plants did not exhibit improved tolerance to NaCl or LiCl, unlike yeast, suggesting plant-specific stress adaptation pathways.
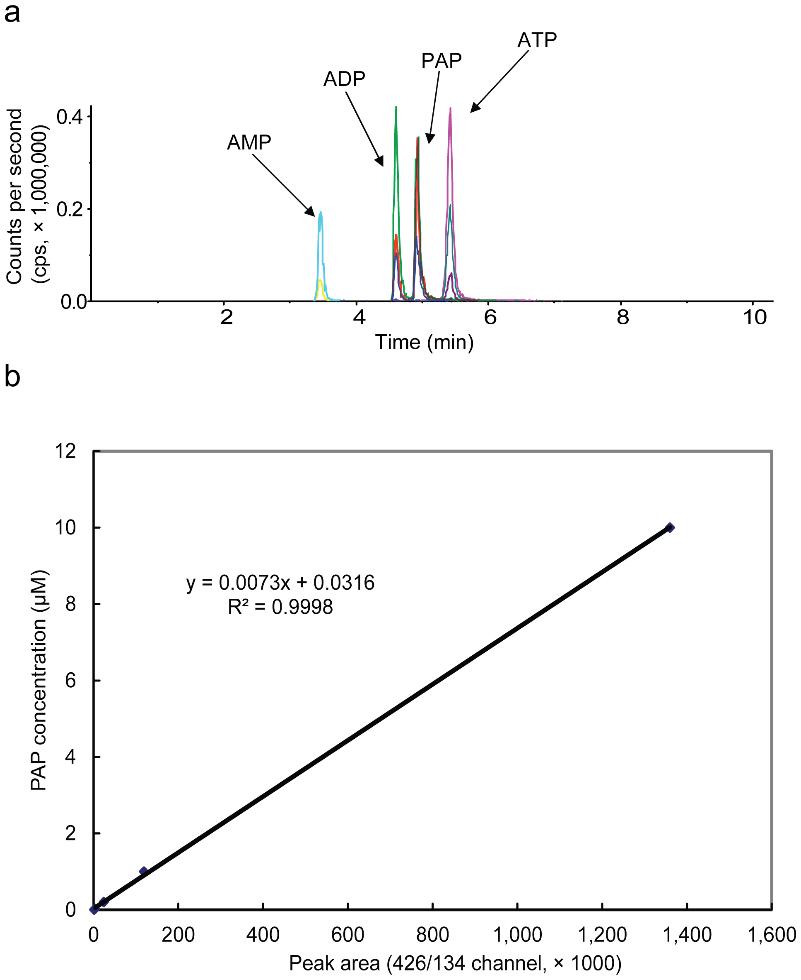 LC-MS/MS analysis of PAP, AMP, ADP, and ATP.
 MRM transitions for AMP, ADP, ATP, and PAP.
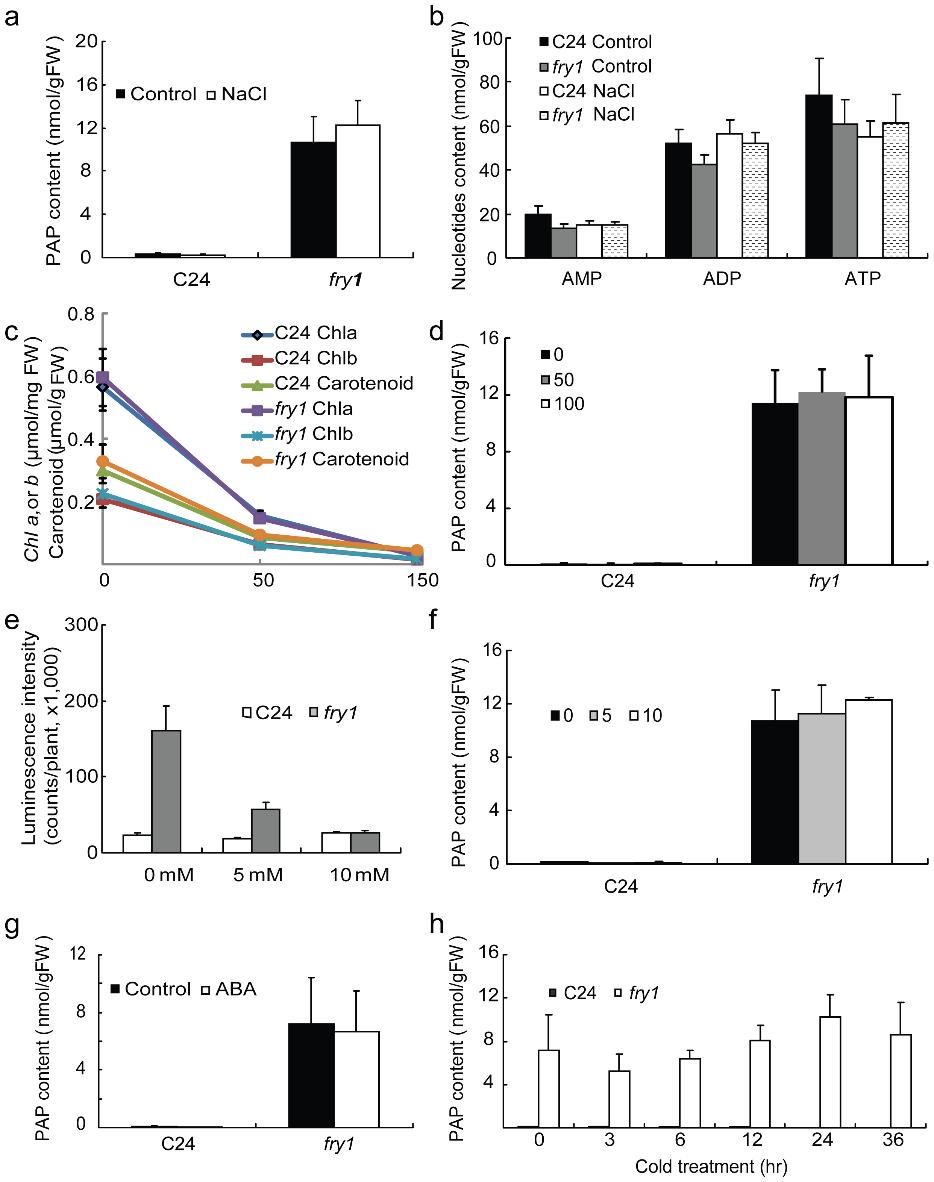 PAP content in wild-type C24 and fry1 seedlings treated with either salt, ABA, or cold.
Reference
- Chen, Hao, et al. "A nucleotide metabolite controls stress-responsive gene expression and plant development." PLoS One 6.10 (2011): e26661. https://doi.org/10.1371/journal.pone.0026661
Publications
Here are some of the metabolomics-related papers published by our clients:

- Methyl donor supplementation reduces phospho‐Tau, Fyn and demethylated protein phosphatase 2A levels and mitigates learning and motor deficits in a mouse model of tauopathy. 2023. https://doi.org/10.1111/nan.12931
- A human iPSC-derived hepatocyte screen identifies compounds that inhibit production of Apolipoprotein B. 2023. https://doi.org/10.1038/s42003-023-04739-9
- The activity of the aryl hydrocarbon receptor in T cells tunes the gut microenvironment to sustain autoimmunity and neuroinflammation. 2023. https://doi.org/10.1371/journal.pbio.3002000
- Lipid droplet-associated lncRNA LIPTER preserves cardiac lipid metabolism. 2023. https://doi.org/10.1038/s41556-023-01162-4
- Inflammation primes the kidney for recovery by activating AZIN1 A-to-I editing. 2023. https://doi.org/10.1101/2023.11.09.566426
- Anti-inflammatory activity of black soldier fly oil associated with modulation of TLR signaling: A metabolomic approach. 2023. https://doi.org/10.3390/ijms241310634
- Plant Growth Promotion, Phytohormone Production and Genomics of the Rhizosphere-Associated Microalga, Micractinium rhizosphaerae sp. 2023. https://doi.org/10.3390/plants12030651