What Is Volcano Plot
In statistics, a volcano plot is a kind of scatter plot that is applied to quickly seek out changes in large data sets composed of replicate data. It plots fold-change versus significance on the x and y axes, respectively. These plots are increasingly widely used in omic experiments such as genomics, transcriptomics, proteomics, and metabolomics where one usually has a long list of many thousands of replicate data points between two distinct conditions and one wants to quickly identify the most significant changes. A volcano plot combines a measure of statistical significance from a statistical test (e.g. a p value from an ANOVA model) with the magnitude changes, enabling quick visual determination of these data-points that represent large magnitude changes that are also statistically significant.
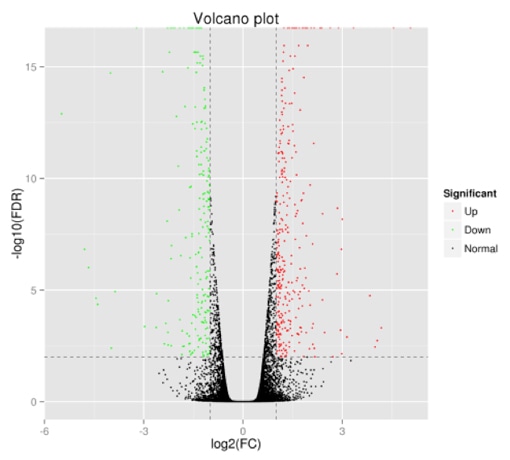
In a volcano plot, the y axis is the negative log of the p value (usually base 10). This results in highly significant points with low p values appearing toward the top of the plot. The log of the fold change (FC) between the two conditions is plotted on the x axis. The log of the fold change is adopted so that changes in both directions become equidistant from the center. Plotting points in this way form two regions of interest in the plot: those points that are found toward the top of the plot that are far too either the left- or right-hand sides. These represent values that display large magnitude fold changes as well as high statistical significance.
Volcano plots display both noise-level-standardized and unstandardized signals concerning differential expression of mRNA levels. Regularized test statistic and joint filtering have an intuitive geometric interpretation in a volcano plot, and its advantage over the double filter criterion of genes can be easily understood. As a scattering plot, the volcano plot can incorporate other external information, such as gene annotation, to aid the hypothesis generating process concerning a disease or phenotype.
Applications of volcano plot:
- Microarray analysis
- Genetic association studies
- Transcriptomics research
- Proteomics research
What Is a Volcano Plot From Mass Spectrometry
In the realm of mass spectrometry, the volcano plot emerges as a crucial visual tool that aids in the analysis of proteomics and metabolomics data. This graphical representation holds the potential to uncover differentially expressed features, such as proteins, peptides, and metabolites, among others, across varying experimental conditions. Through a combination of statistical significance and fold change, the volcano plot unveils insights that guide researchers in identifying biologically relevant candidates for further investigation.
The volcano plot is constructed with precision, utilizing two essential parameters: the negative logarithm of the p-value on the y-axis and the log2 fold change on the x-axis. The p-value signifies the statistical significance of differences between conditions, while the fold change quantifies the magnitude of change in expression levels. This strategic arrangement offers a comprehensive visualization of data, highlighting features with both statistical and biological significance.
 Volcano Plot From Mass Spectrometry (Long Liu et al,. Frontiers in Microbiology 2020)
Key Interpretations
1. Peak Formation and Statistical Significance
At the heart of the volcano plot's visualization is the occurrence of a peak, akin to a volcanic summit. Features with low p-values, located at the peak or upper regions of the plot, emerge as highly statistically significant. This positioning signals the potential alteration of expression levels between the experimental conditions, warranting a closer examination.
2. Magnitude of Change and Fold Change
The horizontal positioning of features along the x-axis reflects the log2 fold change, elucidating the magnitude of alteration in expression. The farther a feature is placed from the center, the greater the absolute fold change. This distinction is crucial in discerning the biological relevance of differentially expressed candidates.
3. Central Region and Subdued Changes
Features residing close to the center of the plot exhibit lower fold changes and may not reach statistical significance. This central region represents changes that are less pronounced or possibly unrelated to the conditions under comparison.
How to read a volcano plot in proteomics
Deciphering a volcano plot in the proteomics context demands a systematic approach:
| Approach | Description |
|---|---|
| Axis Interpretation | - x-axis: Log2 fold changes, revealing expression alterations. - y-axis: Negative logarithm of p-values, signifying statistical significance. |
| Identification of Significantly Differentially Expressed Features | - Features higher on the plot with lower p-values are statistically significant, warranting further investigation. - Features exceeding a designated p-value threshold hold substantial relevance. |
| Evaluation of Magnitude of Change | - Features far to the left/right on the x-axis indicate higher absolute fold changes, highlighting substantial expression alterations. |
| Central Region Consideration | - Features near the plot's center indicate minor fold changes and potential lack of statistical significance. |
| Synergy of Statistical Significance and Fold Change | - Features combining high fold changes and significant p-values are prime candidates for deeper exploration. |
| Contextual Insights and Annotations | - Annotations offer clarity on noteworthy features, such as established biomarkers or pathway-associated proteins. - Understanding experimental context and conditions enhances accurate interpretation. |
| Unveiling Biological Implications | - Volcano plots initiate exploration, followed by pathway enrichment studies and other analyses to validate biological implications. |
What Our Volcano Plot service provide
Our specialized Volcano Plot service focuses on the generation and analysis of volcano plots for proteome, metabolome, lipidome and other related datasets. Our offerings encompass:
Expert Guidance: Our team of experts will assist you in navigating the intricacies of volcano plot analysis, facilitating a clear and effective interpretation of your data.
Tailored Visualizations: We craft personalized volcano plots that cater to the specifics of your protein or metabolite data, accentuating crucial patterns within.
Statistical Significance: Our service aids in the recognition of noteworthy expression changes, concentrating on features that possess genuine biological significance.
Insights into Biological Context: We provide support in comprehending the biological context underlying your data, establishing connections between identified features and pertinent pathways, along with potential biomarkers.
Integration and Continuation: The insights extracted from the volcano plot analysis are structured to seamlessly integrate into subsequent analyses or experimental undertakings.
Interactive Assistance: Collaborative analysis is fostered through interactive discussions and expert clarification, enhancing the analysis experience.
Ensured Data Security: Safeguarding your research information is paramount. Our service maintains rigorous protocols to ensure the privacy and security of your data.
Embark on a streamlined yet comprehensive journey of volcano plot analysis for proteins, metabolites, and related datasets through Our Volcano Plot service.
How to place an order:

*If your organization requires signing of a confidentiality agreement, please contact us by email
As one of the leading omics industry company in the world! Creative Proteomics now is opening to provide volcano plot service for our customers. With rich experience in the field of bioinformatics, we are willing to provide our customers the most outstanding service! Contact us for all the detailed information!


