What Is GO Enrichment Analysis
The wealth of differential genes or substances obtained from omics data is vast. Faced with this abundance, it is impractical to individually study and validate each one to unravel the mechanisms underlying the phenomena under investigation. Enrichment analysis offers a means to categorize differential genes or substances based on their functions. This grouping aligns genes or substances with similar functions, thus reducing workload and enabling the association of functions with phenotypes.
Commonly used enrichment analyses encompass GO enrichment analysis, KEGG enrichment analysis, and GSEA enrichment analysis. The purpose of GO functional annotation is to link the gene set of interest with gene functions. The Gene Ontology is an online database designed to describe gene product functions using standardized vocabulary, categorized into three branches: Biological Process (BP), Cellular Component (CC), and Molecular Function (MF). By utilizing relevant tools, gene sets can be annotated to specific entries (terms) within these three branches, shedding light on the gene set's functionality.
For instance, the GO term for iron ion binding is GO:0005506. If our differential gene set exhibits enrichment for this term following GO enrichment analysis, it suggests a potential association with iron ion binding in the phenomena we are investigating. From the aforementioned information, it's apparent that the number of differential genes we obtain doesn't correspond directly to the number of enriched GO terms. A single GO term can encompass multiple genes, and likewise, a single gene can be enriched in multiple terms.

GO Analysis and GO Enrichment Analysis Services
GO Functional Analysis: Involves the functional annotation of identified protein sets or selected differentially expressed proteins. Each protein is annotated with various functional terms, followed by statistical analysis of the annotations.
 (Wei Zhong et al,. Molecular Medicine Reports 2018)
GO Enrichment Analysis: This analysis focuses on provided gene lists, such as differentially expressed genes, and performs Gene Ontology functional analysis to yield significant enrichment results (P < 0.05 or P < 0.01). The service delivers all enrichment outcomes and visualizes key findings. Specifically tailored to differentially expressed proteins, this functional annotation identifies significantly enriched GO functional terms. This provides insights into which functions and biological processes are notably affected by the studied biological treatment.
GO Enrichment Analysis Service at Creative Proteomics includes the following steps:
Determine the annotated GO terms and all splits
Count the number of appearances of each GO term for the proteins in the tested set as well as in the reference set
Calculate a p-value representing the probability that the enriched numbers of counts could have resulted from randomly distributing this GO term between the tested set and the reference set
Interpreting GO Enrichment Analysis Results
The enrichment results describes the significant shared GO terms (or parents of GO terms) used to describe the set of proteins of interest, the background frequency, the sample frequency, and p-value, an indication of over (or under) representation for each term. P-value is the probability or chance of seeing at least x number of proteins out of the total n proteins in the list annotated to a particular GO term, given the proportion of proteins in the identified proteins that are annotated to that GO Term. That is, the GO terms shared by the proteins in the user's list are compared to the distribution of background annotation. The closer the p-value is to zero, the more significant the specific GO term associated with the group of proteins is (i.e. the less likely the observed annotation of the specific GO term to a set of genes occurs by chance).
The outcomes of GO enrichment analysis can be visualized in three primary formats: Directed Acyclic Graph (DAG), bar charts, and bubble plots.
Directed Acyclic Graph (DAG):
In this representation, arrows denote hierarchical relationships between terms. Elliptical shapes signify GO terms not among the top 10 enrichments, while rectangular boxes represent the top 10 enriched GO terms. Colors reflect the degree of enrichment for differentially expressed genes within GO terms. Deeper colors indicate more significant enrichment, with red representing the most significant, followed by yellow for moderate significance, and no color denoting insignificant enrichment. Each box displays the GO term's identifier on the first line, functional description on the second, p-value on the third, and the last number indicates the count of differentially expressed genes enriched in that term divided by the total count of differentially expressed genes associated with that term.

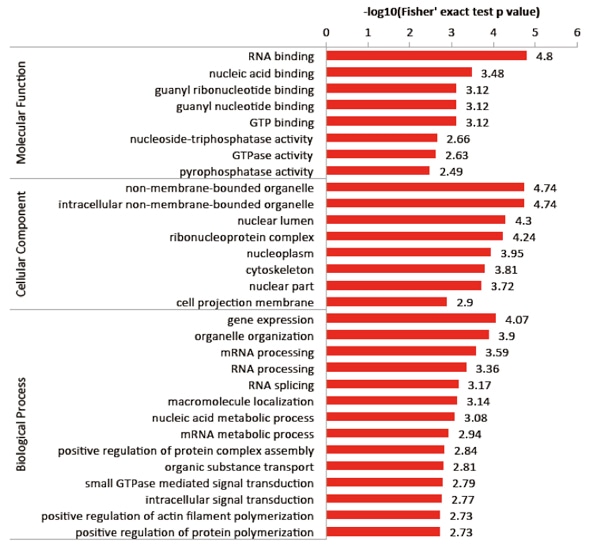
Bar Chart:
Enrichment results are often depicted using bar charts or bubble plots, usually showcasing the top 10 or top 20 enriched terms. The x-axis can be labeled in several ways, such as count, Gene Ratio, or -Log10(padj). The length of the bars correlates with the number of genes associated with each term and indicates the level of enrichment significance. The y-axis represents the enriched terms, with each term belonging to one of the three levels of GO enrichment. Different levels can be color-coded for distinction, or structured as separate boxes similar to the example shown below.
Bubble Plot:
The x-axis of the bubble plot represents a ratio, such as Rich Factor, GeneRatio, or (GeneRatio / BgRatio), or fold change in differential expression. A higher value on this axis indicates a greater level of enrichment of differential metabolites, proteins, or genes in that pathway. The y-axis displays the names of enriched GO terms or pathways. Typically, the top 20 or 30 enriched pathways are selected for visualization.
In this plot, the size of each bubble corresponds to the number of genes associated with the pathway. Larger bubbles signify a higher number of genes enriched in that pathway. The color of the bubbles represents the significance of the P-value, with darker colors indicating a smaller -log10(Pvalue) and thus a more significant enrichment.
The bubble plot effectively captures multiple dimensions of information in a single view, enabling researchers to quickly discern enriched pathways based on their enrichment levels, gene count, and statistical significance.
 (Chiyu Zhang et al,. Frontiers in Molecular Biosciences 2022)


