Aromatic Amino Acids Analysis Service
Tryptophan, tyrosine, and phenylalanine are more than amino acids—they are gateways to understanding redox balance, microbiome interaction, and pathway activity. Creative Proteomics offers high-precision LC-MS/MS services designed to help you move beyond detection to interpretation.
- Full-spectrum panels covering kynurenine, indole, and catecholamine pathways
- Absolute quantification with isotope-labeled standards and matrix-matched calibration
- Chiral resolution and stable isotope tracing for functional insights
- Compatible with plasma, cells, tissues, fermentation, nutrition, microbiome matrices
Submit Your Request Now
×
What You Will Receive
- Raw Data Files (.raw, .wiff, or .mzML formats)
- Quantitative Tables with absolute concentrations, units, and LLOQ flags
- Pathway Summary Reports showing normalized abundance and biological interpretation
- Method Documentation including IS list, calibration curves, regression models, QC stats
- Publication-Ready Visuals (heatmaps, chromatograms, standard curves) on request
- What We Provide
- Advantages
- Technology Platform
- Sample Requirement
- Demo
- FAQs
What Are Aromatic Amino Acids?
Tryptophan (Trp), tyrosine (Tyr), and phenylalanine (Phe) are aromatic amino acids essential for protein synthesis and deeply embedded in metabolic regulation. Their ring structures enable conversion into a wide array of signaling molecules, including neurotransmitters, redox mediators, and microbiota-derived metabolites.
- Tryptophan enters the kynurenine and indole pathways, yielding NAD⁺ precursors and microbiome-influenced metabolites like indoxyl sulfate and indole-3-acetic acid.
- Phenylalanine and tyrosine drive catecholamine biosynthesis and generate phenolic compounds linked to oxidative stress and detoxification.
Due to their roles in diverse pathways, aromatic amino acids are sensitive readouts of:
- Metabolic stress and enzyme activity
- Host–microbiome interactions
- Nutrient flux and cell-state shifts
- Bioproduction pathway efficiency
Quantifying both the core amino acids and their downstream products reveals actionable insights into metabolic function, pathway dynamics, and system-level responses.
What Aromatic Amino Acid Analysis Services Can We Offer for Your Research
Absolute Quantification Panels
Customized LC-MS/MS panels for tryptophan, tyrosine, phenylalanine and their metabolic products, with isotopically labeled internal standards and full calibration curves.
Pathway-Specific Profiling
Focused panels for key metabolic pathways:
- Kynurenine pathway mapping
- Indole/microbiota-derived metabolite screening
- Phenylalanine–tyrosine–catecholamine pathway coverage
Chiral Separation & D/L-Amino Acid Profiling
Resolution of stereoisomers (e.g., D-/L-tryptophan, D-/L-phenylalanine) using derivatization or chiral LC-MS platforms.
Stable Isotope Tracing Studies
Quantitative tracking of ^13C- or ^15N-labeled Trp/Phe/Tyr in metabolic flux or nutrient uptake studies.
Stress & Oxidative Marker Quantitation
Targeted detection of nitrated, halogenated, and dityrosine derivatives associated with redox imbalance or formulation degradation.
Full List of Detectable Aromatic Amino Acids and Related Detectables
| Class | Representative Targets (non-exhaustive) | Typical LLOQ* | Notes |
|---|---|---|---|
| Core AAs | Tryptophan, Tyrosine, Phenylalanine | 5–50 ng/mL | RP-LC or HILIC; isotope IS for each class |
| Kynurenine Pathway | Kynurenine, Kynurenic acid, 3-OH-kynurenine, Anthranilic acid, 3-OH-anthranilic acid, Xanthurenic acid, Quinolinic acid, Picolinic acid | 0.1–20 ng/mL | Acidic buffers improve retention of acids |
| Indole/Microbiome | Indole-3-acetic, Indole-3-propionic, Indole-3-lactic, Indole-3-aldehyde, Indoxyl sulfate, Indoleacrylic acid, Tryptamine, Serotonin, Melatonin | 0.02–10 ng/mL | Light- and oxidation-sensitive; protect samples |
| Phenylalanine/Tyrosine Derivatives | DOPA, p-Hydroxyphenylpyruvate, p-Hydroxyphenylacetic acid, DOPAC, HVA, Phenylpyruvate, Phenyllactate, Phenylacetate, Phenylacetylglutamine | 0.1–10 ng/mL | Some require negative-mode MRM |
| Stress Markers | 3-Nitrotyrosine, 3-Chlorotyrosine, Dityrosine | 0.1–5 ng/mL | Monitor for in-process oxidation |
| Chiral AAs | D-/L-Trp, D-/L-Tyr, D-/L-Phe | 5–50 ng/mL | Marfey's or chiral HPLC |
*Matrix-dependent; reported LLOQs are achieved in validated research workflows.
Advantages of Our Aromatic Amino Acids Analysis Services
- Sensitivity & Range: LLOQ 0.02–50 ng/mL; dynamic range ≥ 10³–10⁴ fold per analyte; R² ≥ 0.995 with 1/x or 1/x² weighting.
- Precision & Accuracy: Intra-run CV ≤ 10%, inter-run CV ≤ 15%; spike-recovery 80–120%.
- Interference Control: Verified carryover < 0.1% after ULOQ; isotopologue interference checks for co-eluting species.
- Matrix Effect Governance: Post-extraction spikes and post-column infusion maintain signal suppression/enhancement within acceptance windows.
- Traceability: Full calibration metadata (lot IDs, transitions, dwell/RT windows), QC trend charts, and audit-ready method sheets.
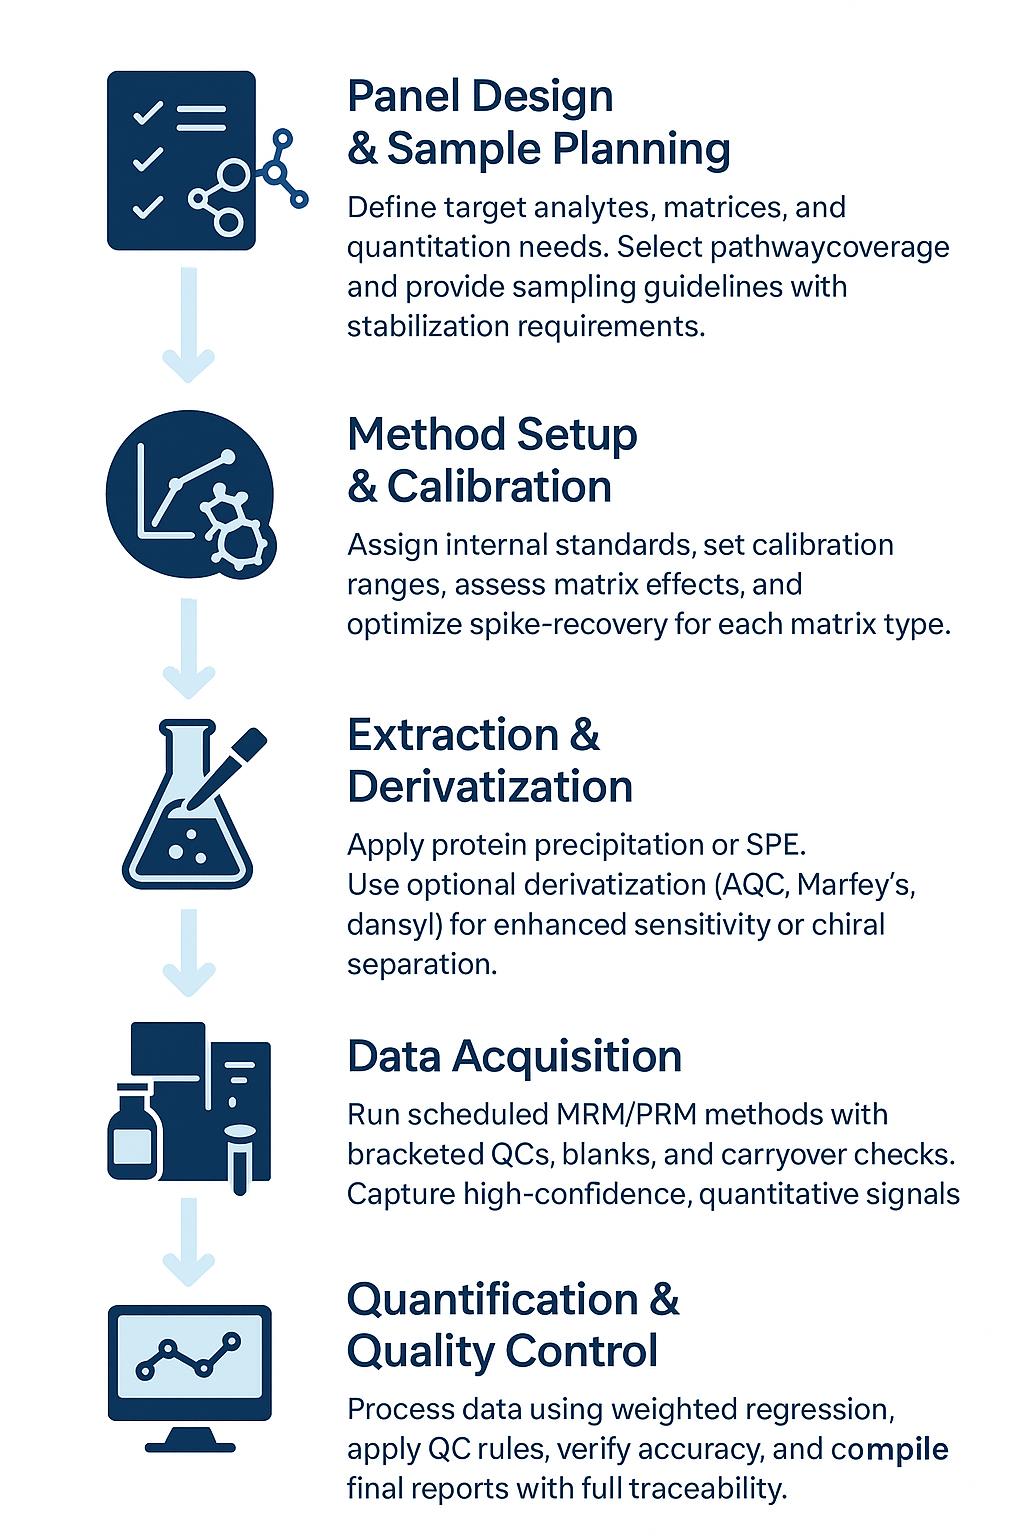
Workflow for Aromatic Amino Acids Analysis Service
1. Scoping & Panel Design – Define targets, matrices, expected ranges; align on absolute/relative quant and pathway reporting.
2. Stabilization & Sampling Plan – Provide matrix-specific preservatives and light/oxidation precautions; supply pre-labeled tubes if needed.
3. Method Setup – Internal standard mapping, calibration range selection, and interference risk assessment; spike-recovery tuning per matrix.
4. Extraction & Derivatization – Protein precipitation/SPE; optional AQC/Marfey's/dansyl routes for select classes.
5. Acquisition – Scheduled MRM/PRM with bracketed QCs, blanks, and matrix spikes; carryover checks after ULOQ.
6. Quantification & QA – Weighted regression, back-calculation review, QC rule evaluation, and lot-to-lot normalization.
7. Reporting & Handover – Concentration tables (with units and LLOQ flags), pathway summaries, figures, and full method metadata.
Technology Platform for Aromatic Amino Acids Analysis Service
UHPLC–MS/MS (Targeted Quantification)
Primary Method for Routine High-Throughput Quantification
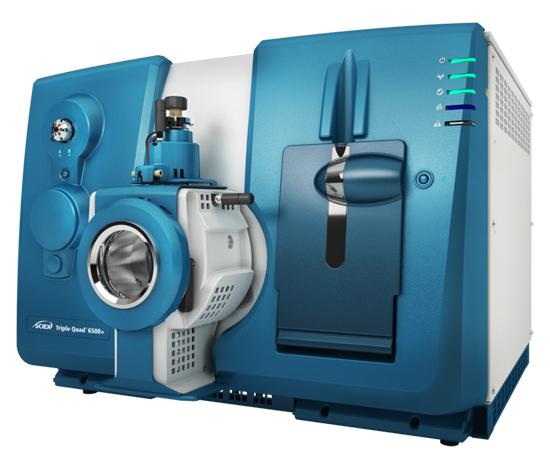
Instrument Models: Agilent 6495C Triple Quadrupole, SCIEX Triple Quad 6500+
Ionization Mode: ESI positive/negative; polarity switching as needed
Chromatography:
- RP-LC: C18, 100–150 × 2.1 mm, 1.7–2.6 µm
- HILIC: Amide or ZIC-pHILIC columns for polar/acidic targets
Detection:
Scheduled MRM transitions; dwell time optimization per analyte
Quantification:
Stable-isotope internal standards, matrix-matched calibration, weighted regression (1/x²)
HRAM LC–MS (Method Confirmation / Expanded Coverage)
Used for Exact-Mass Confirmation and Suspect Screening
Instrument Models: Thermo Q Exactive Plus, Orbitrap Exploris 240
Acquisition Modes: Full-scan (MS1), PRM for high-resolution targeted analysis
Resolution Settings: Typically 35k–70k @ m/z 200
Chiral LC–MS (Optional for D/L Isomer Profiling)
Applied in Microbiome Studies, Enzymology, and QA Contexts
Approaches:
- Derivatization: Marfey's reagent (FDAA) for D/L separation
- Chiral Columns: Crown-ether or teicoplanin-based phases
Detection: LC–MS/MS with scheduled MRM; chiral resolution confirmed with standards
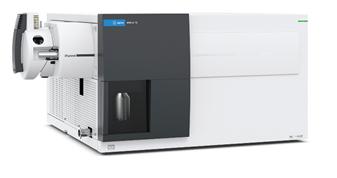
Agilent 6495C Triple Quadrupole (Figure from Agilent)
SCIEX Triple Quad™ 6500+ (Figure from Sciex)
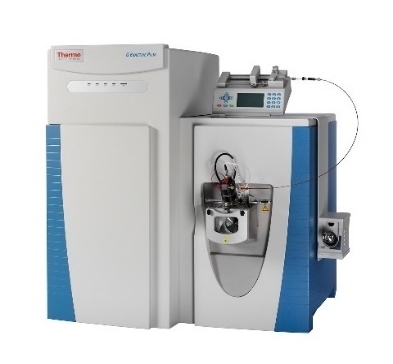
Thermo Fisher Q Exactive (Figure from Thermo Fisher)
Sample Requirements for Aromatic Amino Acids Analysis Service
| Matrix | Minimum Amount | Container/Preservative | Key Handling Notes |
|---|---|---|---|
| Plasma / Serum | 80–120 µL | Low-bind microtubes; EDTA for plasma | Chill promptly; avoid hemolysis; store ≤ −80 °C; minimize freeze–thaw |
| Urine | 200 µL | Low-bind tubes | Optionally acidify to ≤ pH 3 for indoles; store ≤ −80 °C |
| Cell Pellet | ≥1×10⁶ cells | Cryovials | Wash quickly with cold PBS; snap-freeze; record cell count/protein |
| Tissue | 20–50 mg | Cryovials / foil wrap | Rinse if needed; blot dry; snap-freeze; maintain cold chain |
| Culture Medium / Fermentation Broth | 500 µL | Low-bind tubes | Clarify by cold spin; consider spike-recovery for matrix effects |
| Feces / Microbiome Prep | 50–100 mg | Screw-cap cryotubes | Homogenize under cold conditions; note water content |
| Formulations / Foods | 0.5–2 g or mL | As appropriate | Provide excipient list; protect from light/oxidation as relevant |
Demo Results
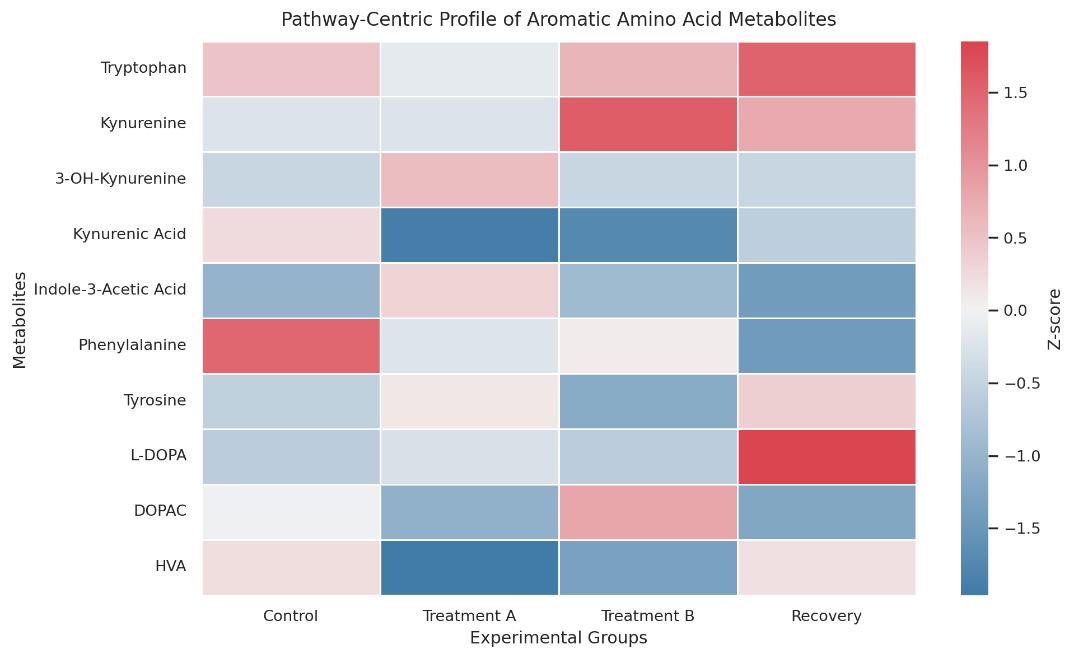
Heatmap showing Z-score–normalized abundance of key aromatic amino acid–related metabolites across four experimental groups. Pathway coverage includes tryptophan–kynurenine, indole derivatives, and phenylalanine–tyrosine branches.
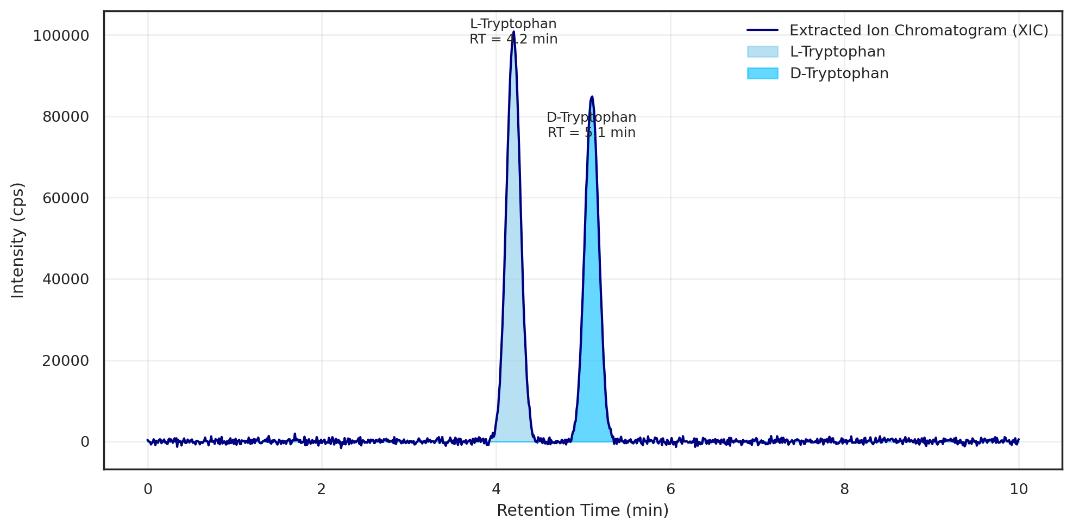
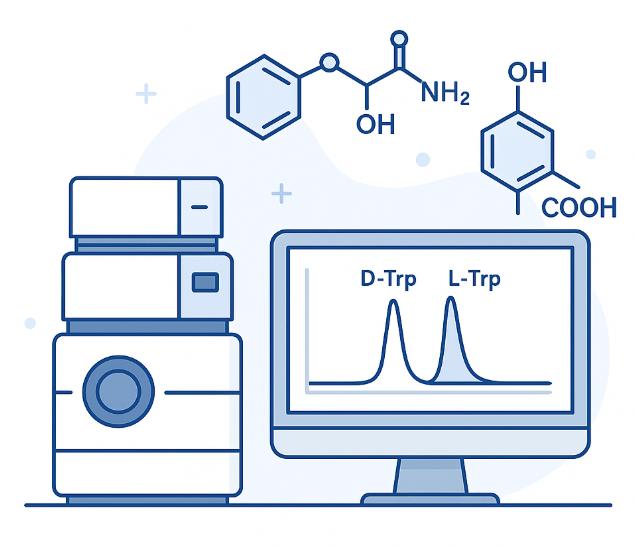
Extracted ion chromatogram illustrating chromatographic separation of L-tryptophan and D-tryptophan isomers. Peaks are baseline-resolved with distinct retention times (4.2 and 5.1 min), demonstrating isomer-specific LC–MS/MS capability.
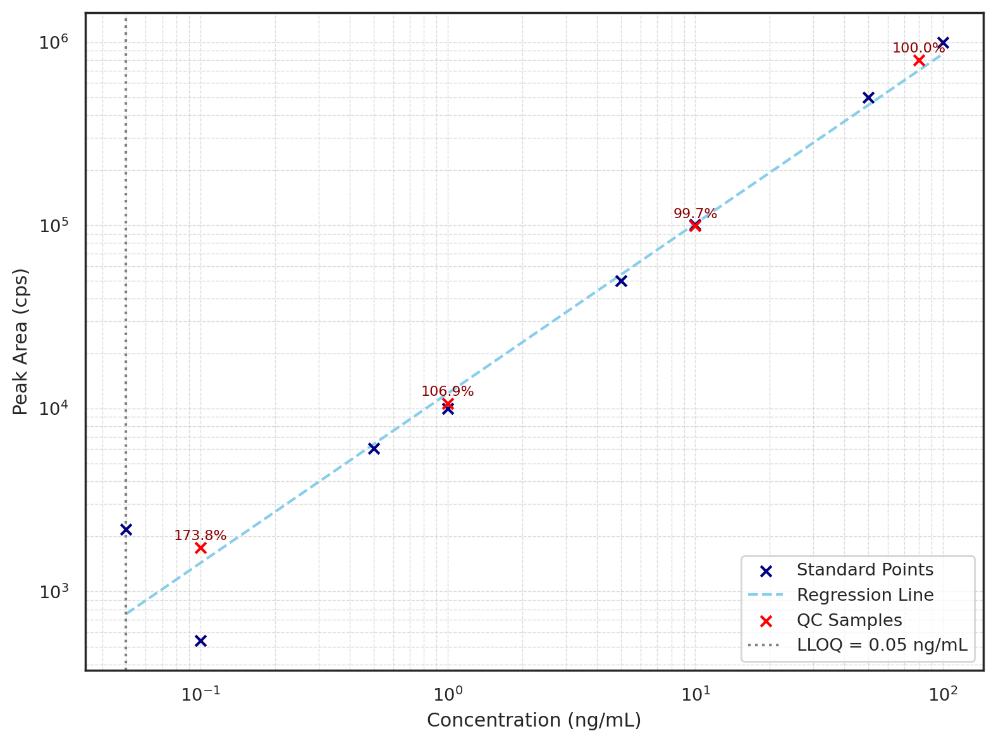
Standard calibration curve for a representative aromatic amino acid metabolite plotted on a log–log scale. LLOQ is marked at 0.05 ng/mL. Red points indicate QC samples with percent accuracy labeled.
When Do You Need Aromatic Amino Acids Quantification?
Metabolic Pathway Research
Track tryptophan–kynurenine and phenylalanine–tyrosine flux under defined stimuli or perturbations.
Host–Microbiome Interaction Studies
Profile indole derivatives as functional outputs of microbial tryptophan metabolism.
Redox Biology & Stress Response
Quantify nitrated, chlorinated, or dityrosine species linked to oxidative or nitrosative conditions.
Nutritional & Supplement Research
Evaluate aromatic amino acid intake, absorption, and metabolic conversion in dietary intervention models.
Cell Culture & Bioproduction Monitoring
Assess amino acid consumption, byproduct formation, and pathway shifts in engineered systems.
Enzyme Activity Assays
Measure substrate-product relationships in hydroxylases, decarboxylases, or transaminase-driven reactions.
FAQ of Aromatic Amino Acids Analysis Service
What are the main factors affecting data reliability in aromatic amino acid quantification?
Matrix effects, analyte instability (e.g., oxidation, light sensitivity), and isomer co-elution are common pitfalls. These can be mitigated through matrix-matched calibration, internal standards, and proper sample handling protocols.
Can aromatic amino acid analysis be integrated into multi-omics workflows?
Yes. The dataset can be harmonized with transcriptomics, proteomics, or fluxomics studies. Our output supports pathway enrichment, correlation analysis, and functional interpretation across omics layers.
What are the critical requirements for sample preparation and stabilization?
Avoid repeated freeze–thaw, protect from light (especially for indole derivatives), and use low-bind tubes. For some analytes, acidification or antioxidants may be needed to preserve integrity before extraction.
How can I differentiate host-derived vs. microbiota-derived metabolites from tryptophan?
By analyzing specific downstream products such as indole-3-acetic acid, indoxyl sulfate, and kynurenine in parallel, and optionally combining with isotope tracing or germ-free/control models.
Is chiral separation necessary for all projects involving aromatic amino acids?
Not always. It depends on your biological question. For microbiome studies, stereochemistry is often critical. For pathway flux or quant-only projects, total pool may suffice unless D-forms are biologically relevant.
What QC or validation support is provided for regulatory or publication-grade studies?
We provide full documentation including calibration performance, spike recovery, QC accuracy, and method metadata (instrument parameters, transitions, IS lot numbers), suitable for audits, peer review, and reproducibility assessments.
Can aromatic amino acid profiling support enzyme kinetics or activity assays?
Yes. By quantifying substrate–product relationships (e.g., tryptophan → kynurenine), our method supports activity evaluation of enzymes such as IDO, TDO, PAH, and MAO under defined conditions.
How are low-abundance metabolites (e.g., 3-OH-kynurenine) validated in your method?
Validation includes signal-to-noise verification, LLOQ confirmation using matrix-matched calibration, and isotopically labeled internal standards to track recovery and variation across runs.
Can this service support time-course studies or dynamic metabolic profiling?
Absolutely. The method is designed for relative or absolute quantification across multiple timepoints with consistent normalization and QC controls, ideal for kinetic or response profiling.
Is the platform suitable for fermentation or bioengineering optimization studies?
Yes. We support complex matrices such as fermentation broth or cell culture supernatants, with demonstrated compatibility for pathway flux tracking, metabolic leakage monitoring, and yield optimization.
What data formats are supported for downstream integration or bioinformatics pipelines?
We provide processed concentration tables in Excel or CSV, and metadata in standardized formats. Optionally, mzML or mzXML can be delivered for raw data re-analysis or external processing.
How are batch effects minimized when running large sample sets?
We include pooled QC samples, run-randomization, and batch QC trend monitoring. Inter-batch variation is corrected via normalization algorithms when required.
Learn about other Q&A about proteomics technology.
Publications
Here are some of the metabolomics-related papers published by our clients:

- A human iPSC-derived hepatocyte screen identifies compounds that inhibit production of Apolipoprotein B. 2023.
- The activity of the aryl hydrocarbon receptor in T cells tunes the gut microenvironment to sustain autoimmunity and neuroinflammation. 2023.
- Lipid droplet-associated lncRNA LIPTER preserves cardiac lipid metabolism. 2023.
- Inflammation primes the kidney for recovery by activating AZIN1 A-to-I editing. 2023.
- Anti-inflammatory activity of black soldier fly oil associated with modulation of TLR signaling: A metabolomic approach. 2023.
- Non-invasive elevation of circulating corticosterone increases the rejection of foreign eggs in female American robins (Turdus migratorius). 2022.
- Untargeted metabolomics reveal sex-specific and non-specific redox-modulating metabolites in kidneys following binge drinking. 2023.
- Nicotine exposure during rodent pregnancy alters the composition of maternal gut microbiota and abundance of maternal and amniotic short chain fatty acids. 2022.
- Sex hormones, sex chromosomes, and microbiota: identification of Akkermansia muciniphila as an estrogen-responsive bacterium. 2023.