Take your research to the next level with the protocol for quantifying low-abundant phosphorylated carbohydrates using HILIC-QQQ-MS/MS. Learn how to detect and quantify rare and important phosphorylated carbohydrates using hydrophilic interaction liquid chromatography and triple quadrupole mass spectrometry. Gain a deeper understanding of carbohydrate signaling in health and disease, and advance your glycomics research with this powerful technique.
1 Plant Growth and Sampling Conditions
To minimize biological variation and ensure accuracy in a metabolomics study of plant material, it is crucial to grow the plants under specific and controlled conditions. This helps to ensure that the plant material is representative of the total population under study. Additionally, it is recommended to prepare a sample identification file in advance and prelabel all sample tubes, as several samples are typically generated in a single study. The harvest of plant material should be quickly followed by quenching to prevent changes in metabolite levels. It is also important to perform metabolite extraction in finely homogenized fresh-frozen plant tissue to increase extraction efficiency. During all steps of the process, it is essential to prevent the plant material from thawing to maintain the integrity of the samples.
2 Harvest and Tissue Sampling
(a) Prelabel all sample screw-cap polypropylene Falcon tubes (15 or 50 mL depending on the amount of material) with freezer-compatible labels or pen markers.
(b) Harvest a representative amount of the plant tissue of interest into a screw-cap polypropylene Falcon tube, and rapidly freeze it in liquid nitrogen (quenching).
(c) Use a precooled pestle and mortar filled with liquid nitrogen (or a precooled ball mill) to finely homogenize the frozen plant tissue. While doing this, make sure that the plant material does not thaw by sequentially adding liquid nitrogen.
(d) Once a fine homogenized powder is obtained, transfer it back to the precooled labeled screw-cap polypropylene Falcon tube with the help of a precooled metal spatula or small spoon.
(e) Use precooled 2.0-mL safelock microcentrifuge tubes to weight aliquots of 50 mg of fresh weight (FW) powdered frozen tissue.
(f) Prepare at least six biological replicates and make sure that they follow the same sample procedure to reduce biological variation.
(g) Store all labeled and weighed 2.0-mL safelock sample tubes in a box (or plastic bag) at 80 C until metabolite extraction and further LC-MS analysis.
3 Metabolite Extraction
Highly polar metabolites such as phosphorylated carbohydrates are extracted following a well-established protocol that uses 50 mg (FW) of plant tissue.
(a) Add 500 μL of ice-cold metabolite extraction solution to each 2.0-mL safelock microcentrifuge tube containing 50 mg (FW) of frozen plant tissue. Vortex and keep tubes on ice (enzymatic activity stops and proteins precipitate in this step).
(b) Incubate each sample tube for 2 h, at -20 ℃, and vortex occasionally.
(c) Add 400 μL of ice-cold HPLC-grade water, and place the sample tube in a thermoshaker during 15 min at 4 ℃ and 950 rpm. Attention! Turn on the thermoshaker in advance to cool it down.
(d) Centrifuge for 10 min at 11,000 × g and at 4 ℃.
(e) Transfer the upper phase (aqueous-acetonitrile) to a new 2.0 mL safelock microcentrifuge tube and keep it on ice.
(f) Reextract the chloroform phase with 400 μL of ice-cold HPLC-grade water and centrifuge as described above, in steps (c) and (d), respectively.
(g) Add the second aqueous-acetonitrile phase to the first one.
(h) Centrifuge again as described in step (d).
(i) Transfer the combined upper phase (aqueous-acetonitrile) to a new 2.0-mL safelock microcentrifuge tube and keep it on ice.
(j) Evaporate the combined aqueous-acetonitrile phase to dryness using a centrifugal concentrator set at 20 C for a maximum time of 6 h.
(k) Fill tubes with inert gas (Argon) to prevent the dry extract from oxidation and degradation reactions through components of atmospheric air.
4 HILIC-QQQ-MS/MS Method Development
The HILIC-QQQ-MS method here described is divided into two parts. The first part describes ESI-QQQ-MS direct infusion measurements of individual standard working solutions while the second part guides you through the development and validation of the HILIC-QQQ-MS method.
4.1 ESI-QqQ-MS Direct Infusion Measurements
4.2 HILIC-QqQ-MS Method Development and Validation
5 Data Analysis
A simple procedure is presented here to analyze LC-MS raw data using MassLynx software (version 4.1, Waters®), followed by the usual Microsoft Excel® spreadsheet functions. Alternatively, the user can process the LC-MS data using the QuanLynx tool available in the MassLynx software (version 4.1, Waters®).
(a) Open MassLynx to visualize LC-MS data (both individual target compounds and QC mixtures).
(b) Click in Chromatogram to check the peak shape and ion intensity.
(c) Click in Display followed by Mass and check for the presence of the peak for each transition.
(d) Check retention times and peak areas between analysis in different days or weeks.
(e) Open the LC-MS raw file of the calibration curve mixtures and register the peak area values of the MRM1 transition for each target compound (Table 2) to construct the plot of peak area vs concentration, i.e., calibration curve, as well as the S/N values for LOD and LOQ evaluation for each target compound.
(f) Once this is done, evaluate the linearity of each calibration curve by visual inspection and then, using the Mandel's Fitting test.
(g) To evaluate intraday and interday precision for each compound, calculate the relative standard deviation (RSD, %) of retention times and peak areas.
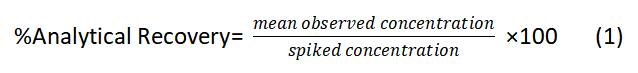
(h) To determine method accuracy, open the correspondent LC-MS raw files, register the peak areas, calculate the respective concentrations, and use Eq. 1:
(i) To determine percent ME(%), open the correspondent LC-MS raw files, register the analytes signal response, and use Eq. 2:
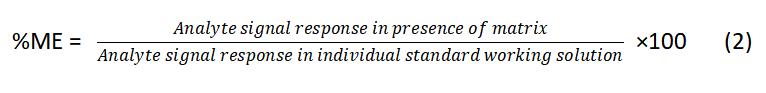
where ME=100% indicates no matrix effect, ME<100% indicates ion suppression, and ME>100% indicates ion enhancement.
You may be interested in:


Reference
- António, C. (Ed.). (2018). Plant metabolomics: Methods and protocols. Humana Press.


