What Is the Isoelectric Point?
The isoelectric point (pI) is defined as the pH at which a molecule carries no net electrical charge. For amino acids, which serve as the fundamental building blocks of all proteins, the pI represents a critical physicochemical parameter that governs their behavior in solution, their interactions with chromatographic surfaces, and their overall stability in formulation. Understanding pI is essential for any researcher working with proteins, from early-stage purification development through late-stage biopharmaceutical characterization. Without a firm grasp of isoelectric point principles, designing effective separation strategies, optimizing formulation conditions, and interpreting charge-based analytical data become significantly more challenging.
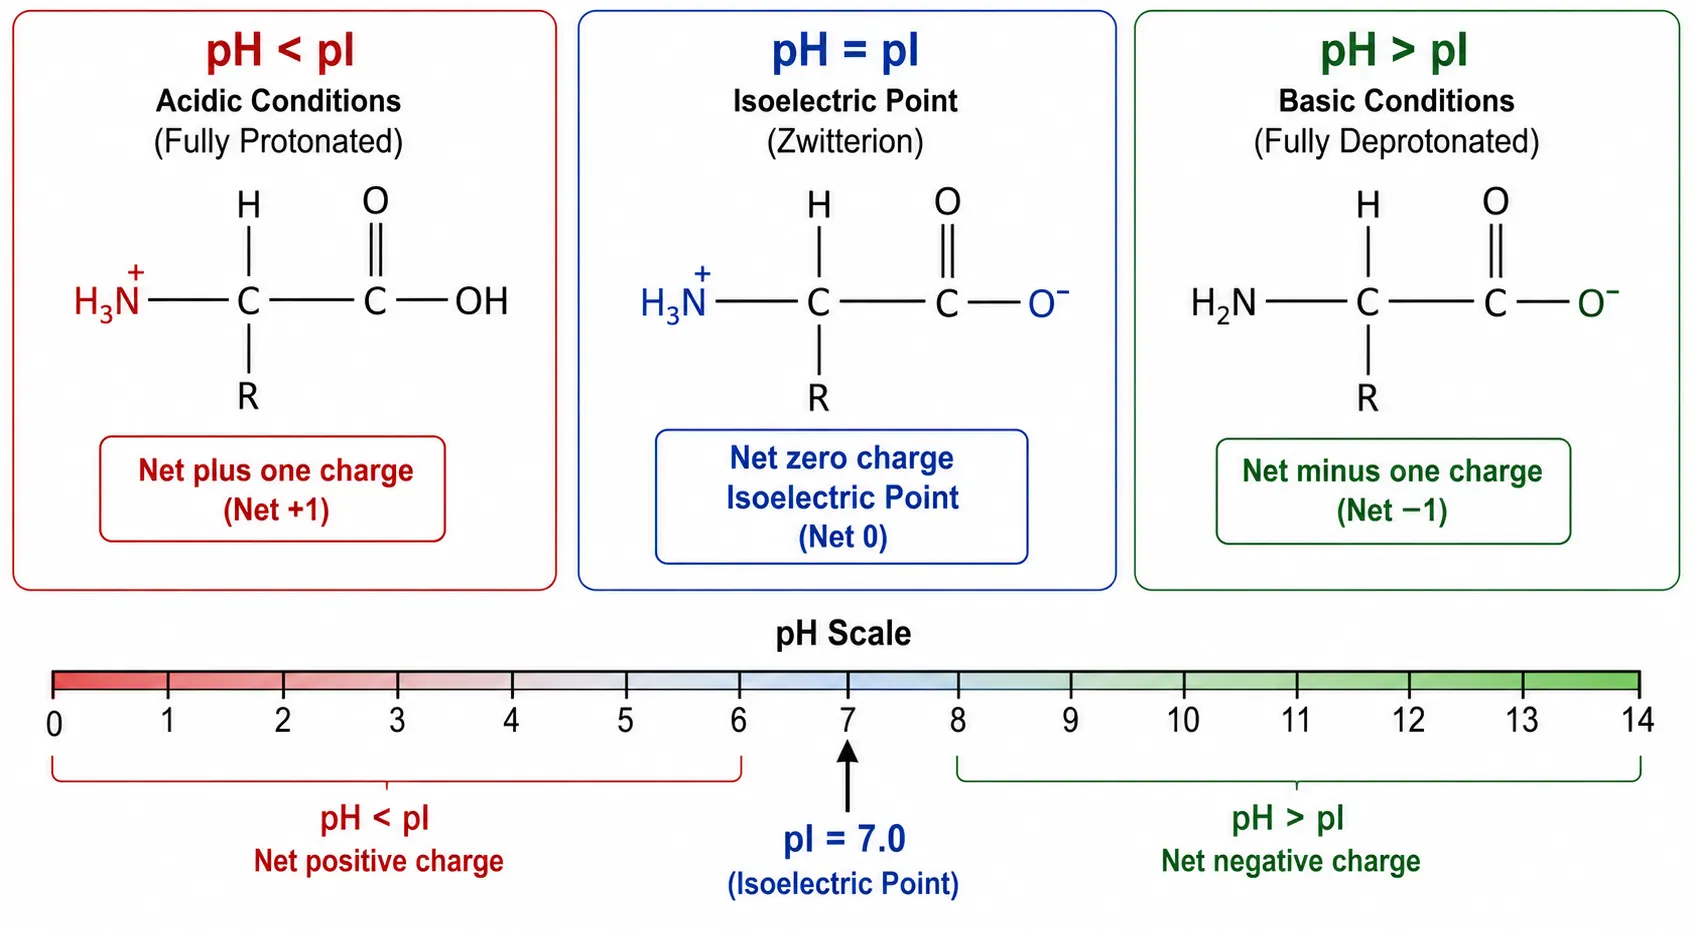
Amino acids are amphoteric molecules, meaning they contain both acidic and basic functional groups. Specifically, each standard amino acid possesses at least two ionizable groups: the alpha-carboxyl group and the alpha-amino group. In aqueous solution, the ionization state of these groups shifts with the surrounding pH. Under acidic conditions where the pH is low, the amino group becomes protonated and carries a positive charge while the carboxyl group remains neutral. Under basic conditions where the pH is high, the carboxyl group loses a proton and becomes negatively charged while the amino group is deprotonated and neutral. At the isoelectric point, the positive and negative charges balance exactly, and the molecule exists as a zwitterion, a neutral species that simultaneously carries both positive and negative charges on different functional groups.
Figure 1: Zwitterion Formation Across pH Range
This pH-dependent charge behavior has profound practical consequences. It forms the foundation for many of the most important biochemical separation techniques, including ion-exchange chromatography, isoelectric focusing, capillary isoelectric focusing, and precipitation-based purification methods. For biopharmaceutical proteins, accurate pI determination is explicitly required by regulatory guidelines from both the FDA and EMA as part of comprehensive physicochemical characterization packages. Creative Proteomics provides an Isoelectric Point Analysis Service that delivers high-resolution pI determination using advanced cIEF and icIEF platforms, supporting research workflows from early discovery through biosimilar comparability studies.
The Henderson-Hasselbalch Foundation
To properly understand pI calculation, one must first understand the Henderson-Hasselbalch equation, which quantitatively describes the relationship between solution pH and the ionization state of any weak acid or base. The equation is expressed as follows: pH equals pKa plus the logarithm of the ratio of the concentration of the conjugate base to the concentration of the weak acid.
In this equation, pKa is the negative logarithm of the acid dissociation constant. A lower pKa indicates a stronger acid that more readily donates its proton. When the solution pH equals the pKa of a given ionizable group, the concentrations of the protonated and deprotonated forms are exactly equal, meaning the group is fifty percent ionized. This relationship is fundamental to predicting charge states at any pH.
For an amino acid, the net molecular charge at any given pH can be calculated by summing the contributions of all ionizable groups. Each group contributes a charge that is weighted by its degree of ionization according to the Henderson-Hasselbalch equation. A carboxyl group contributes negative one charge when fully deprotonated and zero when protonated. An amino group contributes positive one charge when protonated and zero when deprotonated. The pI is defined as the pH at which the sum of all these individual group charges equals exactly zero.
For the simplest case, an amino acid with a neutral, non-ionizable side chain such as glycine or alanine, only two ionizable groups need to be considered. The derivation proceeds directly from the Henderson-Hasselbalch equation. At any given pH, the fraction of the carboxyl group that exists in the deprotonated negatively charged form can be calculated as ten raised to the power of pH minus pKa of the carboxyl group, divided by one plus the same quantity. Similarly, the fraction of the amino group that remains protonated in the positively charged form at any pH can be calculated as one divided by one plus ten raised to the power of pH minus pKa of the amino group.
Setting the net charge equation to zero and solving for pH yields the familiar and elegant formula used by nearly every biochemistry textbook: the pI is simply the arithmetic mean of the two relevant pKa values. The alpha-carboxyl group typically has a pKa in the range of 1.7 to 2.6, while the alpha-amino group has a pKa in the range of 8.7 to 10.7. Exactly midway between these two values lies the isoelectric point.
Figure 2: Henderson-Hasselbalch Titration Curve for Glycine
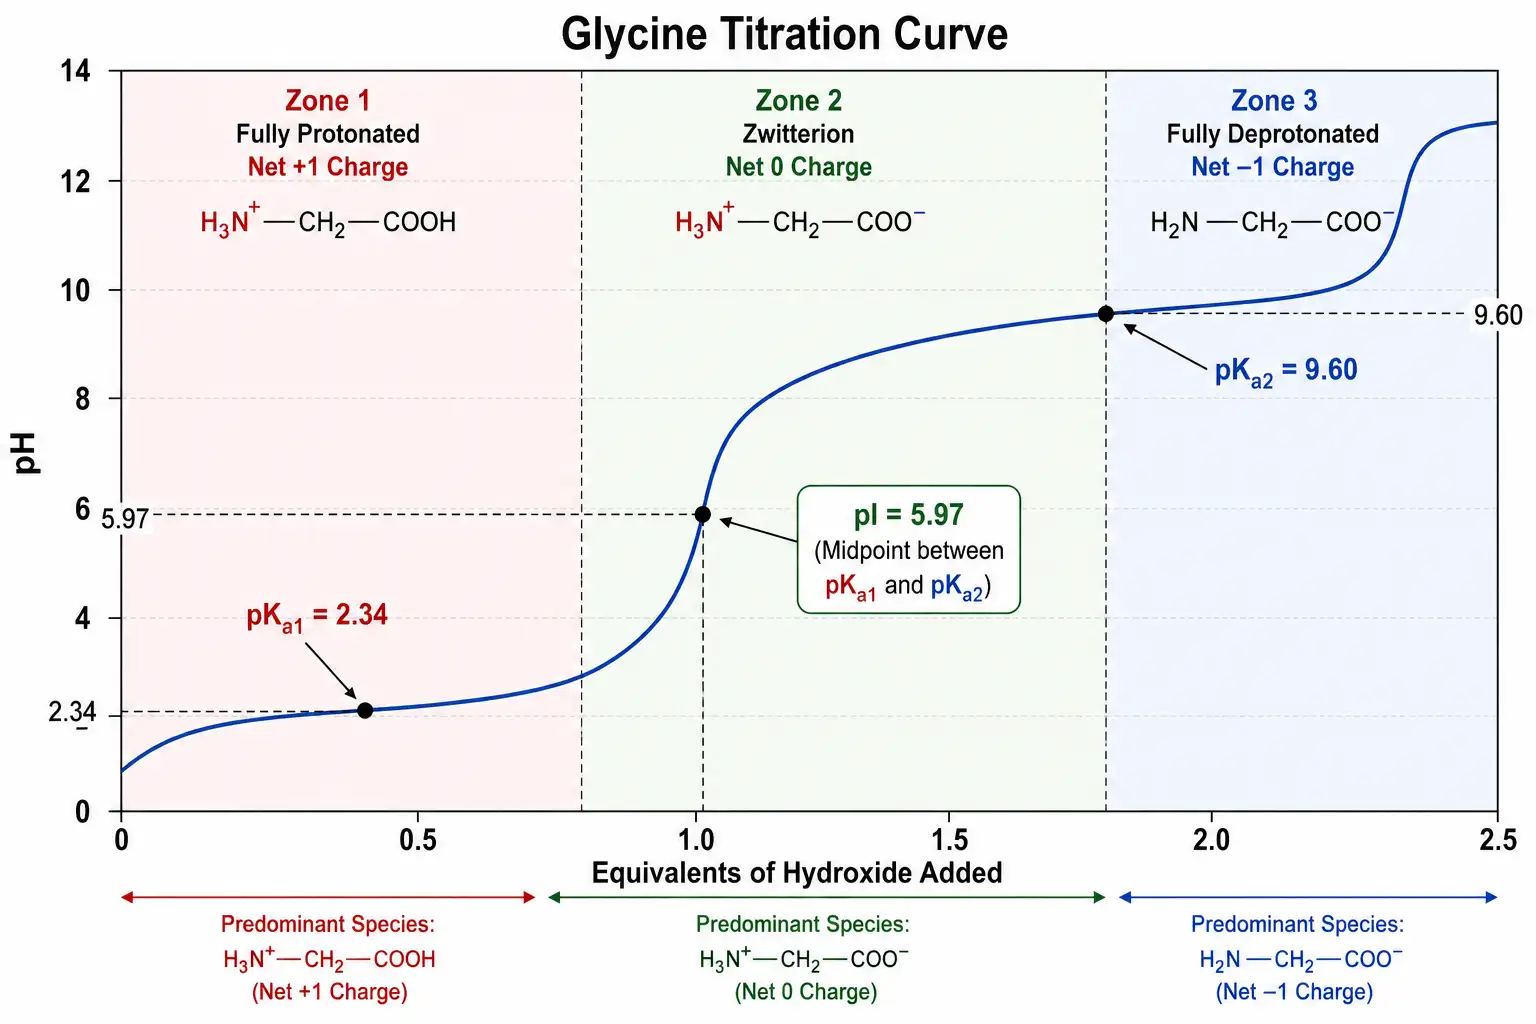
A concrete example helps illustrate this principle. Glycine, the simplest amino acid, has a pKa value of 2.34 for its alpha-carboxyl group and a pKa value of 9.60 for its alpha-amino group. The isoelectric point is therefore calculated as 2.34 plus 9.60 divided by 2, which equals 5.97. At this pH, glycine exists predominantly as the zwitterionic form in which the amino group carries a positive charge and the carboxyl group carries a negative charge, resulting in zero net charge. At any pH below 5.97, the molecule carries a net positive charge and will migrate toward the negative electrode in an electric field. At any pH above 5.97, the molecule carries a net negative charge and will migrate toward the positive electrode. This principle forms the basis for all electrophoretic separations of amino acids, peptides, and proteins.
Complete pI Table for All Twenty Standard Amino Acids
Researchers often need quick access to the isoelectric points of individual amino acids when designing experiments, interpreting data, or troubleshooting purification protocols. The following comprehensive table presents the isoelectric points for all twenty proteinogenic amino acids, organized by side-chain type with the corresponding pKa values used in each calculation. The table also indicates which two pKa values are averaged to obtain the pI, as the formula differs depending on whether the side chain is neutral, acidic, or basic.
Figure 3: pI Calculation Workflow for Three Amino Acid Categories
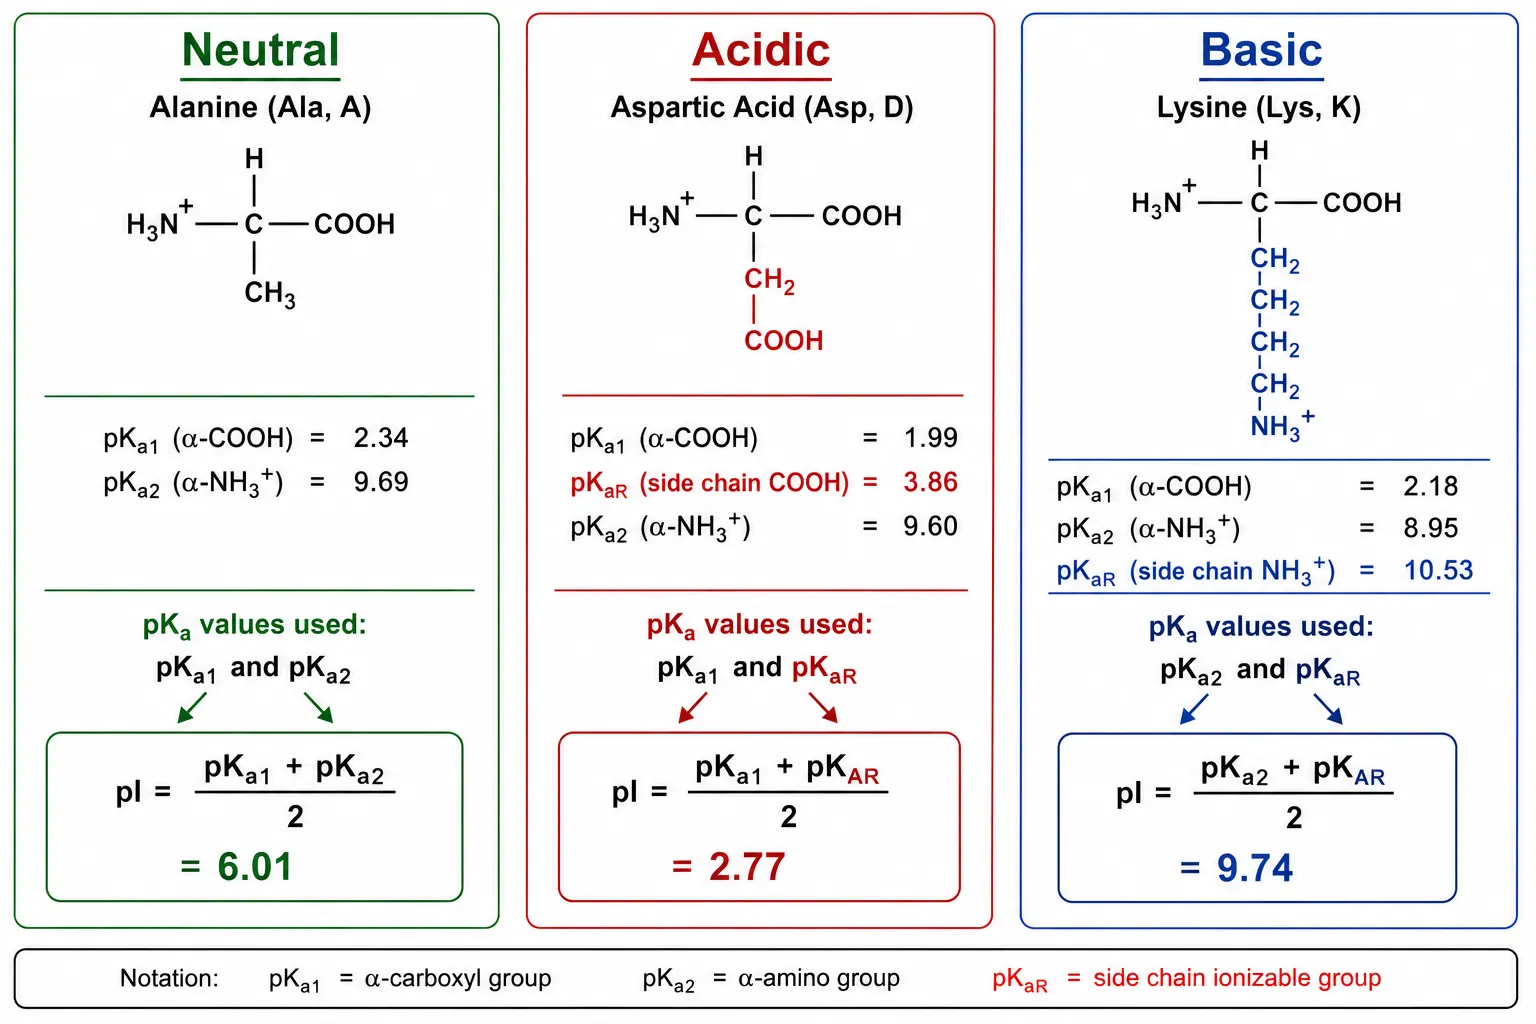
Neutral Amino Acids (Non-Ionizable Side Chains)
Neutral amino acids have side chains that do not contain additional ionizable groups, so their pI is simply the average of the alpha-carboxyl and alpha-amino pKa values. These fifteen amino acids cluster within a fairly narrow range from about pH 5.1 to pH 6.3. Their isoelectric points are similar because their side chains do not contribute any charge and the pKa values of the alpha-carboxyl and alpha-amino groups are relatively consistent across different amino acids. However, subtle differences in the pKa values caused by the inductive effects of different side chains produce meaningful variations in the final pI values.
| Amino Acid | Code | pKa1 | pKa2 | pI |
|---|---|---|---|---|
| Glycine | Gly | 2.34 | 9.60 | 5.97 |
| Alanine | Ala | 2.34 | 9.69 | 6.01 |
| Valine | Val | 2.32 | 9.62 | 5.97 |
| Leucine | Leu | 2.36 | 9.60 | 5.98 |
| Isoleucine | Ile | 2.36 | 9.68 | 6.02 |
| Methionine | Met | 2.28 | 9.21 | 5.74 |
| Phenylalanine | Phe | 1.83 | 9.13 | 5.48 |
| Proline | Pro | 1.99 | 10.60 | 6.30 |
| Serine | Ser | 2.21 | 9.15 | 5.68 |
| Threonine | Thr | 2.09 | 9.10 | 5.60 |
| Cysteine | Cys | 1.96 | 10.28 | 5.07 |
| Tyrosine | Tyr | 2.20 | 9.11 | 5.66 |
| Asparagine | Asn | 2.02 | 8.80 | 5.41 |
| Glutamine | Gln | 2.17 | 9.13 | 5.65 |
| Tryptophan | Trp | 2.83 | 9.39 | 5.89 |
Acidic Amino Acids (Negatively Charged Side Chains)
Acidic amino acids, aspartic acid and glutamic acid, have side chains that contain an additional carboxyl group. This extra ionizable group has a pKa in the acidic range, approximately 3.65 for aspartic acid and 4.25 for glutamic acid. The presence of this second acidic group dramatically lowers the isoelectric point. To calculate the pI correctly, one must average the two lowest pKa values, which are the alpha-carboxyl and the side-chain carboxyl. The resulting pI values of 2.77 for aspartic acid and 3.22 for glutamic acid are far below those of the neutral amino acids.
| Amino Acid | Code | pKa1 | pKa2 | pKaR | pI |
|---|---|---|---|---|---|
| Aspartic Acid | Asp | 1.88 | 9.60 | 3.65 | 2.77 |
| Glutamic Acid | Glu | 2.19 | 9.67 | 4.25 | 3.22 |
Basic Amino Acids (Positively Charged Side Chains)
Basic amino acids, lysine, arginine, and histidine, have side chains that contain additional basic groups. Lysine has an epsilon-amino group with a pKa of 10.53. Arginine has a guanidino group with a pKa of 12.48. Histidine has an imidazole ring with a pKa of 6.00. For basic amino acids, the correct pI calculation averages the two highest pKa values, which are the alpha-amino group and the side-chain basic group. This produces significantly higher pI values, ranging from 7.59 for histidine to 10.76 for arginine.
Histidine deserves particular attention because its imidazole side chain has a pKa of 6.00, which is very close to physiological pH of 7.4. The resulting pI of 7.59 means that histidine exists in a nearly fifty-fifty equilibrium between protonated and deprotonated forms at physiological conditions. This unique property allows histidine to function as a pH sensor in proteins. Small changes in local pH near enzyme active sites or protein-protein interfaces can flip the charge state of histidine residues, triggering conformational changes or modulating binding affinity. This is why histidine is so frequently found in the active sites of enzymes and at protein interaction interfaces.
| Amino Acid | Code | pKa1 | pKa2 | pKaR | pI |
|---|---|---|---|---|---|
| Histidine | His | 1.82 | 9.17 | 6.00 | 7.59 |
| Lysine | Lys | 2.18 | 8.95 | 10.53 | 9.74 |
| Arginine | Arg | 2.17 | 9.04 | 12.48 | 10.76 |
Calculation Methodology for Each Category
Understanding that the pI calculation formula is not universal but depends on the side-chain type is one of the most important concepts in amino acid chemistry. Using the wrong formula can produce pI errors of two to four pH units, which would completely misguide protein purification and formulation decisions. This section provides detailed step-by-step methods for each category.
Neutral Amino Acids — Two pKa Values
For neutral amino acids with non-ionizable side chains, the calculation is straightforward. Only the alpha-carboxyl and alpha-amino groups participate in the charge balance at the isoelectric point. The isoelectric point is simply the arithmetic mean of the two pKa values that bracket the zwitterionic form. Alanine provides a clean example with a pKa of 2.34 for the alpha-carboxyl and 9.69 for the alpha-amino group, giving a pI of 6.01. One can verify this result by applying the Henderson-Hasselbalch equation to calculate the charge on each group at pH 6.01. The carboxyl group is approximately 99.99 percent deprotonated, contributing a charge of negative 0.9999. The amino group is approximately 99.98 percent protonated, contributing a charge of positive 0.9998. The sum is effectively zero. This same approach works for all fifteen neutral amino acids listed in the table.
Acidic Amino Acids — Three pKa Values
For acidic amino acids, the presence of a third ionizable group on the side chain requires a modified approach. The side-chain carboxyl of aspartic acid has a pKa of 3.65, which falls between the alpha-carboxyl pKa of 1.88 and the alpha-amino pKa of 9.60. At the isoelectric point, the alpha-carboxyl and the side-chain carboxyl are approximately half-dissociated while the alpha-amino group remains fully protonated. The correct calculation therefore averages the two lowest pKa values. For aspartic acid, this gives a pI of 2.77. If one incorrectly applied the simple formula for neutral amino acids, the result would be 5.74, an error of nearly three pH units that would lead to entirely wrong purification and formulation decisions.
Basic Amino Acids — Three pKa Values
For basic amino acids, the situation is inverted. The side chain contains an additional basic group whose pKa is higher than that of the alpha-amino group. At the isoelectric point, the alpha-carboxyl is fully deprotonated while both the alpha-amino group and the side-chain basic group are approximately half-deprotonated. The correct calculation averages the two highest pKa values. For lysine, this gives a pI of 9.74. For arginine with its exceptionally high guanidino pKa of 12.48, the pI reaches 10.76, the highest among all standard amino acids. This means arginine remains positively charged even under strongly basic conditions, a property that is exploited in the design of arginine-rich cell-penetrating peptides.
Histidine — Special Case
Histidine occupies a special position because its imidazole side chain pKa of 6.00 falls between the alpha-carboxyl and alpha-amino pKa values. The same formula used for basic amino acids applies, giving a pI of 7.59. The biological significance of this value cannot be overstated. At pH 7.4, histidine is nearly charge-neutral, meaning subtle shifts in local pH can flip its charge state. This makes histidine an ideal residue for pH sensing in proteins, for catalytic mechanisms that require proton transfer, and for pH-dependent conformational changes. Many enzymes use active-site histidine residues as general acid-base catalysts precisely because their pKa is tunable by the surrounding protein environment.
What the pI Tells You About Protein Behavior
Solubility Profile
The practical value of understanding pI extends far beyond the amino acid level. For full-length proteins, the pI influences nearly every aspect of their behavior in solution. At the isoelectric point, a protein carries zero net charge. The absence of electrostatic repulsion between molecules allows them to approach each other more closely, promoting aggregation through hydrophobic interactions and van der Waals forces. This has direct practical consequences for solubility, purification, and formulation.
Below the pI, a protein carries net positive charge. The electrostatic repulsion between like-charged molecules keeps them dispersed in solution and enhances solubility. Above the pI, the protein carries net negative charge, and similar repulsive forces maintain solubility. At the isoelectric point precisely, solubility reaches its minimum while the tendency to precipitate reaches its maximum. This principle is exploited in isoelectric precipitation, a preparative technique where the solution pH is adjusted to the pI of a target protein to selectively precipitate it while leaving more soluble contaminants in solution.
For biopharmaceutical formulation development, this solubility relationship dictates a critical design rule. The formulation pH must be maintained at least one to two pH units away from the protein's pI to ensure adequate electrostatic repulsion and prevent aggregation. A monoclonal antibody with an isoelectric point of 8.5, for example, should be formulated in a buffer at pH 5.5 to 6.5 rather than at pH 7.0 to 8.0. Operating near the pI would risk aggregation, precipitation, and loss of therapeutic activity. The pH-solubility relationship also explains why certain proteins can be selectively precipitated from complex mixtures by simply adjusting the buffer pH to match their pI, a technique that remains valuable in industrial protein purification.
Ion-Exchange Chromatography Strategy
Figure 4: Ion-Exchange Chromatography Decision Flowchart Based on pI
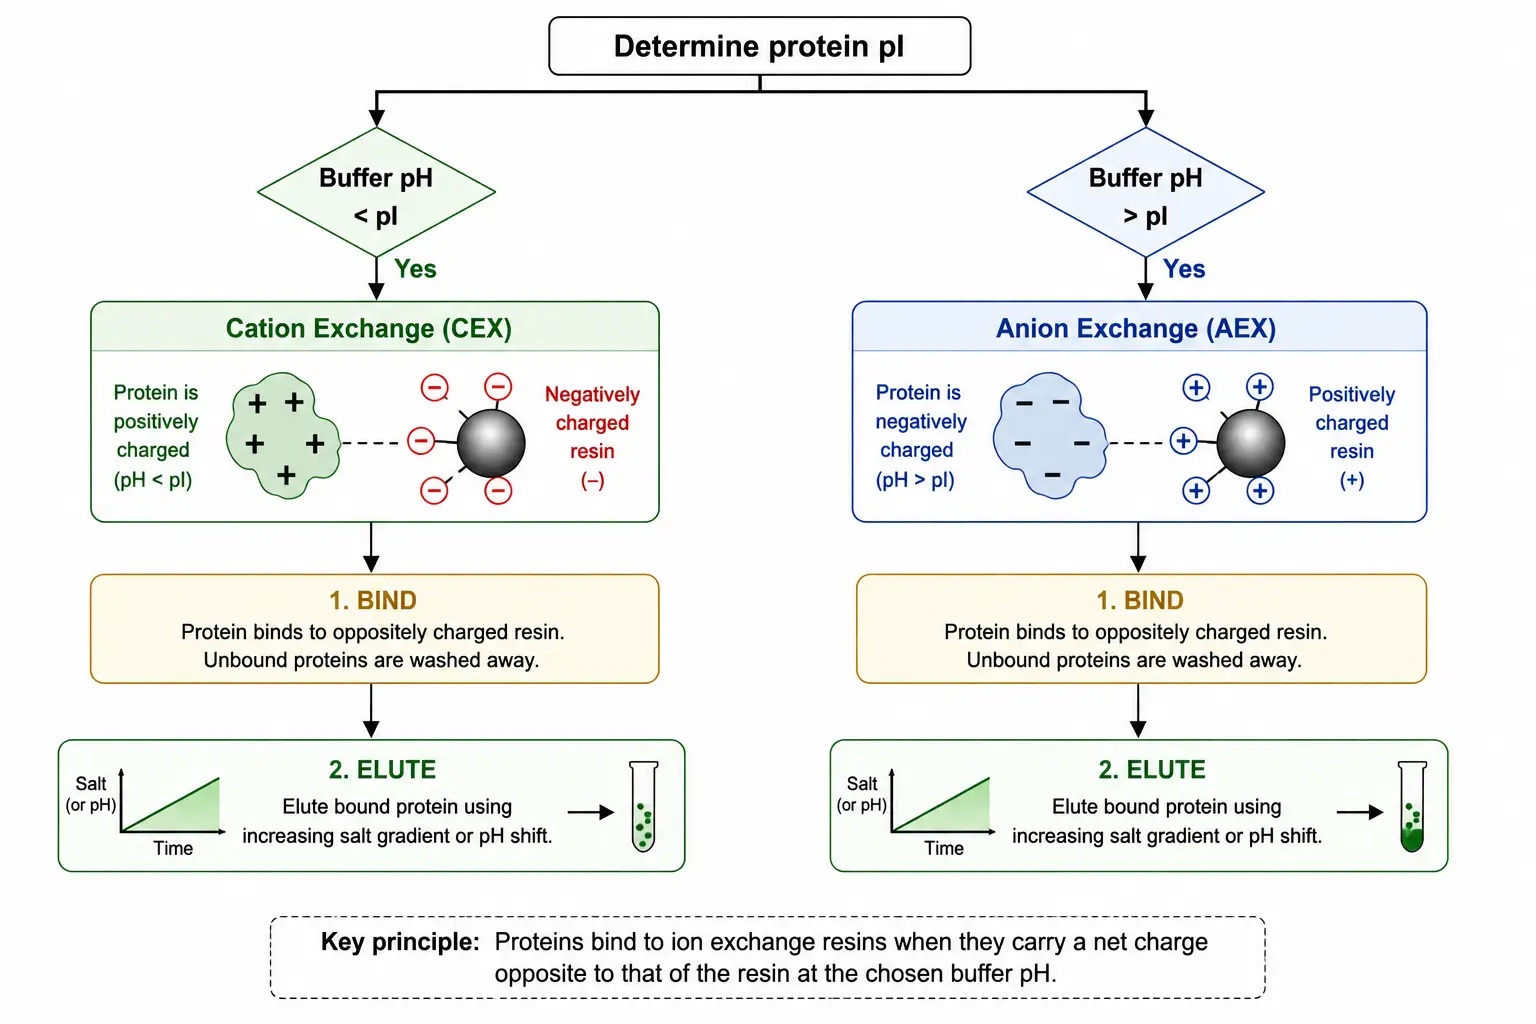
The pI also directly determines the optimal ion-exchange chromatography strategy. If the operating buffer pH is below the pI, the protein carries net positive charge and will bind to cation-exchange resins, which carry negatively charged functional groups such as sulfonate or carboxyl moieties. If the operating buffer pH is above the pI, the protein carries net negative charge and will bind to anion-exchange resins carrying positively charged quaternary amine or diethylaminoethyl groups. The practical decision framework for IEX method development begins with determining or estimating the pI from sequence data or experimental measurement. The appropriate resin type is selected based on the relationship between operating pH and pI. A binding pH is chosen that provides sufficient charge density, typically 0.5 to 1.5 pH units away from the pI. Finally, the elution gradient is designed using either increasing salt concentration or a gradual pH shift back toward the pI.
pI in Protein Characterization Workflows
Experimental pI determination also plays a central role in comprehensive protein characterization workflows, from confirming product identity to detecting charge variants. The relationship between amino acid composition and pI connects directly to amino acid analysis, which quantifies the exact composition of a protein sample. Accurate amino acid composition data provides the foundation for understanding why a given protein exhibits a particular pI value and for predicting how sequence variants might alter that value. Creative Proteomics Amino Acid Analysis (AAA) Service delivers precise compositional data that supports pI validation and protein identification workflows.
Methods for Experimental pI Determination
While calculated pI values from sequence data provide a useful starting point, experimental determination is often necessary, particularly for proteins that carry post-translational modifications, for proteins whose three-dimensional structure creates unusual pKa shifts in specific residues, or for regulatory submissions that require experimentally determined physicochemical parameters.
Capillary Isoelectric Focusing (cIEF)
Capillary isoelectric focusing, commonly referred to as cIEF, is the most widely used method for high-resolution pI determination in both research and quality control environments. In this technique, a fused-silica capillary is filled with a mixture of carrier ampholytes, which are low-molecular-weight amphoteric molecules that establish a stable pH gradient when an electric field is applied. The protein sample is introduced into the capillary and migrates under the influence of the electric field until it reaches the pH zone that matches its pI. At that point, the protein net charge becomes zero and electromigration ceases. Detection is achieved by mobilizing the focused zones past a UV absorbance detector, typically by applying pressure or by adding salt to one electrode reservoir. The key performance specifications for cIEF include a resolution of 0.02 to 0.05 pH units, which is sufficient to distinguish charge variants differing by a single deamidation event. The reproducibility is excellent with a standard deviation of less than 0.1 pH units, while sample requirements are modest at 0.1 to 1.0 milligrams per milliliter. The analysis time is typically 20 to 40 minutes per run.
Imaging Capillary IEF (icIEF)
Imaging capillary isoelectric focusing, or icIEF, represents a significant advancement over conventional cIEF by using whole-capillary imaging detection. Instead of mobilizing focused zones past a fixed detector, icIEF illuminates the entire capillary column and uses a charge-coupled device camera to capture the focused protein bands in real time. This eliminates the mobilization step entirely, along with the peak distortion that can occur during mobilization. The advantages of icIEF include no mobilization step and therefore no risk of peak distortion, real-time monitoring of the focusing process, better resolution of closely spaced variants, and a reduced analysis time of 10 to 15 minutes per run. For quality control environments where regulatory-grade data integrity is paramount, icIEF has become the preferred method. It is widely used for charge variant analysis of therapeutic antibodies, biosimilar comparability studies, and lot-release testing.
Figure 5: cIEF vs icIEF vs Gel IEF Method Comparison
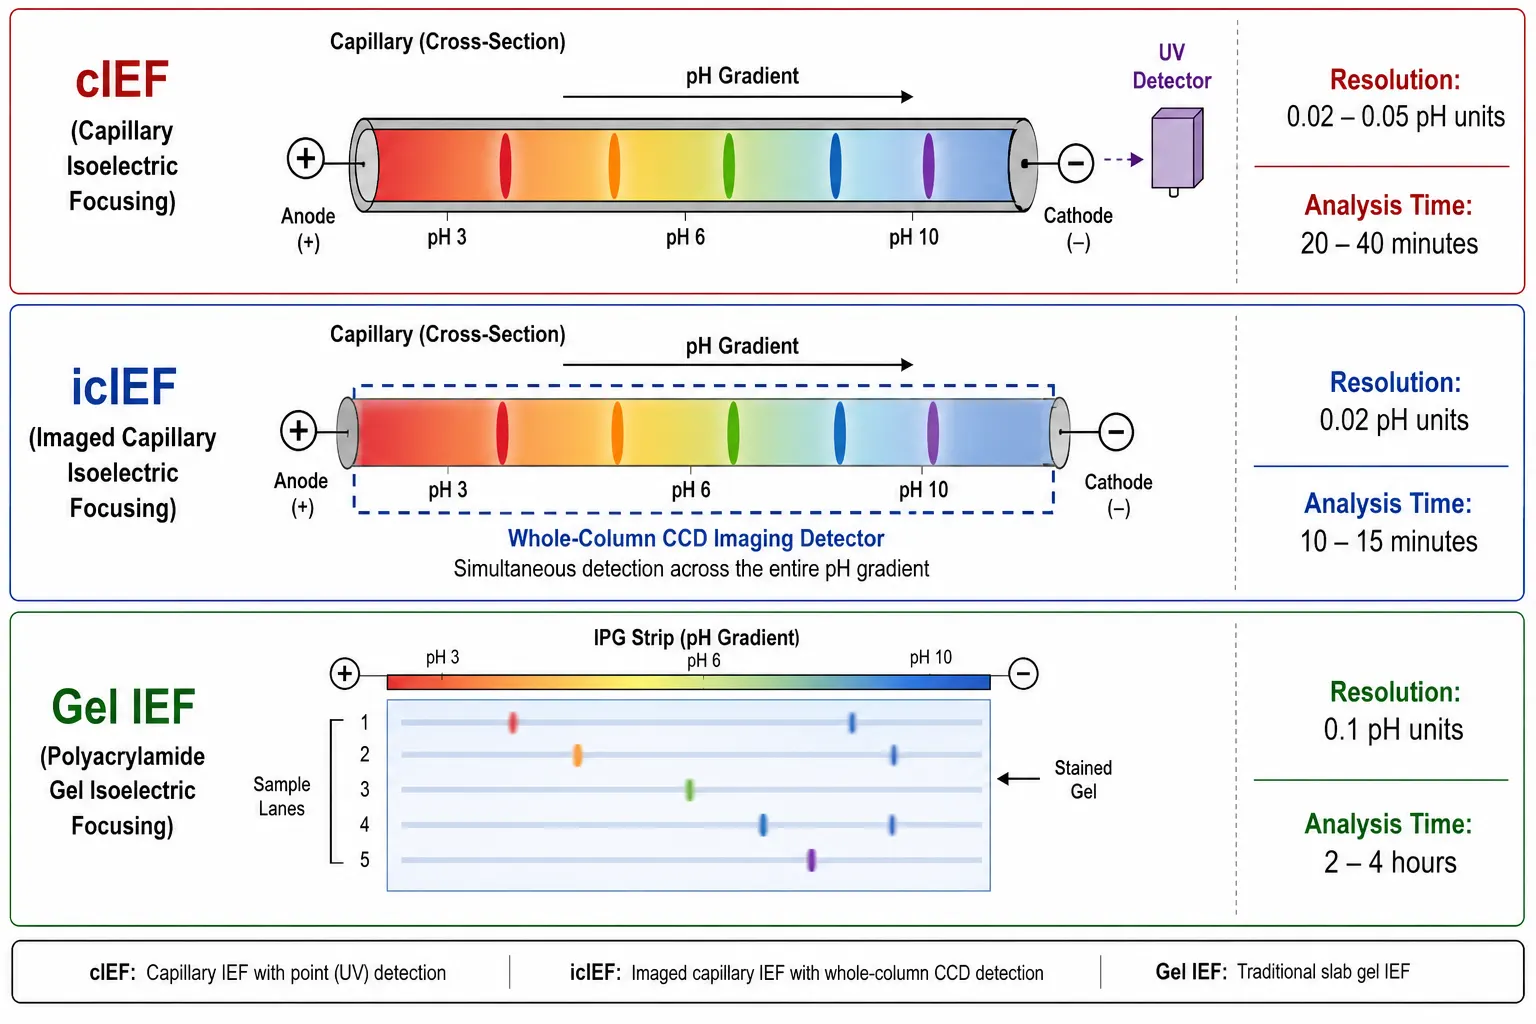
Gel-Based IEF
Traditional gel-based isoelectric focusing uses immobilized pH gradient strips or carrier ampholyte-generated gradients in a polyacrylamide gel matrix. After focusing, the gel is fixed and stained to visualize the separated protein bands. While gel IEF offers lower throughput and resolution compared to capillary methods, it allows simultaneous comparison of multiple samples on a single gel, which can be useful for screening applications. Typical uses include purity assessment of recombinant proteins during early process development and comparison of samples before and after modification treatments.
LC-MS/MS-Based Charge Characterization
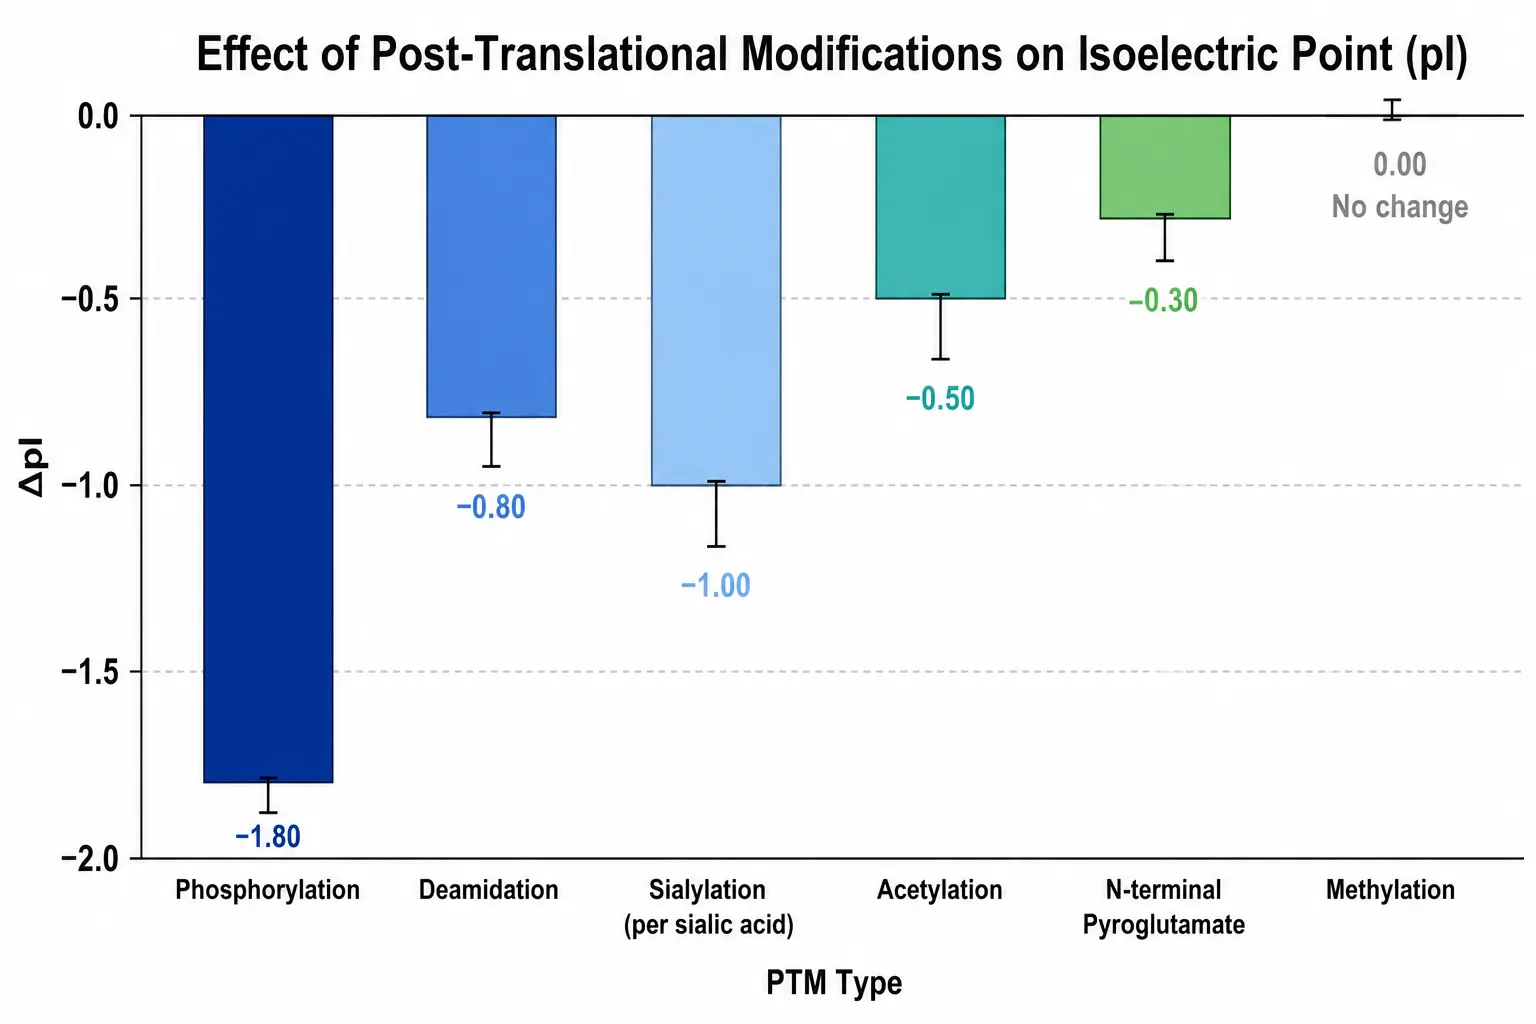
Liquid chromatography-tandem mass spectrometry provides complementary pI information by identifying and quantifying specific post-translational modifications that alter protein charge. Each modification type shifts the pI in a predictable direction. Phosphorylation adds two negative charges per phosphate group and decreases the pI by approximately 0.3 to 0.5 pH units per site. Deamidation, which converts asparagine to aspartic acid or glutamine to glutamic acid, adds one negative charge and decreases the pI. Sialylation of glycans adds one negative charge per sialic acid residue. Acetylation of lysine side chains removes one positive charge. Methylation of lysine or arginine does not alter charge and produces no pI shift. Oxidation of methionine or tryptophan likewise has no effect on charge.
By identifying and quantifying these modifications, LC-MS/MS provides a molecular explanation for observed pI heterogeneity. A monoclonal antibody that shows multiple acidic peaks in icIEF analysis, for example, can be analyzed by LC-MS/MS to determine whether those peaks arise from deamidation, sialylation, phosphorylation, or a combination of modifications. This makes LC-MS/MS a complementary tool to cIEF and icIEF rather than a replacement. Creative Proteomics Protein Identification Services and Characterization of Protein Structure integrate LC-MS/MS with pI determination for comprehensive protein characterization.
Figure 6: PTM Effects on pI Bar Chart
Method Selection Guide
Researchers choosing among these methods should consider their specific requirements. For a single high-resolution pI value with minimal sample consumption, cIEF provides an excellent balance of resolution, automation, and throughput. For quality control environments requiring regulatory-grade reproducibility, icIEF is the method of choice. For screening multiple samples in parallel, gel IEF remains practical. For comprehensive characterization that requires both pI measurement and molecular-level explanation of charge heterogeneity, combining icIEF with LC-MS/MS provides the most complete picture.
Practical Applications in Research and Biopharmaceutical Development
Protein Purification Development
The pI serves as the starting point for rational design of ion-exchange chromatography purification steps. A typical workflow proceeds through five stages. The first stage involves calculating the theoretical pI from the amino acid sequence using established computational tools such as ExPASy Compute pI or the Isoelectric Point Calculator. The second stage involves estimating the empirical pI via cIEF if post-translational modifications are anticipated. The third stage involves selecting the appropriate resin type based on the relationship between operating pH and pI. The fourth stage involves optimizing the binding pH by screening a range of values approximately 0.5 pH units above and below the initial choice. The fifth stage involves designing the elution gradient, typically using either a salt gradient from zero to 500 millimolar sodium chloride or a pH gradient that gradually approaches the pI.
Formulation Development
For therapeutic protein formulation development, pI is a critical parameter that directly influences stability testing strategies. The formulation pH must be maintained at least one full pH unit away from the protein pI to ensure adequate electrostatic repulsion between protein molecules. The buffer system should be chosen so that its pKa falls within 0.5 pH units of the target pH to provide sufficient buffering capacity. Additionally, the excipients used in formulations can themselves affect solution pH and charge interactions. Arginine with its pI of 10.76 and histidine with its pI of 7.59 are common formulation excipients that also influence protein solubility. Their effects on the solution environment must be carefully evaluated during pre-formulation studies.
Biosimilar Comparability
Regulatory agencies require that biosimilar products demonstrate comparable charge profiles to their reference products as part of the physicochemical characterization package. Imaging capillary IEF has become the method of choice for these comparisons. Typical acceptance criteria require that the main peak pI falls within plus or minus 0.1 pH units of the reference product and that the overall charge variant distribution is similar. Protein Purity and Homogeneity Characterization is an essential component of biosimilar development programs that must address these regulatory requirements.
Antibody Charge Variant Analysis
Monoclonal antibodies characteristically exhibit multiple charge variants that arise from common post-translational and chemical modifications. C-terminal lysine clipping produces basic variants that have slightly higher pI values. Deamidation of asparagine residues in complementarity-determining regions produces acidic variants with lower pI values. Glycosylation heterogeneity, particularly through terminal sialylation, introduces additional acidic variants. Oxidation of methionine residues does not alter charge directly but may be enriched in certain charge variant fractions. Capillary IEF and imaging IEF separate these variants based on pI differences as small as 0.02 to 0.05 pH units, enabling accurate quantification of each variant population. Charge variant distribution is now recognized as a critical quality attribute for batch release and stability monitoring of therapeutic antibodies.
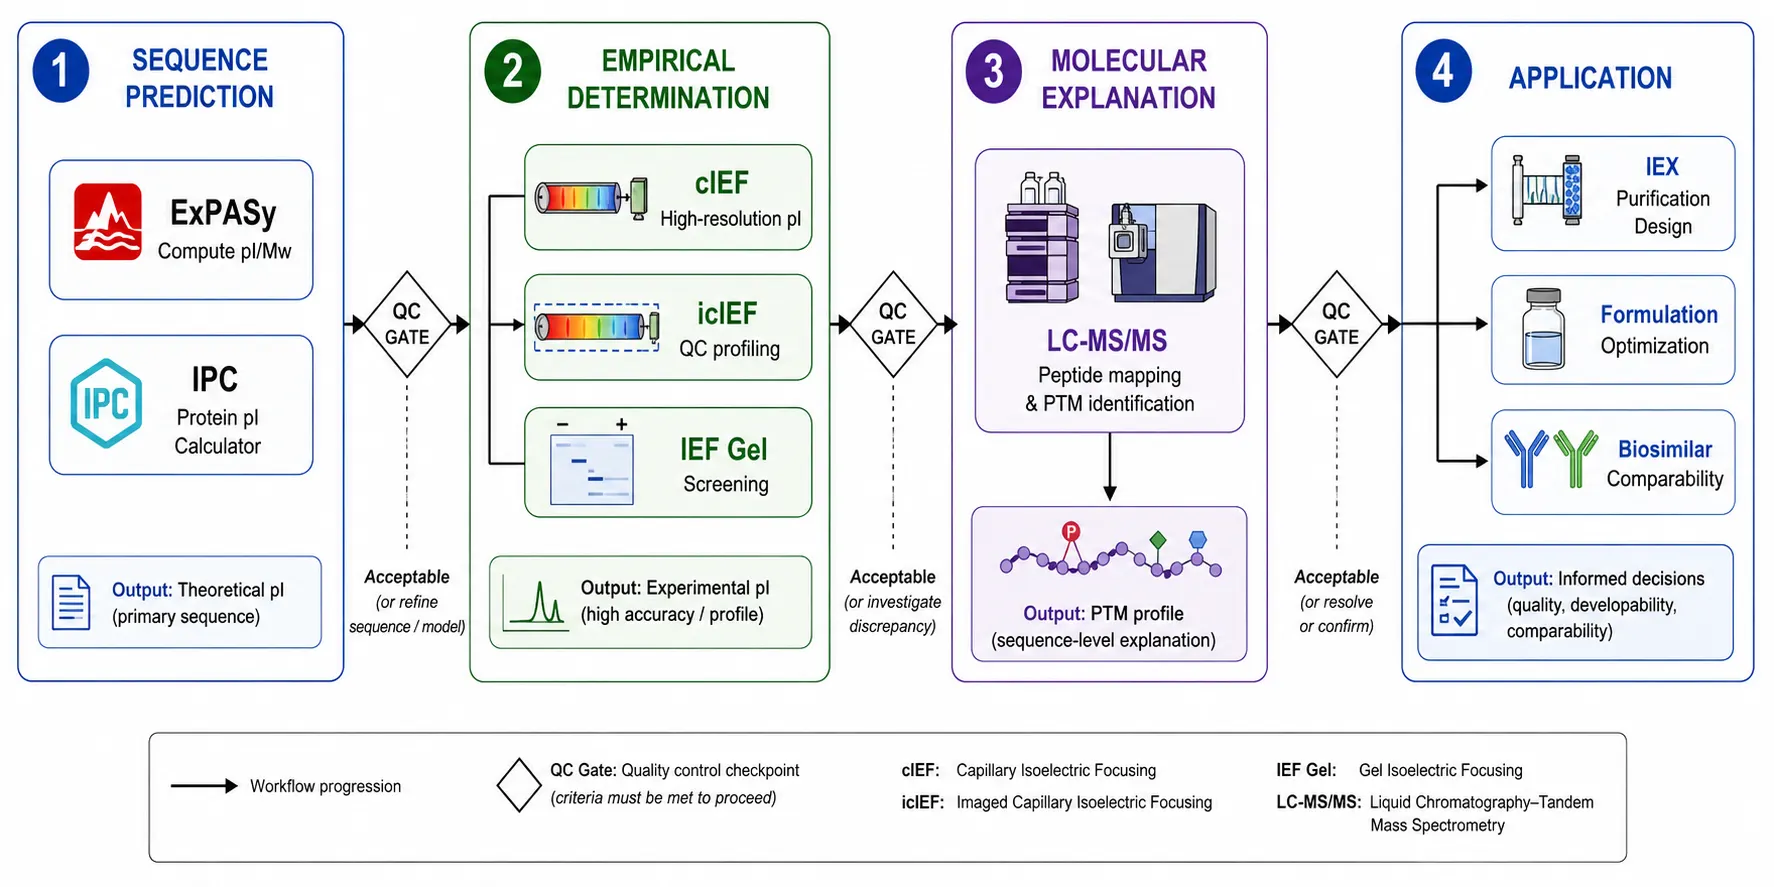
Figure 7: Integrative pI Characterization Workflow Pipeline
Common Pitfalls in pI Calculation and Determination
Several common errors can lead to inaccurate pI values and misguided experimental decisions. The most critical mistake is using the wrong formula for acidic or basic amino acids. Applying the simple neutral formula to aspartic acid gives a pI of approximately 5.7, whereas the correct value is 2.77. This difference of nearly three pH units would completely misguide the design of any ion-exchange purification step.
A second major pitfall is ignoring pKa shifts that occur in folded proteins. When an amino acid residue is buried within a hydrophobic protein core, its pKa can shift by three to four pH units because the local dielectric environment is very different from that of an aqueous solution. A histidine residue exposed on the protein surface may have a normal pKa of 6.0, but the same residue buried in a hydrophobic environment may have a pKa as low as 4.5 to 5.0. These shifts dramatically alter the calculated pI.
A third common error is confusing calculated and experimental pI values. Theoretical pI values from sequence-based tools assume a fully unfolded, fully solvated polypeptide chain with no modifications. In reality, post-translational modifications, bound ligands, cofactors, and the three-dimensional protein structure can shift the empirical pI by 0.5 to 1.5 pH units. The calculated value should always be considered an approximation that requires experimental verification.
Additional pitfalls include carrier ampholyte batch-to-batch variation in cIEF, which can cause pH gradient drift and measurement errors of 0.1 to 0.2 pH units. Sample precipitation during focusing near the pI can bias the measured distribution toward species that remain soluble. Incomplete desalting of samples before cIEF causes current leakage and poor focusing. Using inconsistent pKa reference data from different sources leads to irreproducible calculated values. And high protein concentrations in cIEF can alter the observed focused position through protein-protein interactions.
Frequently Asked Questions
What is the difference between pI and pKa?
pKa is a group-specific property that describes the pH at which a single ionizable group is fifty percent dissociated. A molecule can have multiple pKa values, one for each ionizable group it contains. In contrast, pI is a molecule-wide property that describes the pH at which the net charge of the entire molecule equals exactly zero. The two quantities are related because pI is calculated from the pKa values of all relevant ionizable groups, but they describe fundamentally different aspects of molecular behavior.
Can a protein have more than one pI?
A homogeneous protein population with a uniform modification state has exactly one defined pI. However, real protein samples are rarely homogeneous. They contain charge variants with different post-translational modification profiles, and each distinct variant has a slightly different pI value. This produces the characteristic charge variant distribution observed in cIEF and icIEF analyses, where the main peak represents the most abundant species while smaller peaks on either side represent acidic and basic variants.
Why does my calculated pI differ from the experimental value?
This is a very common question in protein characterization. Common reasons include post-translational modifications that alter charge, three-dimensional structure-induced pKa shifts in individual residues, bound ligands or cofactors that contribute charge, and inaccurate pKa values used in the calculation. A difference of 0.3 to 0.5 pH units is normal. A difference exceeding 1.0 pH unit warrants further investigation into potential modifications or structural effects.
How do I choose between cIEF and icIEF?
For routine pI determination in a research setting where high throughput is not the primary concern, either method works well. The choice often comes down to instrument availability and user preference. For quality control applications requiring regulatory-grade data integrity and maximum reproducibility, icIEF is the preferred choice because the elimination of the mobilization step reduces peak distortion and improves precision across runs and between laboratories.
Does pI predict protein behavior in all chromatographic systems?
No. While pI is an excellent predictor for ion-exchange chromatography, it does not directly predict behavior in hydrophobic interaction chromatography, size-exclusion chromatography, or affinity chromatography.
What is the most accurate method for pI determination?
Imaging capillary IEF offers the best combination of high resolution at 0.02 pH units, excellent reproducibility with standard deviation less than 0.1 pH units, and rapid throughput at 10 to 15 minutes per sample. Internal pI markers with known values are co-run with each sample to provide accurate calibration across the entire pH gradient.
How do post-translational modifications affect pI?
Phosphorylation adds two negative charges per site and decreases pI by 0.3 to 0.5 pH units per event. Deamidation adds one negative charge and decreases pI. Sialylation adds one negative charge per sialic acid. Acetylation removes one positive charge and decreases pI. These effects are additive, so a protein with five phosphorylation sites can show a pI decrease of 1.5 to 2.5 pH units.
What sample preparation is needed for cIEF?
Samples must be desalted to remove ions that interfere with pH gradient formation, clarified by centrifugation or filtration to remove particulates, and mixed with carrier ampholytes at approximately two percent weight per volume. Internal pI markers should be included for calibration. The typical protein concentration range is 0.1 to 1.0 milligrams per milliliter, although lower concentrations can be used with more sensitive detection methods such as laser-induced fluorescence.
Can pI be determined for membrane proteins?
Yes, but with significant difficulty and careful method optimization. Membrane proteins require detergents for solubilization, and these detergents can interfere with the pH gradient in cIEF by altering the electrophoretic mobility of carrier ampholytes. Specialized protocols using non-ionic or zwitterionic detergents at low concentrations of 0.1 to 0.5 percent weight per volume have been developed, but resolution is typically lower than for soluble proteins.
Why is pI important for protein crystallization?
Crystallization is often optimal near the pI because reduced solubility promotes ordered crystal formation through controlled protein-protein contacts. At pH values near the pI, protein molecules have less electrostatic repulsion, which allows them to pack into ordered crystal lattices more readily. However, the minimum of solubility at the pI can also lead to amorphous precipitation rather than ordered crystal growth. Fine pH screening at increments of 0.5 pH units around the estimated pI is therefore recommended as part of any crystallization screen design. This careful balancing act between promoting crystal formation and avoiding precipitation is a key challenge in structural biology.
References
- Sillero, A., and Ribeiro, J. M. (1989). Isoelectric points of proteins: A table and a program for their determination. Analytical Biochemistry, 179, 319-325. doi:10.1016/0003-2697(89)90136-X
- Patrickios, C. S., and Yamasaki, E. N. (1995). Polypeptide amino acid composition and isoelectric point. Analytical Biochemistry, 231, 82-91. doi:10.1006/abio.1995.1503
- Kasicka, V. (2012). Recent advances in capillary electrophoresis and isoelectric focusing of peptides and proteins. Proteomics, 12, 2907-2918. doi:10.1002/pmic.201200378
- Bjellqvist, B., Hughes, G. J., Pasquali, C., Paquet, N., Ravier, F., Sanchez, J. C., Frutiger, S., and Hochstrasser, D. F. (1993). The focusing positions of polypeptides in immobilized pH gradients can be predicted from their amino acid sequences. Electrophoresis, 14, 1023-1031. doi:10.1002/elps.11501401163
- Hallgren, E., Kalman, F., Farnan, D., Horvath, C., and Stahlberg, J. (2000). Protein retention in ion-exchange chromatography: effect of net charge and charge distribution. Journal of Chromatography A, 877, 13-24. doi:10.1016/S0021-9673(00)00190-4