


The Two Pyrimidine Nucleotide Synthesis Routes — De Novo and Salvage
CAD — The Trifunctional Enzyme That Controls De Novo Pyrimidine Flux
DHODH — The Mitochondrial Gatekeeper and a Drug Target
Analysis of Pyrimidine Nucleotide Pools by LC-MS/MS
Pyrimidine Metabolism as a Drug Target Readout in Preclinical Research
Salvage Pathway — Thymidine Kinase and Nucleoside Analogs
When Pyrimidine Degradation Matters — DPD and Its Role in Preclinical Models
Pyrimidine Metabolism and the Tumor Immune Microenvironment — Emerging Research Directions
FAQ
Pyrimidine nucleotides — cytidine triphosphate (CTP), uridine triphosphate (UTP), thymidine triphosphate (TTP), and their mono- and diphosphate forms — are essential building blocks for RNA and DNA synthesis, membrane lipid biosynthesis via CDP-choline and CDP-diacylglycerol, and glycoconjugate formation through UDP-sugars. The pyrimidine biosynthetic pathway is organized around two entry routes — de novo synthesis from glutamine, bicarbonate, and aspartate, and salvage from preformed nucleobases and nucleosides — each with distinct regulatory logic and analytical requirements. This guide provides a research-oriented overview of pyrimidine metabolism from the perspective of LC-MS/MS-based analysis, covering the key enzymes, regulatory switches, drug-target interfaces, and quantitative methods applicable to preclinical metabolism studies. The focus is on how these pathways are measured, how pathway inhibition is detected as a pharmacodynamic readout, and how recent discoveries (2024-2025) linking pyrimidine metabolism to glycolysis, apoptosis, ferroptosis, and immune signaling are reshaping the way researchers approach this classic metabolic pathway. All methods and analyses described in this guide are for research use only.
Pyrimidine biosynthesis analysis services provide validated LC-MS/MS methods for quantifying de novo and salvage pathway intermediates in research samples.

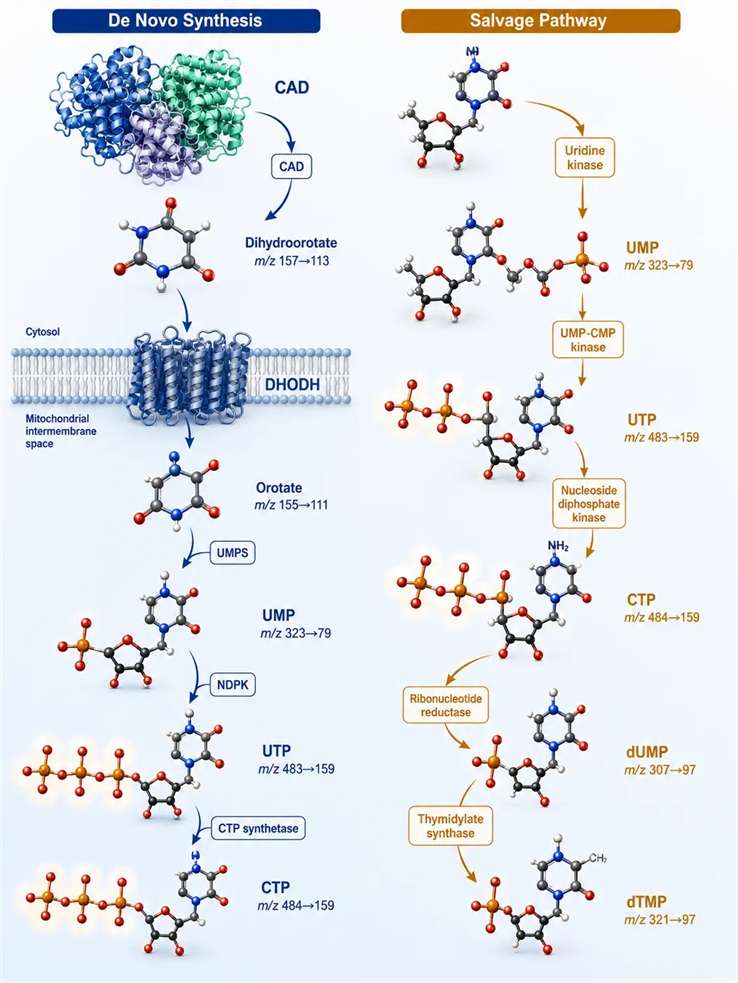
Figure 1: Pyrimidine metabolism landscape — de novo and salvage pathways with quantifiable intermediates highlighted
The Two Pyrimidine Nucleotide Synthesis Routes — De Novo and Salvage
Mammalian cells use two parallel routes to generate pyrimidine nucleotides. The de novo pathway synthesizes the uridine monophosphate (UMP) scaffold from small-molecule precursors through six enzymatic reactions, while the salvage pathway recycles preformed nucleobases and nucleosides from extracellular sources or intracellular degradation. The relative contribution of each route depends on cell type, proliferation status, and microenvironment — rapidly dividing cells such as activated lymphocytes and cancer cells depend heavily on de novo synthesis, while quiescent cells rely more on salvage. Understanding which route predominates in a given cell type is essential for designing targeted LC-MS/MS experiments: if the salvage pathway supplies most of the pyrimidine pool, then experiments that perturb de novo synthesis (e.g., DHODH inhibitor treatment) may show minimal effects on total nucleotide pools because salvage compensates. Conversely, if de novo synthesis is the dominant route, salvage pathway inhibition will have little effect. Measuring the relative contribution experimentally requires isotopomer tracing — [¹⁵N]glutamine labels all de novo-synthesized pyrimidines, while [¹³C]uridine labels the salvage pool, and the ratio of ¹⁵N to ¹³C incorporation into UTP reveals the pathway preference.
De novo pathway — six steps from glutamine to UMP: Step 1 is catalyzed by the trifunctional enzyme CAD (carbamoyl-phosphate synthetase II, aspartate transcarbamoylase, dihydroorotase), which produces dihydroorotate from glutamine, bicarbonate, and aspartate through three sequential reactions at three distinct active sites within a single polypeptide chain. CAD is the committed step of the pathway and its regulation determines the flux through de novo pyrimidine synthesis. Step 2 is catalyzed by dihydroorotate dehydrogenase (DHODH), a mitochondrial inner membrane enzyme that couples the oxidation of dihydroorotate to orotate with the reduction of ubiquinone (CoQ) to ubiquinol, linking pyrimidine synthesis to the electron transport chain. Steps 3-4 convert orotate to OMP (orotidine-5′-phosphate) via orotate phosphoribosyltransferase (OPRT), then OMP to UMP via OMP decarboxylase. This two-step conversion from orotate to UMP is catalyzed by the bifunctional enzyme UMP synthase (UMPS), which combines OPRT and OMPD activities on a single 52 kDa polypeptide. UMPS deficiency in preclinical models produces orotic aciduria — the accumulation and urinary excretion of orotic acid — which can be detected by LC-MS/MS as a diagnostic signature of de novo pyrimidine synthesis impairment. The UMP product is then sequentially phosphorylated to UDP and UTP by nucleotide kinases, and CTP is formed from UTP by CTP synthetase. The conversion of UDP to UTP is catalyzed by nucleoside diphosphate kinase (NDPK), a promiscuous enzyme that transfers the terminal phosphate from ATP to any nucleoside diphosphate, with a Km for UDP of approximately 50 µM and for ATP of approximately 200 µM. CTP synthetase catalyzes the ATP-dependent amination of UTP to CTP using glutamine as the nitrogen donor, and is subject to feedback inhibition by CTP with an IC₅₀ of approximately 20 µM. The UTP/CTP ratio in cells is typically 3-5:1, and this ratio shifts toward UTP accumulation when CTP synthetase is inhibited or when CTP is rapidly consumed for CDP-choline or CDP-diacylglycerol synthesis.
Salvage pathway: Uridine phosphorylase (UPP) and thymidine phosphorylase (TP) cleave nucleosides to release the base and ribose-1-phosphate, which enters the pentose phosphate pathway. Uridine kinase (UK) and thymidine kinase 1 (TK1, cytosolic, S-phase-specific) and thymidine kinase 2 (TK2, mitochondrial, constitutively expressed) re-phosphorylate nucleosides to their monophosphate forms. For research purposes, the salvage pathway is most relevant when studying nucleoside analog drugs — the same kinases that salvage natural nucleosides also activate cytotoxic nucleoside analogs, making TK1 expression a determinant of gemcitabine and 5-fluorodeoxyuridine sensitivity in preclinical models. The relative contribution of salvage vs de novo synthesis varies widely across cell types: in primary hepatocytes, salvage accounts for approximately 70% of pyrimidine nucleotide production, while in activated lymphocytes and most cancer cell lines, de novo synthesis supplies 80-90% of the pyrimidine pool. This differential reliance is the basis for the selectivity window of DHODH inhibitors, which selectively affect cells with high de novo demand while sparing tissues that can satisfy their requirements through salvage alone.
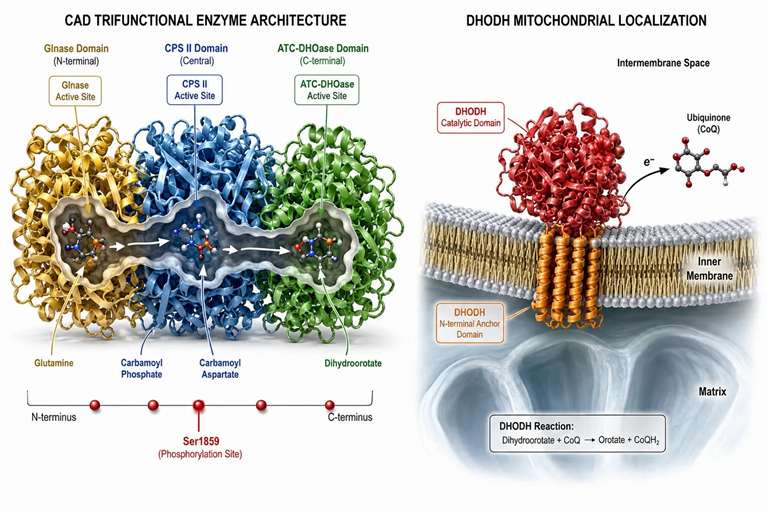
Figure 2: CAD trifunctional enzyme architecture and DHODH mitochondrial localization — three active sites in one polypeptide plus the inner membrane gatekeeper
CAD — The Trifunctional Enzyme That Controls De Novo Pyrimidine Flux
CAD is a 243 kDa polypeptide organized into three catalytic domains: glutaminase (Glnase) at the N-terminus that hydrolyzes glutamine to glutamate and ammonia, carbamoyl-phosphate synthetase II (CPS II) in the central region that condenses ammonia with bicarbonate and ATP to form carbamoyl phosphate, and aspartate transcarbamoylase (ATC) and dihydroorotase (DHOase) at the C-terminus that complete the first three reactions of the pathway. The assembly of four CAD monomers forms the active tetramer, and the channeling of intermediates between active sites occurs without diffusion into the bulk solvent — a mechanism that concentrates labile intermediates and prevents their loss to competing reactions.
Regulation by phosphorylation and metabolite binding: CAD is activated by phosphorylation at multiple sites by MAPK/ERK signaling, mTORC1-dependent S6K, and PFKFB3 (a glycolytic enzyme with kinase-independent functions). A 2025 study in Cell Reports demonstrated that PFKFB3 directly binds CAD and enhances its phosphorylation at Ser1859, increasing de novo pyrimidine synthesis flux by 2-3-fold in proliferating cancer cells. This finding establishes a direct biochemical link between glycolysis and pyrimidine synthesis — high glycolytic flux supplies both the ribose-5-phosphate (via the pentose phosphate pathway) and the activating signal (via PFKFB3-CAD interaction) for pyrimidine production. A 2025 study in Nature Communications further showed that CAD is cleaved by caspase-3 at Asp116 during apoptosis, and that cells expressing a caspase-resistant CAD mutant maintain pyrimidine synthesis longer during drug treatment, suggesting that CAD cleavage is part of the mechanism by which DNA-damaging agents shut down nucleotide production.
CPS II activity is the rate-limiting step within CAD and is subject to allosteric regulation: UTP (the end product of the pathway) inhibits CPS II with an IC₅₀ of approximately 100 µM, while PRPP (phosphoribosyl pyrophosphate, the pentose phosphate pathway intermediate) activates it with an EC₅₀ of approximately 30 µM. This allosteric switch creates a classical feedback loop — when UTP levels are high, de novo synthesis is suppressed; when PRPP accumulates (indicating high pentose phosphate pathway activity and a need for nucleotides), synthesis is activated. The binding sites for UTP and PRPP are located in the CPS II domain, approximately 30 Å apart, and the binding of one allosteric effector alters the affinity for the other through a conformational change that propagates across the domain interface. This fine-tuning mechanism allows CAD to respond to both pyrimidine nucleotide abundance (UTP) and activated ribose availability (PRPP), integrating signals from the nucleotide pool and the pentose phosphate pathway into a unified biosynthetic output. The interplay between glycolysis, the pentose phosphate pathway, and pyrimidine synthesis — all linked through the availability of ribose-5-phosphate and PRPP — means that perturbations in any one of these pathways can be detected by measuring a shift in the pyrimidine nucleotide profile.
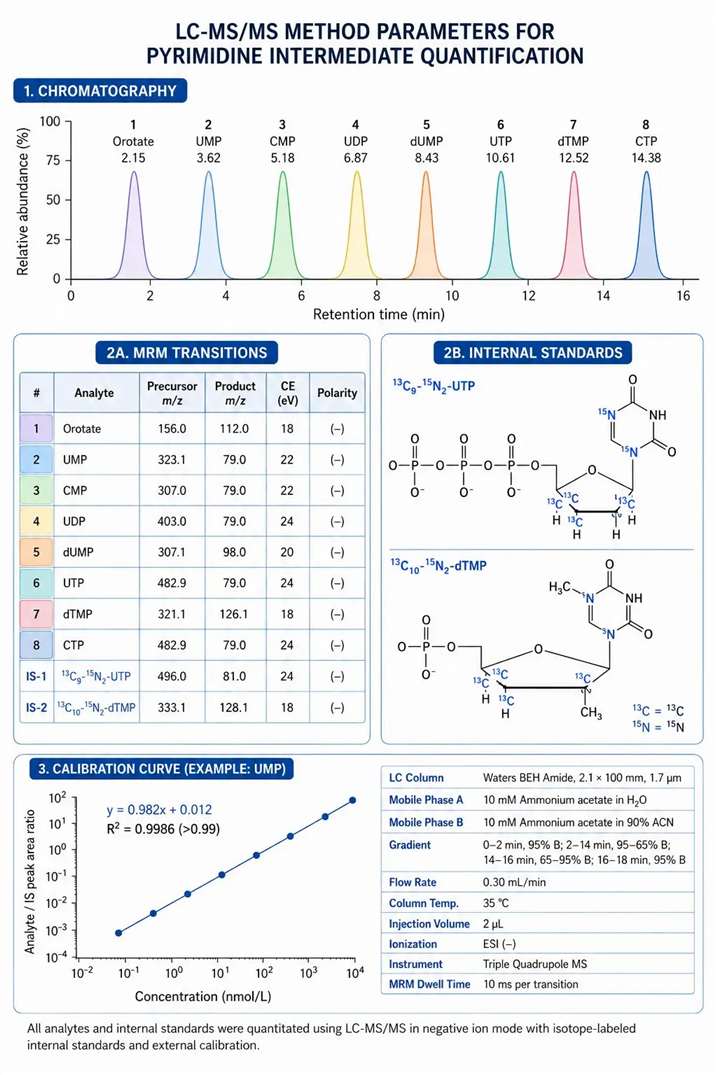
Figure 3: LC-MS/MS method parameters for pyrimidine intermediate quantification — MRM transitions, chromatography conditions, and internal standard strategy
DHODH — The Mitochondrial Gatekeeper and a Drug Target
Dihydroorotate dehydrogenase (DHODH) catalyzes the fourth and only redox-coupled step of de novo pyrimidine synthesis — the conversion of dihydroorotate to orotate with concomitant reduction of flavin mononucleotide (FMN) within the enzyme, followed by reoxidation of FMNH₂ via ubiquinone (CoQ). The enzyme is embedded in the inner mitochondrial membrane through an N-terminal membrane anchor domain, with the catalytic domain facing the intermembrane space. This topological arrangement couples pyrimidine synthesis to the mitochondrial electron transport chain — when the electron transport chain is compromised (e.g., by mitochondrial dysfunction), DHODH activity decreases and de novo pyrimidine synthesis slows.
DHODH inhibitors in preclinical research: Leflunomide (and its active metabolite teriflunomide) inhibits DHODH with an IC₅₀ of approximately 0.5-1.0 µM in cell-free assays, while brequinar inhibits with an IC₅₀ of approximately 0.01-0.1 µM. The primary pharmacodynamic readout for DHODH inhibition is the accumulation of orotate and orotidine upstream of the blocked step, and the depletion of downstream UTP and CTP pools. A 2025 study in Nature Communications demonstrated that DHODH inhibition synergizes with BCL-2 inhibition in pancreatic cancer models, with the combination causing complete regression of established tumors in a subset of treated animals. The orotate/UMP ratio in tumor tissue extracts — measured by LC-MS/MS — correlated with the degree of DHODH target engagement and predicted treatment response. A second 2025 study in BMC Pharmacology and Toxicology screened 10,000 compounds against DHODH and identified multiple novel chemotypes with sub-micromolar IC₅₀ values, providing a starting point for new DHODH inhibitor development programs. The biochemical readout used in this screen was the decrease in UTP levels relative to ATP (a non-pyrimidine reference) measured by LC-MS/MS in intact cells — a direct PD assay that captures the end-pathway effect of DHODH inhibition.
LC-MS/MS-based PD assay for DHODH inhibitors: Cells or tumor tissue are extracted with cold 60% methanol and analyzed by HILIC-MS/MS in negative ion mode. Key MRM transitions: orotate (m/z 155→111, CE 12 eV), dihydroorotate (m/z 157→113, CE 12 eV), UMP (m/z 323→97, CE 20 eV), and CTP (m/z 482→384, CE 22 eV). The orotate/UMP ratio increases 5-20-fold after DHODH inhibitor treatment, providing a robust biomarker for target engagement that is independent of overall extraction efficiency. Targeted pyrimidine analysis services provide validated methods for orotate, dihydroorotate, UMP, UDP, UTP, CMP, CTP, dUMP, and dTMP quantification in the same LC-MS/MS run, enabling a comprehensive view of DHODH inhibitor target engagement from the blocked step through all downstream products.
Analysis of Pyrimidine Nucleotide Pools by LC-MS/MS
Quantifying individual pyrimidine nucleotides from biological samples requires chromatographic separation of structurally similar compounds — CTP and UTP differ by only one amino group, and dUMP and dTMP differ by a single methyl group — combined with sensitive MS/MS detection capable of discriminating these small mass differences in complex matrix backgrounds.
Chromatographic considerations: Reverse-phase chromatography (C18) with ion-pairing reagents such as 10 mM tributylamine (TBA) in the mobile phase provides excellent separation of pyrimidine ribonucleotides with resolution sufficient to distinguish CTP from UTP, and UMP from CMP. The gradient progresses from 2% to 40% methanol over 15 minutes at 0.3 mL/min on a 2.1×150 mm C18 column maintained at 40°C. HILIC chromatography using an amide-bonded stationary phase (BEH Amide, 2.1×100 mm) with an ammonium acetate/acetonitrile gradient provides an alternative approach that avoids ion-pairing reagents but requires more careful mobile phase pH control (pH 9.0-9.5) for optimal retention and peak shape of phosphorylated nucleotides. The choice between ion-pairing RP and HILIC depends on whether the same method will be used for other metabolite classes — ion-pairing RP is preferred for dedicated nucleotide analysis, while HILIC is preferred when nucleotides are measured as part of a broader polar metabolomics panel that also includes amino acids, organic acids, and sugar phosphates. The ion-pairing reagent TBA builds up on the column over time and can cause retention time drift — a column wash of 90% methanol for 30 minutes every 20 injections is recommended to maintain reproducibility. HILIC columns require equilibration with 10-20 column volumes of the starting mobile phase before the first injection to achieve stable retention times for phosphorylated compounds, which are the most sensitive to mobile phase pH and ionic strength changes.
MRM transition selection: Pyrimidine nucleotides fragment primarily through neutral loss of the phosphate group or the base moiety. Representative transitions include: UMP (m/z 323→97, loss of ribose+phosphate), CMP (m/z 322→79, loss of ribose+phosphate with PO₃⁻), UTP (m/z 483→403, loss of HPO₃), dUMP (m/z 307→195, loss of deoxyribose), and dTMP (m/z 321→195, loss of deoxyribose). The collision energy must be optimized for each transition — the neutral loss of a complete nucleotide group requires 18-25 eV, while the base loss requires 12-16 eV. For dTMP specifically, the methyl group on the thymine base influences the optimal CE — the methylated pyrimidine ring has a slightly higher bond dissociation energy for the glycosidic bond, requiring approximately 18-20 eV compared to 14-16 eV for dUMP. Method optimization should ramp CE individually for each transition whenever instrumental scan speed allows. The UMP/UDP/UTP series provides a useful internal cross-check: the retention times should follow a consistent order on ion-pairing RP (monophosphate elutes first, triphosphate last) with stable relative retention time across injections — any deviation signals a column or mobile phase problem that requires investigation before quantitative data can be trusted.
Internal standard strategy and quantification: Stable isotope-labeled internal standards — ¹³C₉-¹⁵N₂-UTP (Cambridge Isotope Laboratories) and ¹³C₁₀-¹⁵N₂-dTMP — are essential for accurate quantification. Unlabeled and labeled forms co-elute chromatography and have identical ionization efficiency, so the peak area ratio between the endogenous compound and its labeled internal standard directly provides the concentration after multiplication by the internal standard concentration. The matrix effect is assessed by comparing the analyte/internal standard peak area ratio in post-extraction spiked matrix to the ratio in neat solution. An acceptable matrix factor is 0.85-1.15 — values outside this range indicate ion suppression or enhancement that must be corrected by adjusting the sample dilution factor or changing the chromatographic conditions. For pyrimidine nucleotides, the most common matrix interference sources are phospholipids (which suppress negative-mode ionization across a broad retention time window) and the naturally abundant nucleotide pool itself — when measuring pyrimidine nucleotide depletion after treatment, the decreasing endogenous concentration reveals matrix suppression that was previously masked by the high analyte signal. Including a stable isotope-labeled standard for each analyte class, rather than a single universal IS, accounts for the concentration-dependent matrix effects that single-IS approaches miss. For studies measuring multiple time points after compound treatment, the inclusion of a pooled QC sample processed identically to the study samples at every 10-15 injection intervals provides the inter-batch precision data required to distinguish treatment effects from analytical variability.
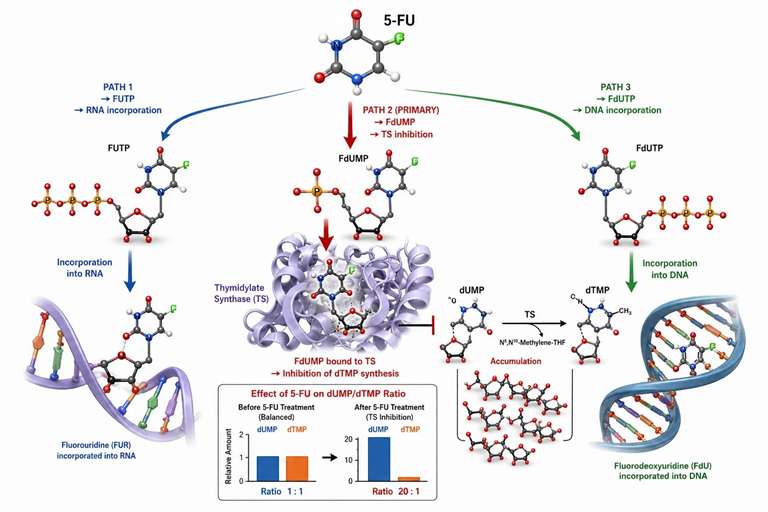
Figure 4: 5-fluorouracil metabolic activation pathway and thymidylate synthase inhibition mechanism
Pyrimidine Metabolism as a Drug Target Readout in Preclinical Research
Pyrimidine metabolism enzymes are the targets of several important drug classes used in preclinical cancer research. LC-MS/MS quantification of pathway intermediates before and after compound treatment provides direct readouts of target engagement and pathway blockade.
5-Fluorouracil mechanism and PD readout: 5-FU is a prodrug that enters cells through the same transporters as uracil and is metabolically activated through three convergent pathways: conversion to FUTP and incorporation into RNA (RNA damage), conversion to FdUMP which binds and inhibits thymidylate synthase (TS), and conversion to FdUTP and incorporation into DNA (DNA damage). The TS inhibition readout is the most directly measurable by LC-MS/MS — TS catalyzes the conversion of dUMP to dTMP. When TS is inhibited by FdUMP, dUMP accumulates and dTMP is depleted. The dUMP/dTMP ratio measured by LC-MS/MS in cell or tissue extracts increases 5-20-fold within 4-8 hours of 5-FU treatment, providing a pharmacodynamic biomarker that correlates with drug exposure and pathway engagement. The FUTP incorporation into RNA can be measured by digesting total RNA to nucleosides and quantifying the FdUrd fraction by LC-MS/MS.
Resistance to 5-FU in preclinical models most commonly involves increased expression of thymidylate synthase (TS), decreased expression of the activating enzyme orotate phosphoribosyltransferase (OPRT), or increased DPD activity leading to accelerated drug clearance. The contribution of each resistance mechanism can be assessed by measuring the activity or expression level of the relevant enzyme in paired pre-treatment and post-treatment samples. For TS, increased protein expression can be detected by western blot or by measuring the basal dUMP/dTMP ratio — cells with high TS activity maintain a lower dUMP/dTMP ratio at baseline and require higher 5-FU concentrations to achieve the same degree of TS inhibition. For DPD-mediated resistance, the 5-FU clearance rate and the plasma FUH₂/5-FU ratio distinguish between pharmacodynamic resistance (target-level) and pharmacokinetic resistance (clearance-level).
Nucleoside analog activation in salvage pathway: Cytarabine (Ara-C), gemcitabine (dFdC), and capecitabine (a 5-FU prodrug) are activated by the same salvage pathway kinases (TK1 for thymidine analogs, deoxycytidine kinase dCK for cytidine analogs) that phosphorylate natural nucleosides. The activated triphosphate metabolites — Ara-CTP, dFdCTP — accumulate intracellularly and inhibit DNA polymerases or become incorporated into DNA. LC-MS/MS methods for quantifying these activated metabolites in cell extracts and plasma use positive ion mode MRM: Ara-CTP (m/z 484→112, CE 20 eV), dFdCTP (m/z 468→112, CE 20 eV). The ratio of active triphosphate to total intracellular drug (triphosphate + di- + monophosphate forms) is a measure of the activation efficiency and is used in preclinical studies to rank-order compounds by their susceptibility to activation. For capecitabine, the activation cascade is more complex — it requires three sequential enzymatic steps: hydrolysis by carboxylesterase, deamination by cytidine deaminase to 5-FU, and phosphorylation by thymidine phosphorylase and TK1 to FdUMP. Measuring all activation intermediates simultaneously (capecitabine, 5′-DFCR, 5′-DFUR, 5-FU, FdUMP) by LC-MS/MS provides a complete activation profile that reveals which step is rate-limiting in a given cell line or tissue type.
DHODH inhibitor PD readout in vivo: Administration of leflunomide or brequinar to tumor-bearing mice at 10-30 mg/kg/day produces a measurable increase in plasma orotate concentration within 2-4 hours, peaking at 8-12 hours post-dose. The orotate concentration in plasma is quantified by LC-MS/MS (m/z 155→111 in negative mode) with a ¹³C₅-orotate internal standard. For tissue-specific target engagement, tumor tissue extracts are analyzed for orotate, UMP, and CTP levels — a greater than 5-fold increase in the orotate/UMP ratio relative to vehicle-treated controls is considered evidence of >80% DHODH target engagement. Parallel measurement of uridine in plasma (m/z 243→111, negative mode) provides a supplementary PD biomarker: DHODH inhibition reduces de novo UMP production, and the subsequent fall in circulating uridine (downstream of UMP) reflects the integrated effect of DHODH blockade on systemic pyrimidine availability. The combination of orotate (pre-blockade accumulation marker), UMP (post-blockade depletion marker), and uridine (systemic consequence marker) in a single plasma sample provides a three-tier PD assessment that captures the local, pathway-level, and systemic dimensions of DHODH inhibition. Tissue samples additionally enable measurement of the downstream product dTMP — the ultimate readout of whether DHODH inhibition has successfully starved the cell of the thymine nucleotide needed for DNA synthesis.
Targeted metabolomics services provide comprehensive pyrimidine nucleotide panel quantification for preclinical drug discovery studies.
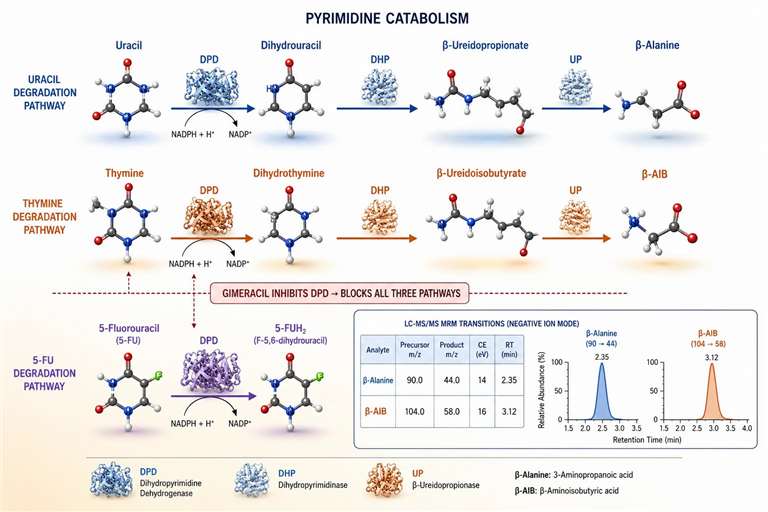
Figure 5: Pyrimidine catabolism pathways — 5-FU degradation by DPD and production of β-alanine and β-AIB
Salvage Pathway — Thymidine Kinase and Nucleoside Analogs
The salvage pathway recycles pyrimidine nucleosides and bases through one-step phosphorylation reactions that bypass the energy-intensive de novo pathway. TK1 expression is tightly regulated across the cell cycle — protein levels increase 10-50-fold during S-phase and are nearly undetectable in G₀/G₁. This cell-cycle-dependent expression makes TK1 a useful proliferation marker in preclinical models: elevated TK1 activity in tumor tissue extracts, measured by the conversion of labeled thymidine to dTMP in an enzyme activity assay, correlates with the proliferative fraction independently of other proliferation markers such as Ki-67.
Nucleoside analog activation: Gemcitabine (dFdC) enters cells through equilibrative nucleoside transporters (ENT1/ENT2) and is phosphorylated to its monophosphate by deoxycytidine kinase (dCK), then to its diphosphate and triphosphate by nucleoside diphosphate kinase. The triphosphate dFdCTP inhibits ribonucleotide reductase (RR) and is incorporated into DNA, causing masked chain termination. Resistance to gemcitabine in preclinical models is most commonly associated with decreased dCK expression (reduced activation) rather than increased deamination. LC-MS/MS quantification of dFdCTP in cell extracts provides a direct measure of the active metabolite concentration and is used to rank-order compounds in nucleoside analog discovery programs. Targeted metabolite quantification services support nucleotide analog activation profiling for preclinical compound optimization.
The cellular pharmacokinetics of nucleoside analogs differ markedly from small-molecule drugs because of the requirement for sequential phosphorylation. The rate-limiting step in gemcitabine activation is the initial phosphorylation by dCK, which has a Km for dFdC of approximately 10-20 µM — comparable to the plasma concentration of gemcitabine achieved at standard dosing. At concentrations above the Km, the activation becomes saturated, and further increases in prodrug concentration do not produce proportionally higher active metabolite levels. This saturation behavior means that the dFdCTP concentration in cells reaches a plateau at extracellular dFdC concentrations above 20-30 µM, and that increasing the dose beyond the saturation point produces no additional benefit. LC-MS/MS quantification of the full activation profile (dFdC → dFdCMP → dFdCDP → dFdCTP) at multiple time points provides the data needed to identify the activation bottleneck in a given cell line and to design dosing regimens that avoid the saturation region. For cytarabine (Ara-C), the same activation parameters apply but with a different dCK Km (approximately 5-10 µM), meaning that the optimal extracellular concentration for achieving maximum Ara-CTP is lower than for gemcitabine.
When Pyrimidine Degradation Matters — DPD and Its Role in Preclinical Models
Pyrimidine catabolism proceeds through a three-step pathway: reduction of the pyrimidine ring by dihydropyrimidine dehydrogenase (DPD), ring opening by dihydropyrimidinase (DHP), and final hydrolysis to β-amino acids by β-ureidopropionase (UP). For uracil, the end products are β-alanine, CO₂, and NH₃. For thymine, the end product is β-aminoisobutyric acid (β-AIB). DPD is the rate-limiting enzyme and shows high inter-individual variability in activity level in preclinical models — some mouse strains have 3-5-fold higher DPD activity than others, which directly affects the clearance rate of 5-FU and other fluoropyrimidines. DPD is a flavoprotein containing FAD as a cofactor, and its activity requires NADPH as an electron donor for the reduction of the 5,6-double bond of the pyrimidine ring. The DPD reaction is essentially irreversible under physiological conditions, making it the committed step of pyrimidine catabolism — once reduced, the dihydropyrimidine cannot be re-oxidized back to the parent compound. This irreversibility is exploited in research models to trap fluoropyrimidine analogs in their reduced forms, creating a metabolic sink that depletes the active drug pool.
In in vitro models, DPD activity in hepatocytes determines the rate of 5-FU degradation and can be measured by the appearance of 5-fluoro-5,6-dihydrouracil (FUH₂) in the culture medium by LC-MS/MS (m/z 131→88, positive mode). The ratio of parent 5-FU to FUH₂ provides a measure of the catabolic flux through DPD in the model system. For research models where consistent 5-FU exposure is required, DPD inhibitors such as gimeracil are co-administered to block catabolism and maintain drug levels throughout the dosing interval.
The end products β-alanine and β-AIB are excreted in urine and can be measured by LC-MS/MS (β-alanine, m/z 90→44 in positive mode; β-AIB, m/z 104→58 in positive mode with longer retention time). In preclinical models of pyrimidine metabolism perturbation, elevated β-AIB excretion after thymidine analog treatment indicates increased catabolic flux through the degradation pathway. The plasma concentration of β-AIB is also a marker of whole-body thymidine turnover — in studies of mitochondrial DNA depletion or nucleotide pool imbalance, plasma β-AIB reflects the rate of thymine catabolism and can serve as a non-invasive indicator of the nucleotide salvage and recycling status. For researchers studying the effect of TK1 inhibitors or thymidine phosphorylase modulators, β-AIB quantification provides an additional dimension of pathway-level information beyond the nucleotide pool measurements. The β-alanine to β-AIB ratio in plasma distinguishes the predominant pyrimidine being degraded: elevated β-alanine (from uracil/cytosine catabolism) with normal β-AIB suggests increased RNA turnover or 5-FU catabolism, while elevated β-AIB (from thymine catabolism) with normal β-alanine suggests increased DNA turnover or thymidine analog metabolism. This ratio provides a simple, two-marker assay for broadly classifying the metabolic origin of pyrimidine catabolic activity in a given model system.
Pyrimidine Metabolism and the Tumor Immune Microenvironment — Emerging Research Directions
Recent studies have uncovered roles for pyrimidine metabolism beyond cell-autonomous nucleotide supply. DHODH activity in tumor cells affects the tumor immune microenvironment through two mechanisms: the electron transport chain coupling means that DHODH inhibition reduces mitochondrial membrane potential and increases reactive oxygen species (ROS), which can trigger ferroptosis in certain tumor types, and pyrimidine starvation from DHODH inhibition activates the integrated stress response (ISR) pathway, altering the secretion of chemokines and cytokines that recruit or exclude immune cells. A 2025 study in Nature Communications demonstrated that DHODH inhibition in pancreatic cancer models increased CD8+ T cell infiltration by 3-5-fold through a mechanism involving STING pathway activation following mitochondrial DNA release. These findings position DHODH as a potential research target in cancer immunometabolism beyond its established role in proliferation-dependent pyrimidine supply.
Pyrimidine nucleotide pools also regulate immune cell function in a cell-intrinsic manner. Activated T cells increase their pyrimidine pool size by 5-10-fold during the first 24 hours of activation, primarily through upregulation of CAD expression and de novo pyrimidine synthesis. Pharmacological depletion of UTP levels by DHODH inhibition in activated T cells results in a p53-dependent metabolic checkpoint that arrests proliferation without inducing cell death — a mechanism that underlies the immunosuppressive effects of leflunomide in research models of autoimmune disease. The UTP concentration threshold for checkpoint activation is approximately 30% of the basal UTP level in proliferating T cells, and this threshold can be measured by LC-MS/MS quantification of the UTP/ATP ratio in T cell extracts. For researchers studying immune cell metabolism as part of a broader oncology immunology program, including pyrimidine nucleotide measurements alongside glucose uptake, lactate production, and fatty acid oxidation provides a more complete picture of the metabolic state of the immune cells within the tumor microenvironment. Customized experimental services support the integration of pyrimidine metabolism analysis with broader immunometabolism and signaling pathway studies.
Finally, the role of pyrimidine metabolism in epigenetic regulation is an emerging area of research. The methylation of cytosine in DNA depends on the intracellular concentration of S-adenosylmethionine (SAM), and SAM levels are influenced by the nucleotide pool composition through the one-carbon metabolism pathway. Changes in pyrimidine nucleotide levels — particularly the CTP/dCTP ratio — can affect the activity of DNA methyltransferases (DNMTs) by altering the availability of the methyl donor SAM. In research models where pyrimidine metabolism is perturbed by DHODH inhibitors or nucleoside analogs, the downstream effect on DNA methylation and gene expression is an additional dimension that can be explored by integrating pyrimidine nucleotide quantification with methylation-sensitive methods such as bisulfite sequencing or mass spectrometry-based methylation analysis. Targeted metabolomics approaches that include pyrimidine nucleotides, one-carbon metabolites, and methylation intermediates simultaneously provide the data needed to connect nucleotide metabolism to epigenetic regulation. The LC-MS/MS methods described in this guide — ion-pairing RP for nucleotide quantification and HILIC for a broader polar metabolite panel — form the analytical foundation that enables this integrative analysis without requiring separate sample workups for each analyte class.
FAQ
What is the difference between de novo and salvage pyrimidine synthesis?
De novo synthesis builds UMP from glutamine, bicarbonate, and aspartate through six enzymatic steps. Salvage recycles preformed nucleobases and nucleosides. Proliferating cells depend on de novo synthesis; quiescent cells rely on salvage.
How do I quantify pyrimidine nucleotides by LC-MS/MS?
Use ion-pairing reverse-phase (C18 with TBA) or HILIC chromatography with negative ion mode MRM. Key transitions include UMP (323→97), CMP (322→79), dUMP (307→195), and dTMP (321→195). Stable isotope-labeled internal standards are essential for accurate quantification.
What is DHODH and why is it a drug target?
DHODH catalyzes the fourth step of de novo pyrimidine synthesis at the inner mitochondrial membrane. It is the target of leflunomide and brequinar in preclinical cancer research. The PD readout is orotate accumulation and UTP/CTP depletion.
How does 5-FU work and how is its effect measured?
5-FU inhibits thymidylate synthase through its active metabolite FdUMP, blocking dTMP synthesis. The effect is measured by the dUMP/dTMP ratio by LC-MS/MS — a 5-20-fold increase indicates TS inhibition.
What is the role of CAD in pyrimidine metabolism?
CAD is the trifunctional enzyme that catalyzes the first three steps of de novo pyrimidine synthesis. It is regulated by UTP (inhibition), PRPP (activation), and phosphorylation by MAPK/ERK and PFKFB3.
Can pyrimidine intermediates be measured in plasma?
Yes. Orotate, β-alanine, and β-AIB are measurable in plasma by LC-MS/MS. Orotate serves as a circulating PD biomarker for DHODH inhibitor target engagement. β-AIB reflects thymine degradation flux.
References
- PFKFB3 activates CAD to enhance de novo pyrimidine synthesis. Cell Reports. 2025;44:100842.
- Cleavage of CAD by caspase-3 determines cancer cell fate under drug treatment. Nature Communications. 2025;16:60144.
- De novo pyrimidine biosynthesis inhibition synergizes with BCL-2 inhibition. Nature Communications. 2025;16:61242.
- Identification of novel DHODH inhibitors for cancer research. BMC Pharmacology and Toxicology. 2025;26:1007.
- The deubiquitylase OTUB1 drives gemcitabine resistance through pyrimidine metabolism reprogramming. Cell Death & Disease. 2025;16:8001.
Related Services
For research use only. Not for diagnostic or clinical applications.