The Physics of SDS-PAGE: Beyond the "Sieve" Model
Technical Sovereignty: Membrane Transfer Energetics
Technical Sovereignty: Antibody-Antigen Kinetics and Surface Blocking
Advanced Quantitation: Chemiluminescence and Fluorescence Kinetics
FAQ
Meta Intent: To help experienced researchers optimize Western blotting as a mechanism-driven analytical workflow, with emphasis on electrophoretic resolution, transfer control, and data integrity strong enough to support validation, outsourcing, and publication decisions.
Western blotting is often taught as a routine sequence: denature, load, run, transfer, block, incubate, wash, detect. That workflow is useful for orientation, but it hides the real source of assay performance. Resolution is controlled by detergent binding and polymer-network resistance. Transfer is controlled by field strength, solvent composition, heat dissipation, and membrane capture. Signal quality is controlled by antibody-binding equilibrium and detector linearity. When those variables are not modeled, troubleshooting becomes repetitive and expensive.
That is why Western blotting should be treated less as a fixed protocol and more as a coupled physical measurement system. A weak band is not automatically low abundance. It may reflect incomplete denaturation, poor entry into the resolving gel, incomplete transfer, suboptimal membrane retention, masked epitopes, or signal compression during detection. A shifted band is not automatically new biology. It may arise from glycosylation, phosphorylation, oligomeric remnants, or non-ideal SDS association. A clean housekeeping control does not guarantee valid normalization if the rest of the lane is not behaving comparably. These distinctions matter most when the blot is being used to validate discovery data, support a publication figure, or decide whether to move a project into a broader analytical program.
In those settings, blotting is often strongest when it sits inside a larger protein-analysis framework rather than being asked to answer every question alone. For example, discovery-stage changes can be profiled with a proteomics service, then verified on carefully optimized blots. Complex migration patterns can be clarified with protein identification services. Challenging lanes and borderline signal windows can be supported by protein gel and imaging. That kind of escalation is not about replacing Western blotting. It is about using it where it is strongest: targeted confirmation under controlled physical conditions.
The Physics of SDS-PAGE: Beyond the "Sieve" Model
SDS-PAGE is usually summarized as a size-based separation in which smaller proteins migrate faster through a gel. That description is directionally true, but incomplete. The method only works reliably because it first transforms structurally diverse proteins into more comparable electrophoretic particles, then sends those particles through a cross-linked polymer network that imposes size-dependent retardation. The first stage is chemical and thermodynamic. The second is mechanical and electrophoretic. Together they create the apparent simplicity of a size-based assay.
This distinction matters because many blot failures begin at the gel stage even when the membrane stage gets the blame. If the target has not been converted into a stable electrophoretic state, transfer behavior becomes hard to interpret. If the gel architecture is poorly matched to the target size range, the assay may never achieve meaningful resolution. Antibodies cannot rescue that kind of upstream distortion. They can only decorate what the gel has already produced.
Micelle Energetics: Why the SDS-Protein Ratio Matters
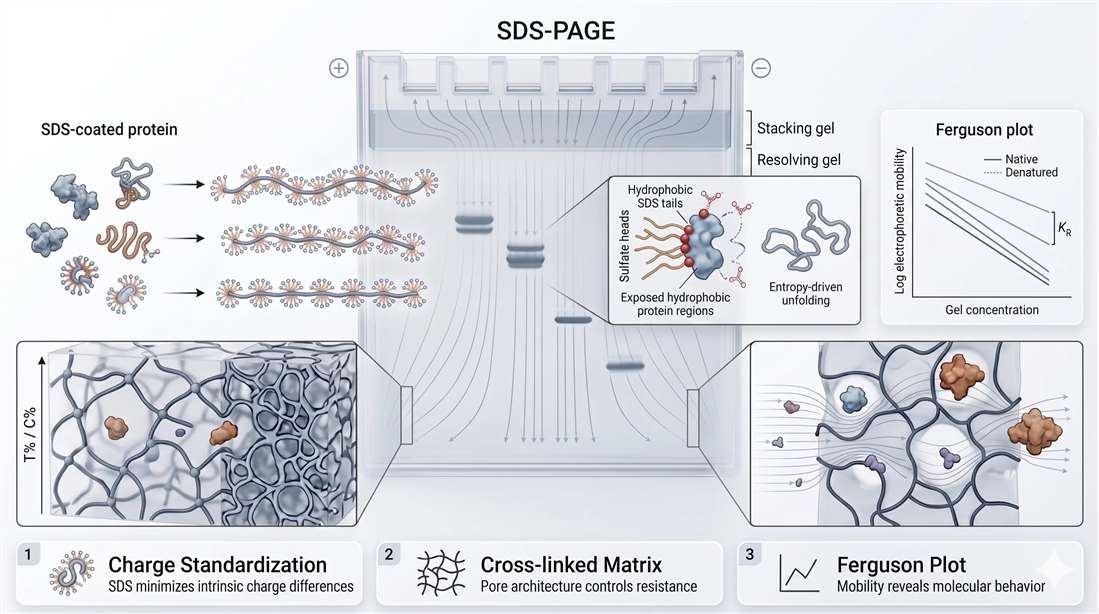
Sodium dodecyl sulfate is an anionic surfactant that binds denatured proteins at roughly 1.4 g SDS per gram of protein, a classic value also described as about one SDS molecule per two amino acids under standard denaturing conditions. That ratio matters because it suppresses much of the natural variability in protein charge and creates an approximately uniform charge-to-mass relationship across many proteins. Once that happens, intrinsic amino acid composition contributes less to migration, and electrophoretic mobility becomes much more dependent on effective molecular size in the denatured state.
The process is more than simple coating. SDS interacts through its hydrophobic tail with exposed nonpolar regions of proteins after heat, detergent, and often reducing conditions disrupt native folding. The negatively charged sulfate headgroups remain solvent-exposed, generating a strong net negative character. In thermodynamic terms, SDS helps stabilize the unfolded state by lowering the cost of exposing hydrophobic protein regions to water. The protein is therefore converted from a compact native structure into a more extended electrophoretic particle whose behavior is far more predictable in an electric field.
That standardization is why proteins with radically different native conformations can migrate in a surprisingly ordered way. It is also why certain targets remain stubborn. Membrane proteins, heavily glycosylated proteins, proteins with strong residual structure, and proteins embedded in lipid-rich contexts often behave as non-ideal analytes. Their apparent molecular weights may drift because detergent association is atypical or because their effective hydrodynamic behavior does not match the assumptions behind standard ladders. When those targets are central to the project, it is often useful to complement blotting with membrane protein identification, accurate mass determination, or molecular mass determination rather than leaning too heavily on band position alone.
The Gel Matrix Dynamics: %T, %C, and Effective Pore Size
Once proteins are transformed into SDS-rich electrophoretic particles, the gel becomes the dominant source of separation behavior. Polyacrylamide is not an empty filter with identical circular holes. It is a hydrated, cross-linked polymer network whose effective pore architecture depends on total monomer concentration and cross-linking density, commonly described as %T and %C. Higher %T generally reduces effective pore size and increases resistance to migration, especially for large proteins. Changes in %C alter how polymer chains are linked and therefore how that resistance is distributed through the matrix.
That is why gel choice is not just a recipe detail. It is a decision about resistance geometry. A gel tuned for small proteins can behave like a barrier for large proteins. A gel suitable for high-molecular-weight targets may fail to separate a tightly clustered mid-range panel. Gradient gels work well because they distribute resistance across a range, but even they do not remove the underlying physics. Proteins are migrating through a tunable polymer mesh, not a passive chamber.
In practical terms, the gel stage should be selected based on the analytical question, not habit. If the goal is to distinguish closely spaced phospho-forms, the resolving region matters more than generic coverage. If the target is a large membrane receptor, the gel must preserve enough mobility for later transfer. If the target is a small cleavage fragment, the gel may separate it cleanly but also increase downstream blow-through risk if transfer conditions are not matched later. Good blotting therefore starts with the entire system in mind, not the gel in isolation.
Scientific Logic: Why Size Separation Emerges in a Cross-Linked Polymer
Electrophoretic mobility in SDS-PAGE can be thought of as the balance between driving force and retardation. The electric field drives negatively charged SDS-protein complexes toward the anode. The gel opposes that motion through collisions, tortuous migration paths, and size-dependent resistance within the polymer network. Mobility is therefore not a fixed trait of the protein alone. It is an emergent property of analyte plus matrix.
This framing is much more useful for troubleshooting than the vague idea of a sieve. Smiling bands often reflect thermal gradients or uneven conductivity across the gel. Diffuse bands can come from overload, salt effects, incomplete stacking, or local heating. A large target lingering near the top of the gel may not have "failed to run"; it may be encountering a resistance field that is simply too restrictive under the chosen conditions. A glycoprotein that runs above prediction may be reporting altered hydrodynamic behavior as much as added mass.
This is also where mobility shifts become easy to overinterpret. Phosphorylation, glycosylation, ubiquitination, cleavage, and alternative isoform structure can all alter migration. The visible band may compress multiple underlying species into one apparent signal. In projects where modification-sensitive targets are central, blotting often works best when paired with phosphoproteomics service, glycosylation analysis of protein, ubiquitinated-proteomics, or broader protein post-translational modification analysis to separate true biology from electrophoretic artifact.
Ferguson Plot Analytics: From Visual Estimation to Analytical Interpretation
Most Western blots estimate apparent molecular weight by comparing the migration distance of a band to a ladder. That is acceptable for routine use, but it does not explain how mobility changes as gel concentration changes. Ferguson plot analysis provides a more rigorous framework by relating the logarithm of electrophoretic mobility to gel concentration. The resulting semi-logarithmic relationship is used to estimate free mobility and the degree to which gel concentration retards migration. The slope reflects how strongly a given analyte is impeded by the matrix, which is why larger or more hindered species typically show steeper reductions in mobility as gel concentration rises.
This matters because a persistent mobility anomaly should not automatically be blamed on ladder choice or antibody specificity. A target that runs high may be behaving as a non-ideal electrophoretic particle because of glycan load, residual structure, oligomeric persistence, or unusual detergent association. Formal Ferguson analysis is not required for every blot, but the concept is useful because it forces migration to be interpreted analytically rather than cosmetically.
That is particularly important when apparent band shifts are being used as evidence for a modification state. Ubiquitination, SUMOylation, glycan heterogeneity, and proteolytic processing can all generate deceptively simple lane patterns. Repeating the same blot under the same assumptions may add little. In those situations, the better next step is often characterization of protein SUMOylation, glycopeptides analysis, or peptide mapping, depending on the biological hypothesis.

Figure 1. SDS-PAGE electrophoretic physics, including SDS-mediated charge standardization, gel-matrix resistance, and Ferguson plot analytics.
Where Gel Physics Usually Fails First
When resolution is poor, the gel is often reporting a physical mismatch before the researcher has fully recognized it. Upper bands that remain compressed near the interface often indicate excessive resistance for large targets or incomplete denaturation. Closely spaced bands that merge into one unresolved region may mean the resolving range is poorly chosen. Smiling or curvature often points to heat and field distortion. Overloaded samples can turn a theoretically clean migration problem into a lane-broadening problem simply because the system is no longer operating in a near-ideal dilute regime.
Those issues become more expensive when the blot is already tied to a larger program. If the data are supposed to support a go/no-go decision on a candidate, or to validate a hit from a larger dataset, repeating a poorly designed gel stage can waste both sample and time. That is why many teams move from simple in-house iteration to more structured support such as sample preparation, protein sequence analysis, or customized experiments once the target class becomes analytically demanding.
Technical Sovereignty: Membrane Transfer Energetics
If SDS-PAGE determines separation, transfer determines whether those separated proteins become measurable at all. A perfectly resolved gel can still produce a poor blot if proteins never fully leave the matrix, move unevenly across the interface, fail to bind the membrane, or pass straight through it. Transfer is therefore not just a bridge between electrophoresis and detection. It is the stage where electrical transport, heat generation, solvent composition, and membrane surface chemistry converge.
A useful way to model transfer is as a three-step problem. Proteins must first be released from the gel. They must then migrate across the gel–membrane interface under the applied field. Finally, they must be retained by the membrane strongly enough to survive washing and probing. A weak band can result from failure at any of those steps, which is why transfer problems are so often misdiagnosed as antibody problems.
The Electrophoretic Transfer Vector: Wet vs. Semi-Dry as an Engineering Choice
During transfer, proteins remain negatively charged because SDS is still associated with them. The electric field continues to drive them toward the anode, but now the relevant path is out of the gel and into the membrane. Whether that movement becomes a successful blot depends on field strength, current distribution, transfer duration, buffer conductivity, stack assembly, and protein size. Wet and semi-dry transfer differ because they distribute those variables differently, not because one is universally superior.
Wet transfer places the stack in a relatively large buffer reservoir. That larger volume improves thermal stability and allows longer transfer durations with lower risk of rapid local drying or overheating. This is one reason wet transfer is often preferred for larger proteins: slow-moving targets have more time to leave the gel under conditions that remain relatively stable. Semi-dry transfer compresses the path and reduces buffer volume. It is fast and efficient for many routine targets, but the smaller fluid volume narrows the thermal safety margin and makes contact quality more critical.
The right choice therefore depends on the risk profile of the assay. If the project depends on recovering a large receptor, a low-abundance structural protein, or a difficult hydrophobic target, wet transfer often buys robustness. If the targets are comfortably mid-range and throughput matters, semi-dry can be highly effective. The important point is that speed and reliability are not identical variables.
Joule Heating: The Hidden Variable in Transfer
Whenever current passes through the transfer stack, heat is generated. That Joule heating is not incidental. It changes buffer behavior, affects membrane hydration, alters diffusion, and can distort transfer consistency across the stack. In systems with smaller buffer reserves or aggressive electrical settings, heat becomes one of the most important hidden variables in blot quality.
This is why increasing power is often a mixed blessing. Stronger fields may accelerate protein movement, but they also increase thermal stress. Once the stack becomes unevenly heated, the transfer environment is no longer uniform. Small proteins may over-transfer while larger proteins remain incompletely released. Local hot spots may create patchy or distorted signals that look biological unless the transfer stage is examined critically.
Wet systems tolerate this better because the surrounding buffer acts as a heat sink. Semi-dry systems can perform extremely well, but they reward tighter optimization and punish excessive electrical intensity. A blot that repeatedly shows inconsistent transfer across lanes, or across molecular-weight regions, should be evaluated for thermal imbalance before the problem is assigned to antibodies or substrate choice.
Thermodynamics of Protein-Membrane Binding: Nitrocellulose vs. PVDF
A protein that reaches the membrane is not automatically secure. Transfer becomes analytically useful only when the membrane captures and retains that protein through subsequent blocking, washing, antibody incubation, and imaging. Nitrocellulose and PVDF dominate because both bind proteins effectively, but they do so through different practical and interfacial behaviors.
Nitrocellulose is often favored for convenience and relatively low background. PVDF is more hydrophobic and mechanically durable, which often makes it attractive for difficult targets or repeated probing. But PVDF requires pre-wetting because its surface is intrinsically hydrophobic and does not equilibrate readily with aqueous buffer until properly conditioned. That requirement is not procedural trivia. It reflects the underlying interface physics of how proteins are captured.
From a thermodynamic standpoint, protein retention depends on whether the membrane surface can form interactions strong enough to displace interfacial water and hold the analyte through later washes. That is why membrane choice should be tied to the target class. Hydrophobic, low-abundance, or reprobe-sensitive workflows often favor PVDF. Straightforward routine assays often do well on nitrocellulose. When target recovery is difficult, membrane selection becomes part of assay design rather than a default consumable choice.
The Methanol Effect: One Solvent, Two Consequences
Methanol is frequently described as a standard component of transfer buffer, but its importance is that it changes both the membrane side and the gel side of the transfer problem. It can promote membrane handling and protein capture, yet also tighten the gel environment in ways that hinder release of very large proteins.
At the membrane level, methanol supports wetting behavior and can improve conditions for retention. At the gel level, methanol reduces swelling and can make the matrix less permissive to release of large proteins. That is why reducing methanol, or adding a small amount of SDS to the transfer buffer, is often recommended when high-molecular-weight targets transfer poorly. But those changes are trade-offs. Conditions that improve gel release may weaken the sharpness of membrane capture or increase the chance that smaller proteins pass too far.
The practical lesson is that methanol should not be treated as a yes-or-no ingredient. It is a variable that redistributes the balance among release, transport, and capture. Good optimization begins by asking which of those three steps is currently limiting the assay.
The Blow-Through Phenomenon: Why Small Proteins Disappear
Small proteins create the opposite problem from large ones. Instead of remaining trapped in the gel, they may pass through the membrane entirely. This blow-through effect becomes more likely when transfer is too strong, too long, or mismatched to the membrane and target size. In those cases, the missing band may be a transfer-loss event rather than a biological absence.
This is why membrane selection matters so much for small proteins and peptides. A tighter membrane format can improve capture where a more open format permits loss. The same logic applies to transfer duration and field intensity. What looks like a sensitive detection problem may actually be a capture problem created much earlier in the workflow.
Projects that need to monitor both very small and very large targets within one program often discover quickly that one default transfer condition is an unsatisfying compromise. When that happens, it is usually more efficient to split assay conditions or support the program with semi-quantitative proteomics analysis, customized experiments, or bioinformatics for proteomics than to force every target through one transfer format.
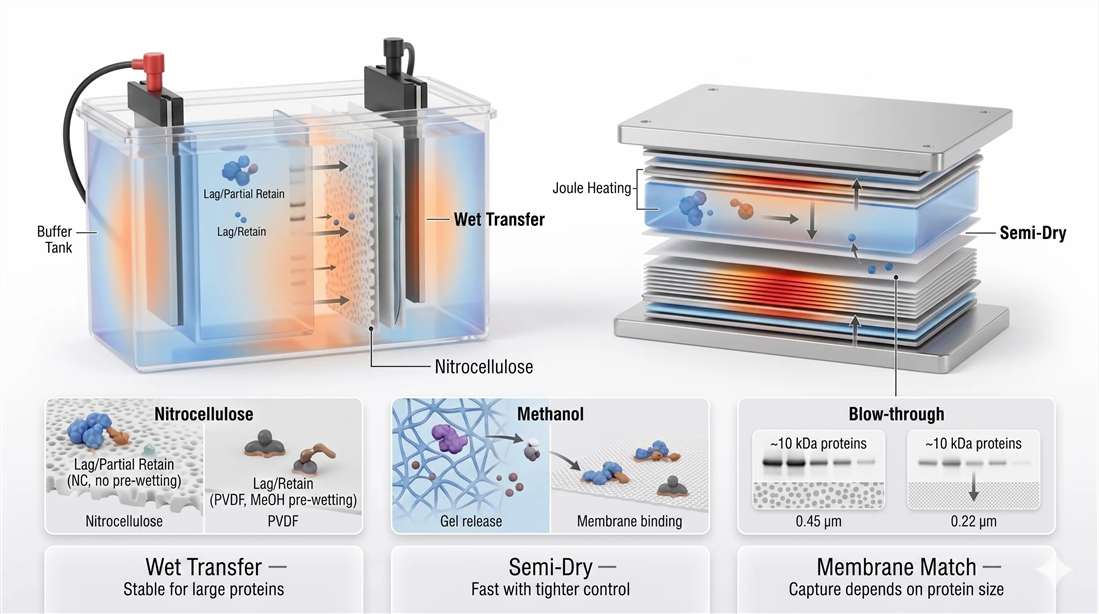
Figure 2. Membrane transfer energetics, including wet versus semi-dry architecture, Joule heating, methanol effects, membrane binding physics, and small-protein blow-through.
Technical Sovereignty: Antibody-Antigen Kinetics and Surface Blocking
Once proteins are immobilized on the membrane, the assay stops being an electrophoresis problem and becomes a surface-chemistry problem. At this stage, the membrane is no longer just a carrier. It is a reactive landscape containing target proteins, unoccupied adsorption sites, residual detergent effects, and local steric constraints. The purpose of blocking is not simply to "reduce background." It is to occupy nonspecific binding sites without masking the epitopes that the primary antibody must still reach. The purpose of incubation is not simply to wait. It is to drive the antibody-binding system toward a usable equilibrium while minimizing nonspecific adsorption and preserving linearity between target abundance and measured signal.
This is where many apparently simple blot protocols become analytically fragile. A membrane can be well transferred yet still produce unusable data because the blocking layer is too aggressive, the antibody concentration is too high, the incubation temperature is mismatched to affinity, or washing conditions fail to remove weak off-target interactions. These are not secondary details. Once the target is on the membrane, specificity depends on how surface occupancy and binding kinetics are controlled.
The Steric Hindrance Problem: Why Blocking Must Protect the Surface Without Hiding the Target
Blocking agents such as bovine serum albumin, casein, milk proteins, synthetic blocking reagents, or specialized commercial buffers all operate on the same basic principle: they occupy membrane regions that would otherwise bind antibodies nonspecifically. The challenge is that the membrane does not distinguish between a useful unoccupied site and an epitope-adjacent region that the antibody still needs to access. If the blocking layer is poorly chosen, the membrane may look quiet while the target becomes less detectable.
This is especially relevant when probing low-abundance or structurally constrained targets. A large antibody molecule approaching an epitope on an immobilized protein already faces geometric limitations. If the local surface is crowded with blocker molecules, or if target proteins are densely deposited in a narrow region, steric hindrance can reduce productive binding even when the antibody itself is perfectly valid. That is why some antibodies perform differently on the same membrane depending on blocker choice, incubation time, and membrane type. The issue is not always specificity in the abstract. It is access in physical space.
Blocking selection should therefore be tied to target biology. Milk-based blockers are convenient and effective for many routine applications, but phospho-specific antibodies often perform better in BSA-based systems because milk contains phosphoproteins that can complicate background. Casein-rich blockers may suppress nonspecific binding efficiently but can also introduce compatibility issues in some phospho-sensitive or modification-sensitive workflows. When target recognition is inconsistent, it is often worth treating blocking chemistry as a controlled variable rather than a default reagent.
For projects involving PTM-sensitive targets or antibody performance uncertainty, blotting often benefits from adjacent support such as Biacore service for binding characterization, de novo antibody sequencing when antibody identity becomes strategically important, or protein structure analysis when epitope accessibility may be structurally constrained.
Antibody Affinity, Temperature, and Incubation Time
Antibody binding on a blot is a kinetic competition between productive association and unwanted surface interactions. Affinity is commonly described through the dissociation constant, (K_D), but practical blot performance depends on more than equilibrium affinity alone. Association rate, dissociation rate, local target density, diffusion through the incubation layer, membrane agitation, and temperature all shape the usable outcome.
The basic temperature trade-off is straightforward. Incubation at room temperature generally accelerates binding and reduces total assay time, but it can also accelerate nonspecific interactions and increase background. Incubation at 4°C slows the system, often allowing a cleaner separation between high-affinity specific binding and weaker nonspecific adsorption. That is why overnight incubation at 4°C remains common for challenging targets: it sacrifices speed to improve selectivity. But lower temperature is not automatically better. If the antibody has modest affinity or the target is scarce, slowing the system too much may reduce useful signal unless incubation time is extended adequately.
Agitation matters for the same reason. A membrane in static solution develops local diffusion limitations near the surface. Gentle rocking or orbital agitation reduces the thickness of that boundary layer and improves mass transport of antibodies to the membrane. Too little movement can make a good antibody appear weak. Too much mechanical stress can sometimes promote uneven reagent exposure or handling artifacts. The right condition is usually mild, continuous mixing that supports transport without destabilizing the membrane.
The most reliable way to think about incubation is therefore as a sensitivity-versus-background trade-off. Longer incubation improves the probability that scarce target sites will be occupied. But time also gives weak nonspecific interactions more opportunity to accumulate. Higher antibody concentration can rescue signal, but it can also flood the membrane with off-target binding. Lower temperature can improve selectivity, but only if the system is given enough time to approach useful equilibrium. There is no universal best setting because the answer depends on affinity, target abundance, blocker chemistry, membrane type, and downstream detection method.
Scientific Logic: Why "More Antibody" Often Makes Data Worse
One of the most persistent misconceptions in Western blotting is that weak bands should be rescued by using more antibody. That works only when the assay is operating below the useful association threshold for specific binding. Just as often, increasing antibody concentration makes the blot worse because nonspecific surface interactions rise faster than informative target binding. The membrane becomes brighter, but not more truthful.
This is particularly problematic in semi-quantitative workflows. Once nonspecific background expands, local contrast falls and densitometric interpretation becomes unstable. Small differences in washing or exposure start to dominate the apparent signal. At that point, the blot is no longer limited by target biology. It is limited by uncontrolled surface chemistry.
The more defensible approach is to validate the antibody in the intended sample context, then optimize blocker, dilution, temperature, and wash stringency as a system. That is also where orthogonal analytics add value. If the project goal is not just presence/absence but expression-level comparison, antibody-based detection can be strengthened by protein quantification, label-free quantification, or absolute quantification (AQUA) when the biological question requires a more quantitative anchor than densitometry alone.
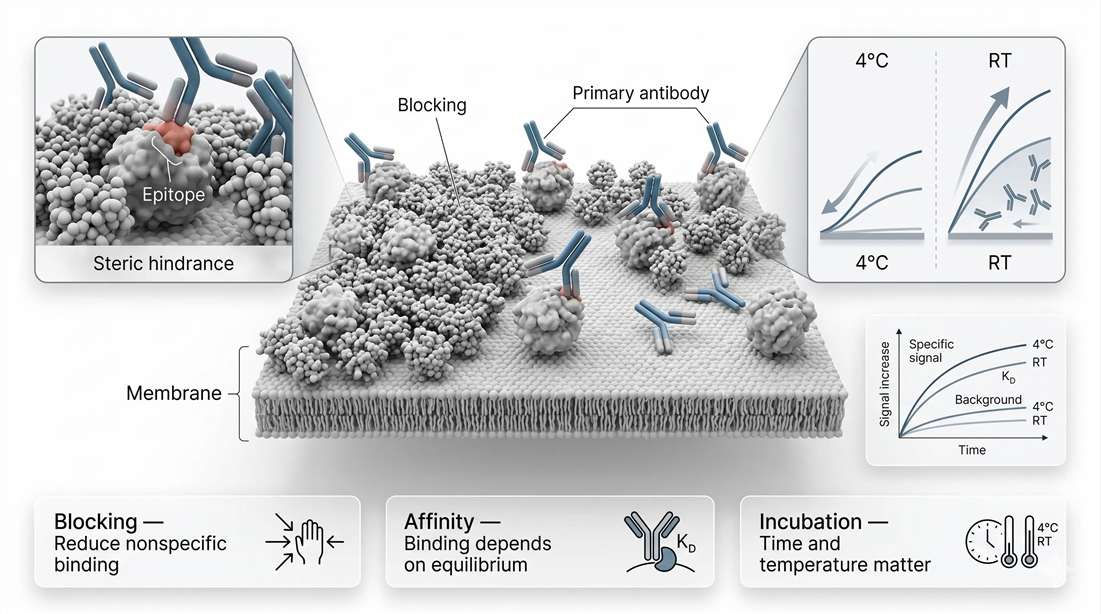
Figure 3. Antibody-antigen kinetics on the membrane, including surface blocking, steric hindrance, affinity-dependent binding, and the temperature-background trade-off.
What Good Immunodetection Control Looks Like
By the time the blot reaches the antibody stage, the best experiments are already constrained in a useful way. The protein was separated appropriately. The target reached the membrane. The membrane retained it. Now the immunodetection layer has one job: convert a known physical deposit into a selective and reproducible signal. That is only possible when blocking does not hide the epitope, antibody affinity is matched to incubation conditions, and background is managed as a surface-occupancy problem rather than a cosmetic one.
Advanced Quantitation: Chemiluminescence and Fluorescence Kinetics
The final stage of Western blotting is often treated as imaging, but it is more accurate to describe it as signal measurement under kinetic constraints. In chemiluminescent workflows, the membrane is not simply photographed. It is undergoing an enzyme-catalyzed light-generating reaction whose intensity changes over time. In fluorescent workflows, the membrane is being interrogated by optical excitation and detector response across a finite dynamic range. In either case, the image is only as quantitative as the signal-generation window and detector linearity allow.
This is where visually attractive blots can become analytically misleading. A strong band on film may already be compressed into a nonlinear regime. A weak band may sit near the noise floor. A CCD image may look cleaner than film, but still lose quantitative value if pixels saturate. The relevant question is therefore not which image looks best. It is whether signal intensity remains proportional to target amount within the capture window used for analysis.
ECL Kinetics: HRP, Luminol, and Time-Dependent Light Output
Enhanced chemiluminescence is built around the horseradish peroxidase-catalyzed oxidation of luminol in the presence of peroxide and proprietary enhancer chemistry. The reaction produces light, but not always in the same way. Different substrates are engineered to favor different temporal profiles. Some produce flash-like output with high early intensity and fast decay. Others produce glow-like output that is longer-lived and easier to capture consistently over a broader time window.
That distinction is practical, not academic. A flash-dominant substrate may help reveal a scarce target if imaging begins immediately and exposure is controlled carefully. But the same substrate can become difficult to compare across samples if signal decays rapidly and imaging timing varies. Glow-type systems are often more forgiving because they offer a broader capture window, but they can still be misused if exposure is pushed too far or if strong bands saturate before weaker bands become interpretable.
The key point is that chemiluminescent signal is kinetic. It changes with time, substrate formulation, enzyme loading, and antibody concentration. A blot is therefore not a static object waiting to be documented. It is a reaction system that must be measured during a useful interval. That interval becomes narrower when target abundance varies greatly across lanes or when antibody optimization is poor.
CCD Detection vs. X-ray Film: Why Detector Physics Controls Trustworthiness
Film and digital imaging do not simply produce different aesthetics. They embody different measurement behaviors. Traditional X-ray film has long been used because it is sensitive and straightforward, but it is fundamentally limited for semi-quantitative work by nonlinear response and compression at high signal intensities. Once bands become too dark, further increases in signal do not translate proportionally into readable density. A strong band may therefore look impressive while already being analytically compromised.
CCD-based digital imaging improves on this by expanding usable linearity, increasing reproducibility, and making exposure control much more flexible. In practical terms, a cooled CCD system can capture weaker signals while also preserving proportionality longer before saturation. That does not make digital imaging automatically quantitative, but it makes controlled semi-quantitative analysis more realistic. It also allows repeated short exposures, dynamic-range assessment, and software-based densitometry without the variability of film development.
The important limitation is that digital systems still saturate. A pixel well can fill. A strong band can still exceed the linear window. The difference is that digital workflows make the failure easier to recognize and easier to avoid. Good practice therefore focuses less on choosing the most sensitive detector and more on identifying the exposure range in which both target and normalization signals remain unsaturated and proportional.
When expression-level decisions carry real weight, Western blot densitometry is often most useful as one layer of evidence rather than a stand-alone quantitation platform. It pairs naturally with semi-quantitative proteomics analysis, SRM & MRM, parallel reaction monitoring (PRM), or DIA quantitative proteomics service when the project needs stronger numerical confidence.
Scientific Logic: Why Film Is Qualitative and Digital Imaging Can Be Semi-Quantitative
The difference between film and CCD imaging is not simply convenience. It is the width and control of the linear dynamic range. A detector supports semi-quantitative analysis only if signal intensity remains proportional to protein amount across the measurement window. Film can document presence, absence, and approximate relative intensity, but it compresses strong signals easily and makes repeated exposure control cumbersome. CCD systems, and especially well-validated digital workflows, extend the measurable range and make saturation easier to detect before analysis begins.
That is why modern quantitative Western blot guidance places so much emphasis on exposure series, combined linear range, and control validation. The image should be treated as data acquisition, not illustration. If a band is saturated, its darkness is no longer a trustworthy proxy for abundance. If normalization controls saturate before the target does, the ratio becomes unstable even when the blot looks clean.
Total Protein Normalization: Moving Beyond GAPDH and Actin
Normalization is where many otherwise careful blots lose credibility. Housekeeping proteins such as GAPDH, β-actin, or tubulin are still widely used because they are familiar and easy to probe. But familiarity is not the same as robustness. A housekeeping protein can change across treatments, differ by cell state, saturate quickly, or behave outside the same linear window as the target protein. When that happens, the normalization step introduces error instead of removing it.
Total protein normalization addresses this problem by measuring the full protein content of each lane rather than relying on a single internal control band. Ponceau S staining, stain-free systems, and other total-lane approaches provide a broader representation of loading and transfer across the sample. They also reduce dependence on the assumption that one control protein remains invariant under all conditions. That is why total protein normalization is increasingly treated as the stronger default for high-quality Western blot quantitation.
The logic is simple. A whole-lane signal samples the loaded proteome more broadly than one housekeeping target. It is therefore less likely to fail because of treatment-specific biology in a single control protein. It also better reflects the fact that loading and transfer are lane-wide events. If the goal is to correct for lane-wide variation, a lane-wide measurement is usually the more defensible reference.
That does not mean total protein normalization is automatic or foolproof. The total-protein signal must still be within a usable range, compatible with downstream detection, and captured reproducibly. But when done correctly, it aligns much better with the physical reality of what is being normalized.
Scientific Logic: Why TPN Is the Stronger Default in 2026
The central advantage of total protein normalization is not novelty. It is that it matches the structure of the experiment. Western blotting compares lane-level deposition and lane-level signal generation. A single housekeeping band is only a proxy for that broader process, and sometimes a poor one. Total protein normalization reduces the number of assumptions required to turn image intensity into comparative data.
This is why higher-standard workflows increasingly combine total-protein methods with rigorous densitometry, exposure validation, and independent confirmation where needed. When a blot is being used to support a publication, a biomarker claim, or a handoff into a larger translational workflow, normalization quality matters as much as band clarity. In those settings, it is often useful to connect blot-based readouts with functional annotation and enrichment analysis, statistical analysis service, or integrated transcriptomic and proteomic analysis so that band-level findings are evaluated in the context of broader molecular evidence.
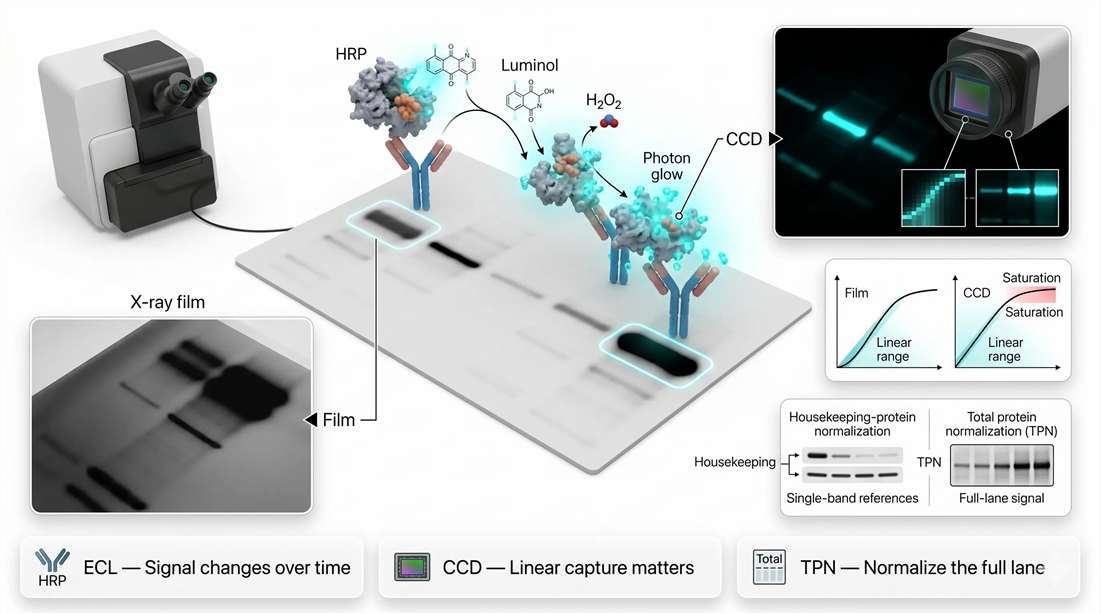
Figure 4. Chemiluminescence and fluorescence quantitation, including ECL kinetics, film versus CCD response, linear range, saturation, and total protein normalization.
FAQ
Is Western blotting still suitable for quantitative work?
Yes, but only under controlled conditions. It is better described as semi-quantitative unless the assay has been validated carefully for linear range, exposure, normalization, and antibody performance.
When should wet transfer be preferred over semi-dry transfer?
Wet transfer is often the safer choice for large, difficult, or low-abundance proteins because the larger buffer volume improves thermal stability and supports longer transfer times.
Why do small proteins disappear even when the antibody is good?
They may be blowing through the membrane rather than failing detection. Transfer intensity, duration, and membrane selection all influence this outcome.
Is PVDF always better than nitrocellulose?
No. PVDF is often advantageous for hydrophobic targets and reprobing, but nitrocellulose can be easier to handle and may produce lower background in many routine workflows.
Why is total protein normalization preferred over GAPDH or actin?
Because it normalizes to the whole lane rather than one control band that may change biologically or saturate analytically.
When should blotting be paired with proteomics?
When the target is modification-sensitive, migration is ambiguous, multiple isoforms overlap, or numerical confidence is needed beyond what densitometry alone can reliably provide.
References
- Towbin H, Staehelin T, Gordon J. Electrophoretic transfer of proteins from polyacrylamide gels to nitrocellulose sheets: procedure and some applications. Proc Natl Acad Sci U S A. 1979;76(9):4350-4354. DOI: 10.1073/pnas.76.9.4350. Publisher/PubMed record: https://europepmc.org/article/PMC/PMC411572
- Ferguson KA. The origin of the Ferguson plot. Electrophoresis. 2007;28(4):499-500. DOI: 10.1002/elps.200600666. PubMed: https://pubmed.ncbi.nlm.nih.gov/17304491/
- Taylor SC, Posch A. The design of a quantitative western blot experiment. BioMed Research International. 2014;2014:361590. DOI: 10.1155/2014/361590. PMC: https://pmc.ncbi.nlm.nih.gov/articles/PMC3971489/
- Aldridge GM, Podrebarac DM, Greenough WT, Weiler IJ. The use of total protein stains as loading controls: an alternative to high-abundance single-protein controls in semi-quantitative immunoblotting. Journal of Neuroscience Methods. 2008;172(2):250-254. DOI: 10.1016/j.jneumeth.2008.05.003. PMC: https://pmc.ncbi.nlm.nih.gov/articles/PMC2567873/
- Gilda JE, Gomes AV. Stain-free total protein staining is a superior loading control to β-actin for Western blots. Analytical Biochemistry. 2013;440(2):186-188. DOI: 10.1016/j.ab.2013.05.035. Publisher abstract: https://www.sciencedirect.com/science/article/abs/pii/S0003269713002595
- Pillai-Kastoori L, Schutz-Geschwender AR, Harford JA. A systematic approach to quantitative Western blot analysis. Analytical Biochemistry. 2020;593:113608. DOI: 10.1016/j.ab.2020.113608. PubMed: https://pubmed.ncbi.nlm.nih.gov/32007473/
- Rosselli-Murai LK, Crobeddu B, Plante I. A critical path to producing high quality, reproducible data from quantitative western blot experiments. Scientific Reports. 2022;12:17599. DOI: 10.1038/s41598-022-22294-x. Publisher page: https://www.nature.com/articles/s41598-022-22294-x
Related Services
- Proteomics Service
- Protein Gel and Imaging
- Protein Identification Services
- Protein Post-translational Modification Analysis
- Phosphoproteomics Service
- Glycosylation Analysis of Protein
- Membrane Protein Identification
- Protein Quantification
- Semi-quantitative Proteomics Analysis
- Bioinformatics for Proteomics