Why Erythropoiesis Biomarker Quantification Demands More Than Immunoassays
Erythropoiesis-regulating peptides—including erythropoietin (EPO), hepcidin, erythroferrone (ERFE), and GDF15—form a tightly coordinated feedback loop that controls red blood cell production and iron availability. Dysregulation of this axis underlies anemia of chronic kidney disease, cancer-related anemia, iron deficiency anemia, and myelodysplastic syndromes.
The analytical challenges are formidable. EPO is heavily N- and O-glycosylated, with isoform heterogeneity that complicates quantification. Hepcidin-25 contains 8 cysteine residues forming 4 disulfide bridges, requiring specialized reduction protocols. Recombinant EPO-based therapeutics must be distinguished from endogenous EPO to assess target engagement. Standard immunoassays lack the molecular specificity to resolve these complexities, often reporting composite signals that mask true biological changes.
Our Erythropoiesis and EPO-Related Peptide Biomarker Panel uses targeted LC-MS/MS with optimized sample preparation workflows—including deglycosylation for EPO and reduction/alkylation for hepcidin—to deliver sequence-specific quantification of each biomarker independently.
What This Panel Helps You Decide
Configurable Erythropoiesis Biomarker Panel
Depending on your therapeutic target and disease model, our panel can be configured to cover the key functional domains of erythropoiesis and iron regulation.
| Functional Axis | Selected Target Analytes | Relevance to Drug Discovery |
|---|---|---|
| Erythropoiesis Stimulation | EPO (endogenous), EPO (recombinant), EPOR, sTfR | Core biomarkers of erythropoietic drive. Essential for HIF-PH inhibitor pharmacodynamics and ESA therapy monitoring. |
| Iron Regulation | Hepcidin-25, Ferritin, Hepcidin-20, sFlt-1 | Central regulators of iron availability. Hepcidin suppression is a key readout for erythroferrone activity. |
| Erythroid Feedback | Erythroferrone (ERFE), GDF15, TWSG1, BMP2/6 | Mediators of EPO-driven hepcidin suppression and stress erythropoiesis. Important for understanding anemia of inflammation. |
This panel integrates with our HPA Axis Stress Hormone Panel, RAAS and Vasoactive Peptide Panel, Gut-Brain Axis Hormone Panel, and neuropeptidomics profiling platform for a holistic view of the stress-erythropoiesis-cardiovascular axis.
LC-MS/MS Workflow for Erythropoiesis Biomarker Quantification
Our targeted LC-MS/MS workflow is specifically designed to overcome the unique structural challenges of erythropoiesis-regulating peptides—from EPO glycosylation heterogeneity to hepcidin disulfide bridge complexity.
Sample Collection & Stabilization
Pre-chilled EDTA tubes with protease inhibitors; avoid hemolysis.
EPO Deglycosylation & Glycoform Collapse
PNGase F + neuraminidase to collapse heterogeneous EPO glycoforms.
Hepcidin Reduction & Alkylation
DTT reduction + IAA alkylation for 4-disulfide bridge linearization.
Proteolytic Digestion & ISTD Spiking
Trypsin/Lys-C digestion with isotope-labeled internal standards for each target.
LC-MS/MS Targeted Acquisition
Orbitrap Astral PRM/MRM with scheduled acquisition windows.
Data Processing & Quantification
Skyline peak integration, ISTD normalization, batch correction.
1
Sample Collection & Stabilization
Blood is collected into pre-chilled EDTA tubes containing our proprietary multi-protease inhibitor cocktail to arrest ex vivo peptide degradation. Hemolyzed samples are rejected, as hemoglobin degradation products can interfere with low-abundance EPO detection. Plasma is separated at 4°C within 15 minutes and flash-frozen.
2
EPO Deglycosylation & Glycoform Collapse
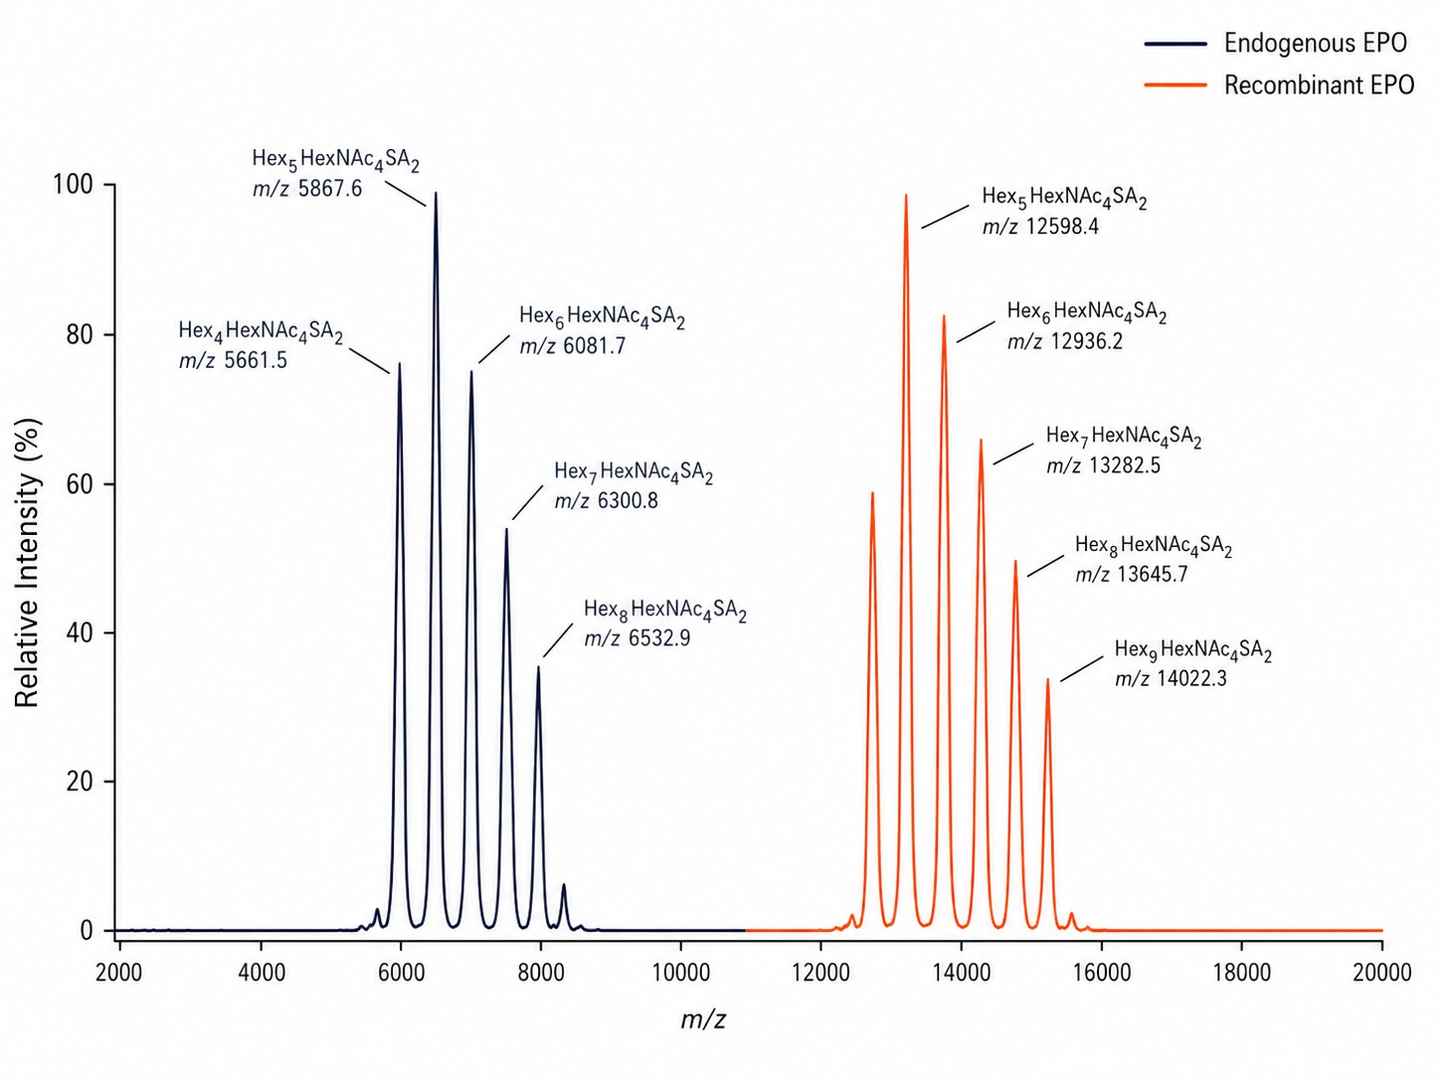
EPO exists as a heterogeneous mixture of glycoforms differing in sialic acid content and branching patterns. Enzymatic deglycosylation using PNGase F and neuraminidase collapses all glycoforms into a single deglycosylated peptide backbone, enabling robust MRM quantification. For differentiation of endogenous EPO from recombinant ESAs, we leverage subtle mass differences in peptide backbone glycosylation site occupancy.
3
Hepcidin Reduction & Alkylation
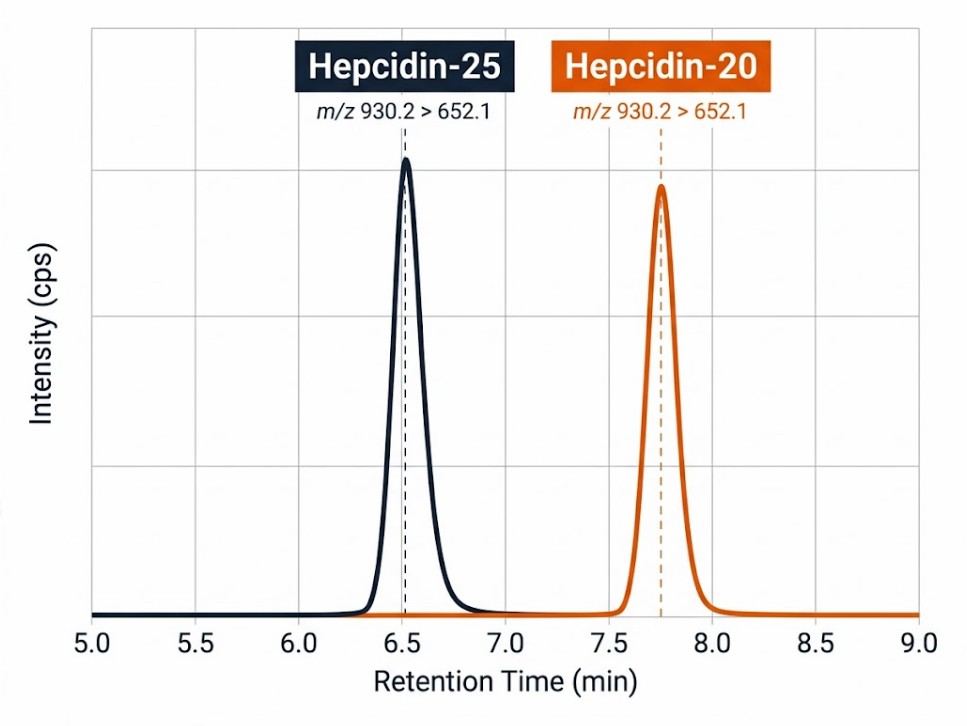
Hepcidin-25 contains 8 cysteine residues forming 4 disulfide bridges that create a compact, hairpin-shaped structure resistant to tryptic digestion. Complete reduction with DTT followed by iodoacetamide alkylation linearizes the peptide, enabling 100% sequence coverage and accurate quantification. This step also distinguishes the bioactive hepcidin-25 from the truncated hepcidin-20 variant.
4
Proteolytic Digestion & ISTD Spiking
Deglycosylated EPO, reduced hepcidin, and larger biomarkers (ERFE, GDF15, sTfR) are digested with trypsin or Lys-C to generate signature peptides. Isotope-labeled internal standards for each target are spiked prior to digestion, enabling absolute quantification with correction for recovery, matrix effects, and instrumental drift.
5
LC-MS/MS Targeted Acquisition
Digested samples are analyzed on an Orbitrap Astral platform using parallel reaction monitoring (PRM) or multiple reaction monitoring (MRM) with scheduled acquisition windows. Each biomarker is monitored by 3–5 unique transitions. The inclusion of isotope-labeled ISTDs in every run provides retention time alignment and relative response normalization.
6
Data Processing & Quantification
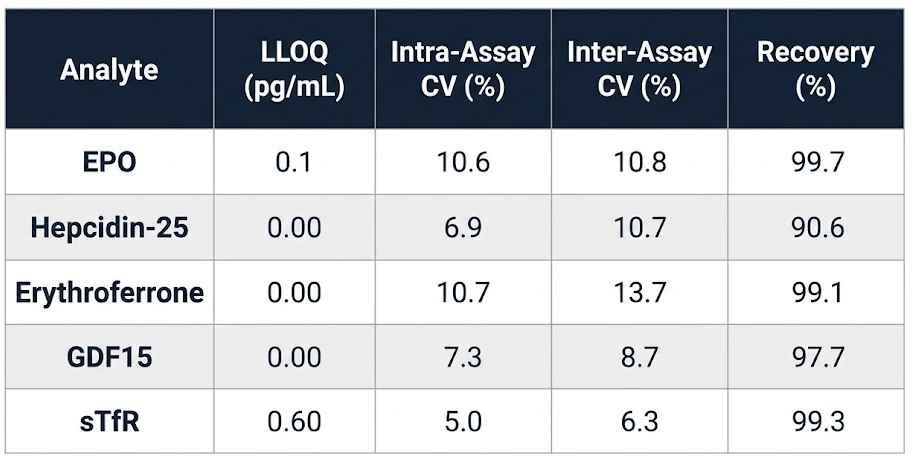
Raw data are processed in Skyline for peak integration, transition quality review, and ISTD-normalized quantification. Results are reported as absolute concentrations (pg/mL) with LLOQ, linear dynamic range, and intra-batch QC metrics. Batch correction is applied for multi-batch studies to ensure data comparability.
Platform Specifications and Detection Performance
We deploy high-resolution LC-MS/MS platforms optimized for erythropoiesis biomarker quantification.
- Inter-Assay Reproducibility
Across-batch CV <15% for all panel biomarkers, verified by repeated analysis of pooled QC samples. - Multi-Species Validation
Validated for rat, mouse, and human plasma/serum with species-specific MRM transitions for each target. - >90% MS/MS Peptide Coverage
HCD and ETD fragmentation for high-confidence identification of modified erythropoiesis peptides. - 1% FDR Stringent Filtering
Ensures data reliability and reproducibility across biological replicates. - 96-Well Plate Automation
Automated sample preparation in 96-well plate format for high-throughput study support. - Low Input Compatibility
Deep coverage from as little as 100 μL plasma or 50 μL serum.
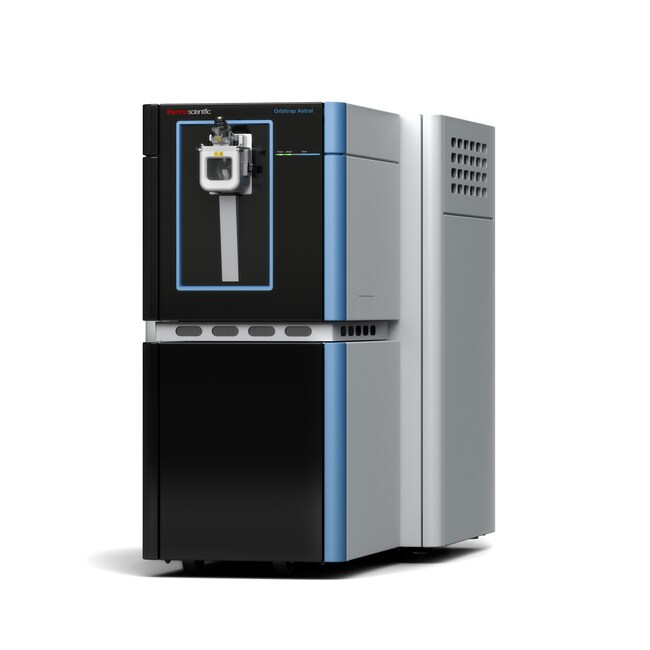 Orbitrap Astral™
(Fig from Thermo Scientific)
Instrument Capability Overview
| Feature | Orbitrap Astral™ | timsTOF Pro | Q Exactive HF-X |
|---|---|---|---|
| Scan Speed | Up to 200 Hz | ~100 Hz (PASEF) | ~20–25 Hz |
| Quantification | Label-free, PRM, SureQuant™ | Label-free, DIA, PRM | Label-free, TMT |
| Peptide Coverage | >90% MS/MS | >90% MS/MS | ~85% MS/MS |
| Low-Abundance | Single-peptide resolution | Ion mobility separation | Standard |
Comparative Analysis of Erythropoiesis Biomarker Quantification Approaches
| Dimension | Creative Proteomics LC-MS/MS | Immunoassay | Standard MS-Based Service |
|---|---|---|---|
| EPO Glycoform Resolution | Resolves endogenous vs recombinant by glycosylation site occupancy | Composite signal; cannot distinguish ESA from endogenous EPO | Not addressed in standard workflow |
| Hepcidin Structure | Complete reduction/alkylation for 100% coverage of 4-disulfide bridge peptide | Antibody-dependent; may cross-react with hepcidin-20 | Standard tryptic digest may miss disulfide-linked regions |
| Multiplexing | 5+ biomarkers per run (EPO, hepcidin, ERFE, GDF15, sTfR) | 1–2 per assay | Unlimited (discovery mode) |
| Sensitivity | pg/mL (PRM with isotope-labeled ISTD) | pg/mL range with signal amplification | ng/mL range |
| Sample Input | ≥100 μL plasma or 50 μL serum | Varies by kit | ≥50 μg protein |
| Specificity | Sequence-level MRM transitions for each biomarker | Antibody epitope-dependent | Peptide-level identification |
Anemia and CKD Drug Development Applications
Our panel is designed to support specific R&D tasks across anemia and chronic kidney disease drug development.
- HIF-PH Inhibitor Pharmacodynamics. Quantify endogenous EPO induction following roxadustat, daprodustat, or vadadustat treatment to confirm target engagement and dose-response relationships.
- Anemia of Chronic Kidney Disease. Profile the EPO-ERFE-hepcidin axis in CKD models to determine whether anemia is driven by EPO deficiency, iron restriction, or inflammatory hepcidin blockade.
- Cancer-Related Anemia. Monitor hepcidin suppression and GDF15 elevation in tumor-bearing models to evaluate the contribution of inflammatory cytokines to anemia of chronic disease.
- Iron Supplementation Therapy. Track hepcidin regulation and iron mobilization in response to oral or intravenous iron therapies.
- ESA Biosimilar Development. Compare the EPO glycoform profiles of biosimilar candidates against innovator epoetin alfa to support analytical similarity assessments.
- Preclinical Safety Assessment. Monitor EPO and hepcidin as indicators of drug-induced effects on erythropoiesis and iron homeostasis in toxicology studies.
Erythropoiesis Peptide Panel Demo Data
Endogenous vs. Recombinant EPO Differentiation
Hepcidin-25 vs. Hepcidin-20 Specificity
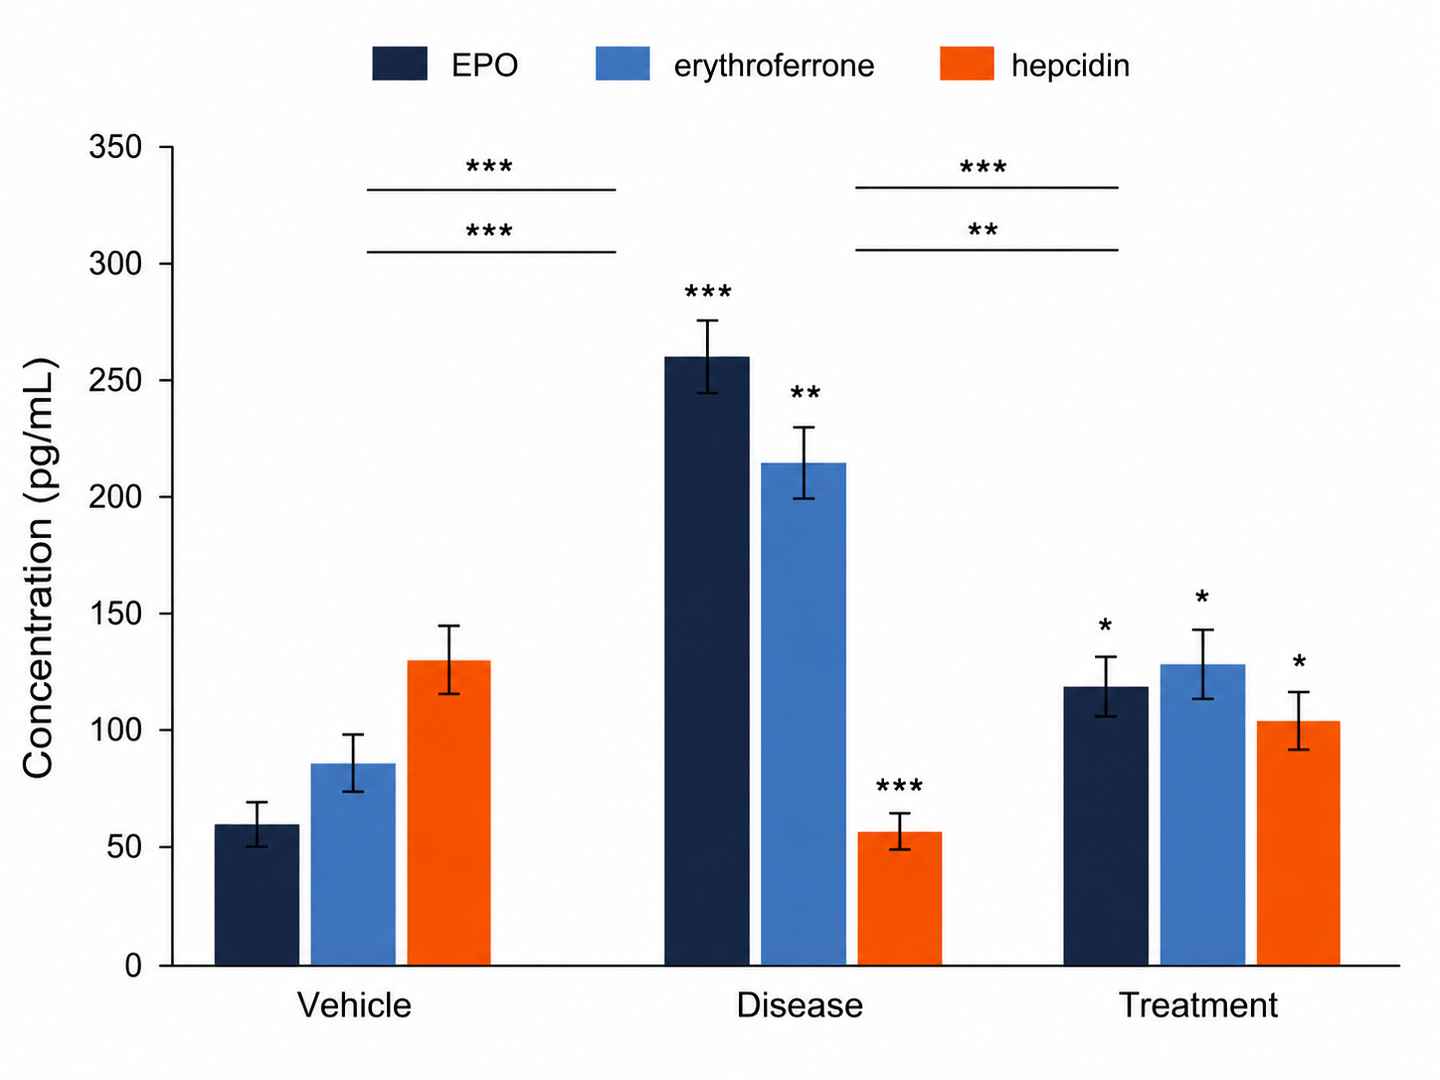
EPO-ERFE-Hepcidin Axis Profiling
Bioanalytical QC Package
Sample Collection Requirements for Erythropoiesis Biomarker Analysis
| Sample Type | Species / Context | Min Volume / Mass | Critical Pre-Analytical SOPs |
|---|---|---|---|
| Plasma (EDTA) | Rodent, NHP, Human | 100 μL | Collect in standard EDTA tubes. Add protease inhibitors for hepcidin stability. Avoid hemolysis which may degrade EPO. |
| Serum | Rodent, NHP, Human | 50 μL | Allow clotting at room temperature for 30 min. Centrifuge at 4°C. Serum is preferred for hepcidin quantification. |
| Bone Marrow / Kidney Tissue | Rodent Models | 20 – 50 mg | Snap-freeze in liquid nitrogen < 30 seconds after excision. Homogenize in RIPA buffer with protease inhibitors. |
| Cell Supernatant | Ex vivo / In vitro | 500 μL | Centrifuge at 4°C to remove debris. Add protease inhibitor cocktail. Flash-freeze within 30 minutes. |
(Consult with our scientific team prior to initiating your in vivo study for tailored guidance on collection protocols specific to your erythropoiesis biomarker targets.)
Deliverables: What You Receive
- Erythropoiesis Biomarker Quantification Report (PDF)
Complete summary of all detected and quantified peptides across all samples, with statistical analysis and intra-assay QC metrics. - Raw Data Files
Full LC-MS/MS raw data in standard format (Thermo .raw or Bruker .d) for archival and regulatory submission support. - Quantification Table (CSV)
Peptide IDs, retention times, peak areas, absolute concentrations (pg/mL), and QC metrics for each erythropoiesis biomarker. - Internal Standard Recovery Report
Recovery rates for each isotope-labeled internal standard, documenting assay performance across the analytical batch. - Comparative Statistics
Fold-change analysis, p-values, PCA plots, and dose-response curves for multi-group preclinical study designs. - Optional: Proteoform Ratio Analysis
Intact-mass-based assessment of endogenous vs. recombinant EPO proteoform distribution, including sialylation profile.
Can you distinguish endogenous EPO from recombinant erythropoiesis-stimulating agents? +
Yes. Endogenous and recombinant EPO differ in glycosylation site occupancy and branching patterns. Our LC-MS/MS workflow resolves these differences through deglycosylation and peptide-level MRM analysis, enabling independent quantification of drug-derived ESA versus endogenous hormone.
How do you handle hepcidin's complex disulfide bridge structure? +
We perform complete reduction and alkylation prior to enzymatic digestion, linearizing the disulfide-bridged structure for 100% sequence coverage. Targeted MRM of the fully reduced hepcidin-25 peptide ensures accurate quantification without interference from partially reduced forms.
What is the EPO-erythroferrone-hepcidin feedback loop? +
EPO stimulates erythroblasts to produce erythroferrone (ERFE), which suppresses hepatic hepcidin production. Hepcidin inhibition increases iron absorption and mobilization, supporting erythropoiesis. Dysregulation of this loop underlies anemia of CKD, inflammation, and iron deficiency.
Can you detect both hepcidin-25 and hepcidin-20 separately? +
Yes. Hepcidin-25 (bioactive, 25 aa) and hepcidin-20 (truncated, 20 aa) are distinguished by their unique mass-to-charge ratios and MRM transitions. This is critical because hepcidin-20 has different biological activity and its proportion varies in disease states.
What sample volume is required for the full panel? +
For plasma or serum, ≥100 µL is recommended for the full 5-biomarker panel. For focused analysis of 2–3 biomarkers, as little as 50 µL may be sufficient. Consult with our team for limited-volume samples.
Is the panel validated for both rodent and human samples? +
Yes. Rat, mouse, and human plasma/serum have been validated. Cross-species sequence differences are accounted for in MRM transition design, with species-specific peptides selected for each target.
Can I add custom biomarkers to the panel? +
Yes. Additional erythropoiesis-related or iron metabolism biomarkers can be added on request. Contact our scientific team with your targets of interest and we will assess MRM compatibility, sensitivity requirements, and ISTD availability.
Disclaimer: All services and analytical platforms described are intended for translational research and preclinical support. Research Use Only (RUO). Not for use in diagnostic procedures.