Multiplex Profiling of Central Appetite and Peripheral Energy Metabolism
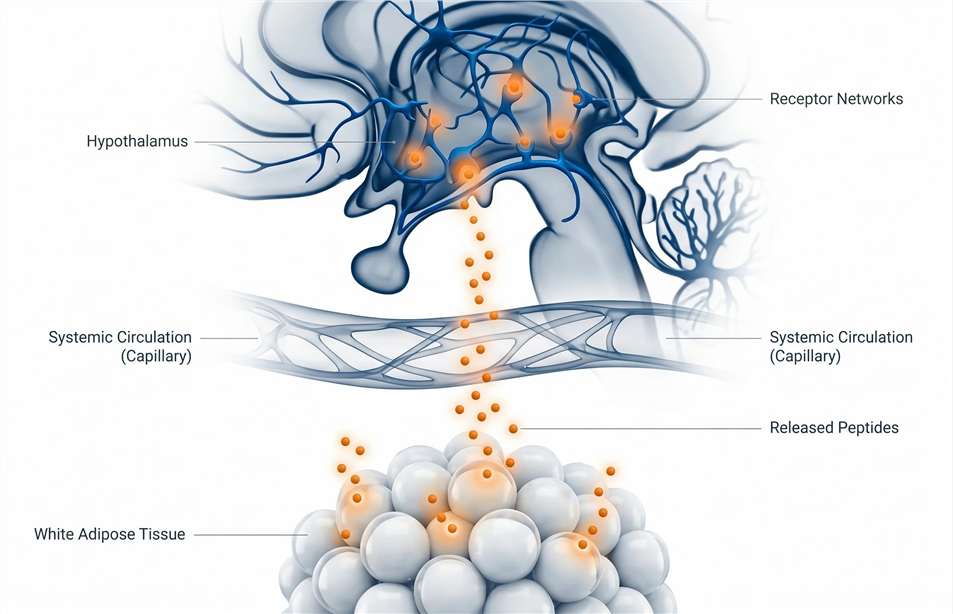
Appetite and energy balance are regulated by coordinated signaling networks across adipose tissue, pancreatic endocrine pathways, gut-derived peptides, and central hypothalamic circuits. Evaluating anti-obesity therapeutics or lipolytic agents requires a systemic assessment rather than the measurement of isolated biomarkers.
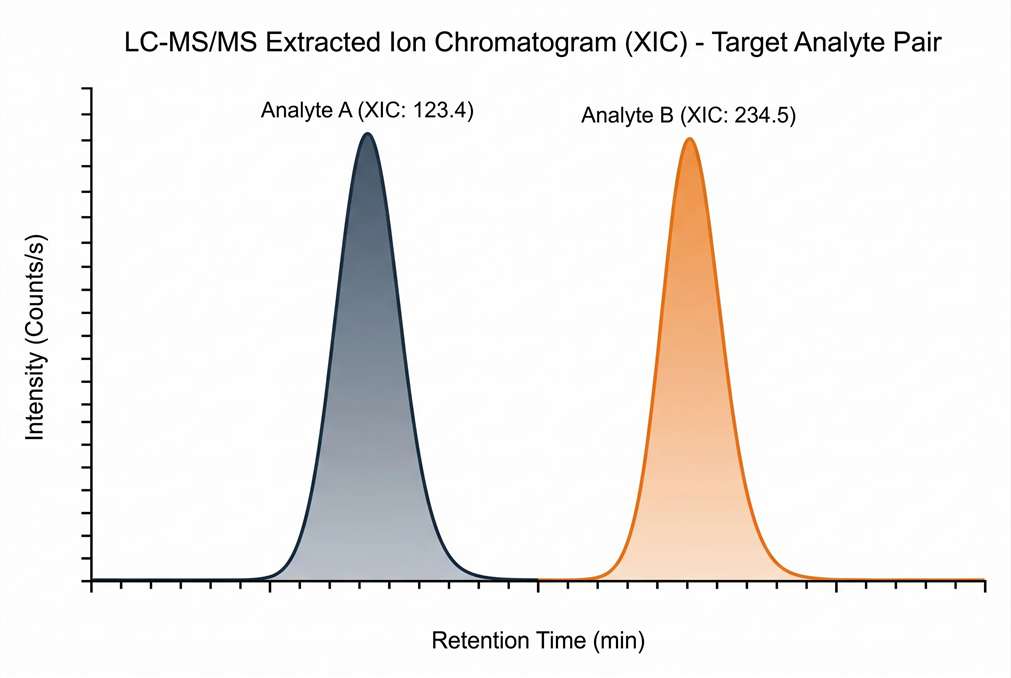
Our Appetite and Energy Metabolism Hormone Panel utilizes targeted liquid chromatography-tandem mass spectrometry (LC-MS/MS) to simultaneously quantify signals that drive hunger (orexigenic neuropeptides), promote satiety (anorexigenic peptides), and regulate basal energy expenditure (adipokines). This approach provides a direct, quantitative readout of the physiological cross-talk between peripheral energy stores and central behavioral control.
Preclinical Applications in Anti-Obesity Drug Discovery
This multiplex panel supports preclinical drug discovery and translational research by providing quantitative bioanalytical data across diverse and rigorous study designs:
Metabolic Hormone Panel Configurations
We offer customizable panel configurations tailored to specific mechanisms of action. Assays are structured into functional biological cores to streamline biomarker selection:
| Biological Core Focus | Targeted Multiplex Analytes | Physiological Role |
|---|---|---|
| Adipokine Core | Leptin, Adiponectin, Resistin, Visfatin | Signals long-term energy reserves; regulates systemic insulin sensitivity and lipid metabolism. |
| Central Appetite Core | AgRP, NPY, α-MSH, Orexin A/B | Hypothalamic neuropeptides driving feeding behavior (orexigenic) or energy expenditure (anorexigenic). |
| Metabolic Homeostasis | Insulin, Glucagon, Amylin, C-peptide, Somatostatin | Pancreatic regulation of glucose utilization, postprandial satiety, and counter-regulatory functions. |
| Peripheral Satiety | PYY (Total & 3-36), Ghrelin (Acylated & Des-acyl) | Gut-derived signals regulating acute meal initiation and termination (delayed gastric emptying). |
Custom Target Integration (PK/PD Co-Analysis)
Our LC-MS/MS assays can be customized to include proprietary anti-obesity peptide therapeutics (e.g., multi-receptor agonists or engineered adipokines). This capability enables the simultaneous monitoring of drug concentration (PK) and endogenous endocrine shifts (PD) within the same sample, reducing animal usage and improving data correlation.
Analytical Platforms: LC-MS/MS vs. Multiplex Immunoassays
Multiplex immunoassays (ELISA/Luminex) are suitable for routine screening of high-abundance markers like total Leptin or Insulin in standard plasma samples. However, targeted LC-MS/MS is required for studies involving low-abundance neuropeptides, active/inactive isoform resolution, complex tissue matrices, or translational cross-species comparisons.
| Analytical Capability | Targeted LC-MS/MS Hormone Panel | Multiplex Immunoassays (ELISA/Luminex) |
|---|---|---|
| Low-Abundance Sensitivity | Quantifies ultra-low abundance central neuropeptides (e.g., AgRP, NPY) via specific PRM/MRM mass transitions. | Often lacks the limits of detection required to capture subtle neuropeptide fluctuations in plasma. |
| Matrix Tolerance | Solid-Phase Extraction (SPE) removes lipid interference from adipose tissue and brain homogenates. | High lipid content (e.g., WAT) frequently causes background noise and antibody interference. |
| Translational Utility | Measures conserved amino acid sequences, directly translating across Mouse, Rat, Canine, and NHP models. | Requires purchasing and validating species-matched commercial kits for each animal model. |
| Isoform Resolution | Distinguishes closely related functional isoforms (e.g., acylated vs. unacylated Ghrelin) by exact molecular mass. | Antibodies frequently cross-react between intact active peptides and partially cleaved fragments. |
Peptide Extraction from Adipose Tissue and Hypothalamic Samples
While plasma provides a systemic overview, evaluating local paracrine mechanisms requires analyzing the source tissues. Complex biological matrices present significant analytical challenges for standard extraction methods.
- Adipose Tissue (WAT/BAT): High lipid content causes severe ion suppression in mass spectrometry. Our protocol utilizes specialized delipidation buffers and matrix-matched Solid-Phase Extraction (SPE) to isolate hydrophilic peptides from the hydrophobic bulk, ensuring reproducible recovery rates in DIO models.
- Hypothalamic Punches: Central regulators (AgRP, NPY) act locally within the arcuate nucleus at low concentrations. We deploy micro-extraction protocols to quench endogenous proteases and recover neuropeptides from milligram-level brain biopsies. This synergizes with our targeted neuropeptide quantification platform.
Cross-Species Translational Assays: Mouse to NHP
Commercial immunoassay kits often lack species-specific antibodies for non-human primate (NHP) or canine models, disrupting the continuity of preclinical obesity research. Targeted mass spectrometry circumvents this limitation by detecting the highly conserved amino acid sequences and exact molecular weights of the target peptides. This sequence-based approach allows researchers to maintain consistent, directly comparable analytical methods from early-stage rodent pharmacology through advanced NHP efficacy evaluations.
Bioanalytical Workflow and Quality Control
To ensure quantitative accuracy, our laboratory implements a standardized multi-step quality control workflow optimized for fragile metabolic peptides.
Stabilization
SOP Guidance
Delipidation
Matrix Cleanup
Calibration
Isotope Tracking
Acquisition
PRM Quantitation
1
Sample Stabilization
We provide pre-analytical SOPs for the use of protease and esterase inhibitors required to protect targets like active acylated Ghrelin from hydrolysis during collection.
2
Matrix-Specific Enrichment
Delipidation buffers and SPE protocols selectively concentrate low-abundance peptides while removing bulk proteins and lipids from adipose tissue and plasma.
3
SIL-IS Calibration
Stable Isotope-Labeled Internal Standards (SIL-IS) are spiked into every sample matrix to correct for ion suppression and guarantee quantitative precision.
4
Targeted PRM/MRM Detection
High-resolution mass spectrometers (e.g., Orbitrap or Triple Quadrupole) provide broad dynamic ranges and reliable low-end limits of detection.
Sample Requirements for Metabolic Phenotyping
Energy metabolism hormones respond rapidly to nutritional cues. We provide guidance to ensure sampling strategies (e.g., light/dark cycles) align with experimental objectives without inducing artifactual stress responses.
| Matrix Type | Species & Model Context | Min Volume / Mass | Pre-Analytical Stabilization Notes |
|---|---|---|---|
| Plasma / Serum | DIO Mice, NHP, Clinical Cohorts. | 50 - 100 μL | Requires immediate cold centrifugation and protease/esterase inhibitors. |
| Adipose Tissue (WAT/BAT) | Thermogenesis, tissue-specific knockout models. | 30 - 50 mg | Snap-freeze in liquid N2. Do not use PBS wash. |
| Hypothalamic Punches | Central appetite regulation mapping. | 10 - 20 mg | Snap-freeze immediately upon regional brain extraction. |
| Cell Culture Media | Adipocyte cell lines, Hypothalamic slice cultures. | 100 - 200 μL | Add inhibitors prior to freezing for secretagogue screening. |
Data Deliverables and QC Metrics
Standard data deliverables are tailored to evaluate pharmacological target engagement, efficacy, and systemic metabolic shifts. Our comprehensive bioanalytical reports provide direct statistical insights:
- Validation & QC Report: Details analytical metrics including the Lower Limit of Quantification (LLOQ), assay dynamic range, intra-/inter-batch Coefficient of Variation (CV%), and spike-and-recovery rates for complex matrices.
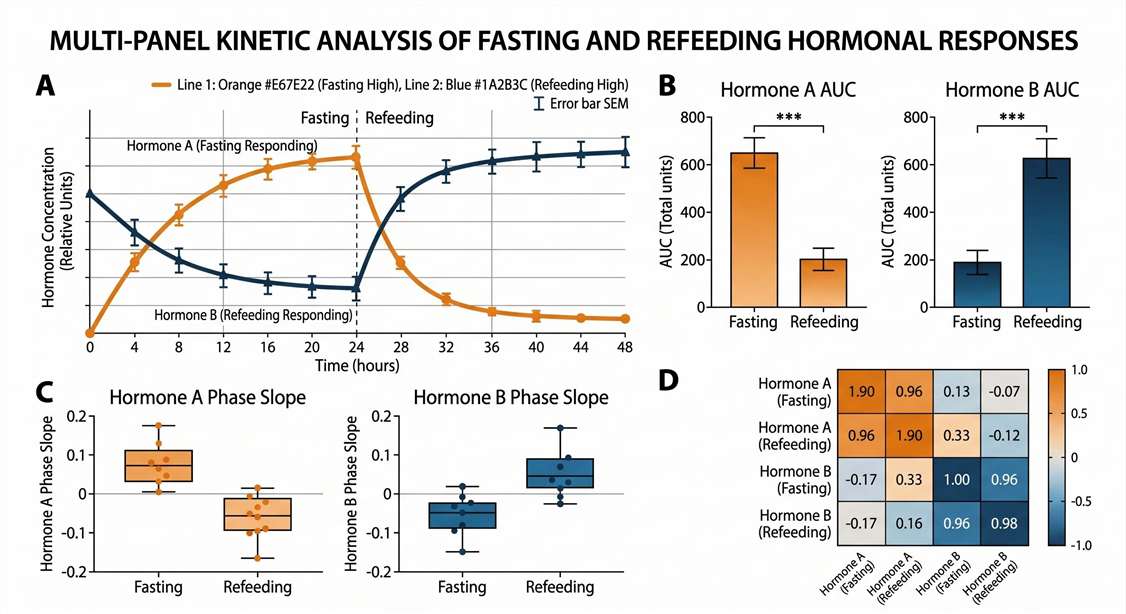
- Kinetic Curves (Feeding vs. Fasting): Visual representation of reciprocal shifts in orexigenic (e.g., active Ghrelin) and anorexigenic (e.g., Leptin) hormones over specific time courses.
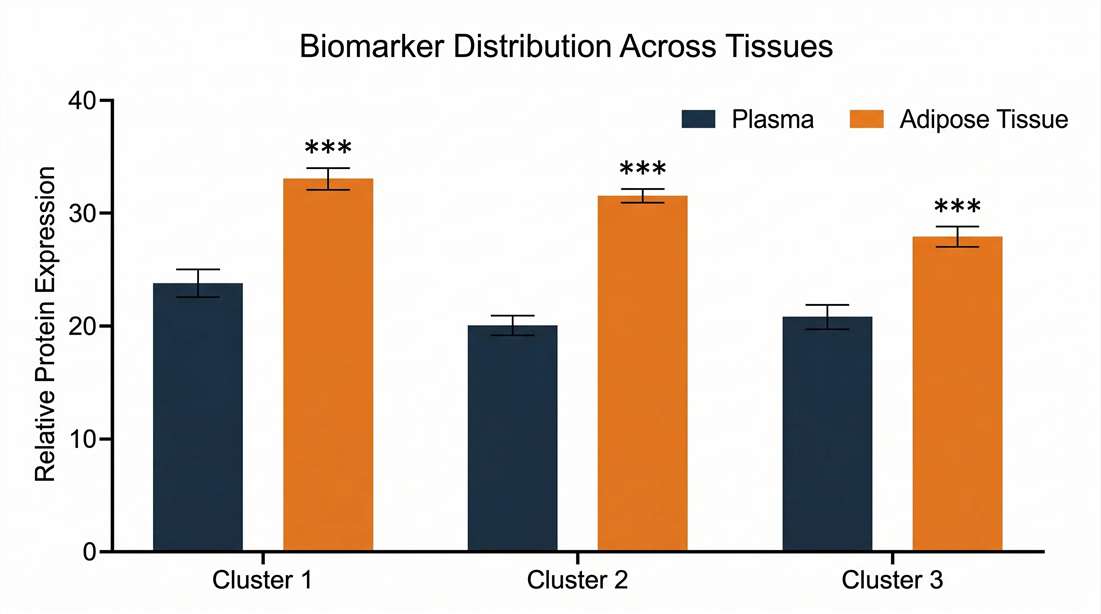
- Tissue-to-Plasma Partitioning: Data matrices displaying concentration gradients between local tissue reservoirs and systemic circulation.
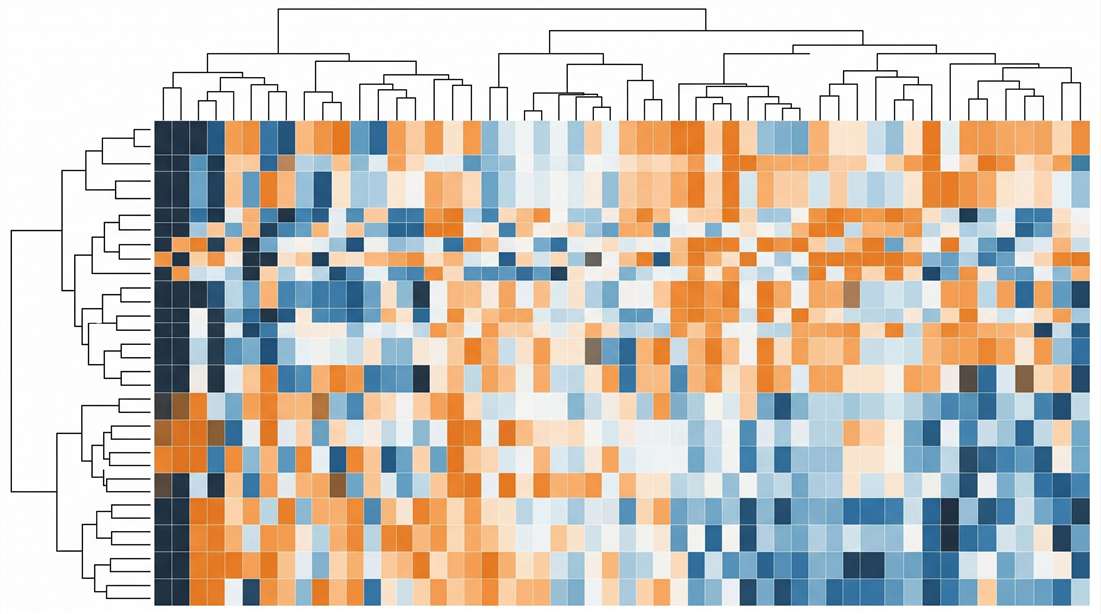
- Metabolic Heatmaps: Color-coded matrices comparing multi-hormone network regulation between vehicle-treated, drug-treated, and control groups.
- Absolute Concentration Matrix: Raw and normalized concentration tables (pg/mL or pM) formatted directly for biostatistical software import.
Demo Results
Absolute Quantification Standard Curve
Feeding vs. Fasting Hormone Kinetics
Adipose Tissue to Plasma Partitioning
Metabolic Hormone Heatmap (Lean vs. DIO)
Disclaimer: All services and analytical platforms described are intended for translational research and preclinical support. Research Use Only (RUO). Not for use in diagnostic procedures.
Frequently Asked Questions (FAQ)
How do you validate peptide recovery from lipid-rich white adipose tissue (WAT)? +
Lipid interference causes severe ion suppression in mass spectrometry. We validate WAT extraction protocols using Stable Isotope-Labeled Internal Standards (SIL-IS). These heavy-labeled counterparts are spiked into the raw tissue homogenate prior to delipidation and Solid-Phase Extraction (SPE). This tracks peptide loss during extraction, ensuring the final reported concentration accurately reflects the biological tissue reservoir.
Why is targeted LC-MS/MS recommended for tracking central appetite peptides like AgRP? +
Central appetite regulators (AgRP, NPY) circulate at much lower concentrations than peripheral adipokines (Leptin, Adiponectin). Conventional immunoassays often lack the low-end limits of detection necessary for CNS peptides. Targeted LC-MS/MS provides the multiplexing capacity and signal-to-noise ratio required to measure minute central signals alongside high-abundance peripheral markers without antibody cross-talk.
Do you require different assay setups for mouse versus NHP plasma? +
No. LC-MS/MS detects the specific amino acid sequence and exact molecular weight of the target peptides. Since critical energy metabolism peptides are highly conserved across mammalian species, the same PRM/MRM method can typically evaluate samples from mice, rats, canines, and NHPs, avoiding the cross-reactivity issues of species-specific immunoassay kits.
How much plasma is required to run the full energy metabolism panel? +
Optimized pre-analytical extraction and LC-MS/MS detection allow for multiplexed metabolic analysis using as little as 50 μL of plasma. This low-volume requirement supports longitudinal serial blood sampling in rodent models, enabling repeated measurements without inducing stress-related endocrine artifacts.