Why Standard BNP/NT-proBNP Assays Fall Short in Drug Development
Single-analyte BNP or NT-proBNP immunoassays are widely used in clinical HF diagnostics, but they consistently underperform in preclinical and translational drug development settings. The natriuretic peptide system is biochemically complex. proBNP undergoes variable N-glycosylation that sterically blocks antibody binding, while mature ANP and BNP are rapidly degraded by neprilysin after collection—within minutes for ANP. Together, these pre-analytical and analytical pitfalls introduce systematic bias that can obscure true pharmacological signals and mislead go/no-go decisions.
The core problem is that commercial immunoassays report a composite signal that cannot distinguish between proBNP, mature BNP 1-32, NT-proBNP, and various BNP fragments. In drug development, molecular specificity matters. Without it, you cannot determine whether your candidate increases active BNP or merely shifts the circulating fragment ratio.
Our ANP and BNP Natriuretic Peptide Quantification Panel solves this at the molecular level. Using targeted LC-MS/MS, we independently quantify each natriuretic peptide species with sequence-level specificity, while our proprietary stabilization protocols preserve the in vivo peptide profile from the moment of collection.
What This Panel Helps You Decide
Configurable Natriuretic Peptide Panel
Depending on your therapeutic target and disease model, our panel can be configured to cover the key functional domains.
| Functional Axis | Selected Target Analytes | Relevance to Drug Discovery |
|---|---|---|
| Cardiac Stretch & Volume | ANP 1-28, proANP 1-98, BNP 1-32, NT-proBNP, proBNP 1-108 | Core biomarkers of ventricular wall stress. Essential for HF diagnosis, staging, and monitoring therapeutic reverse remodeling. |
| Neurohormonal Activation | CNP-22, CNP-53, MR-proANP, ADM | Indicators of systemic neurohormonal compensation. Useful for assessing ARNI combination therapy effects. |
| Fibrosis & Remodeling | Galectin-3, ST2, PIIINP, MMP-2, TIMP-1 | Profibrotic and extracellular matrix remodeling markers that complement natriuretic peptide data for comprehensive HF phenotyping. |
This panel integrates with our RAAS and Vasoactive Peptide Panel and HPA Axis Stress Hormone Panel for a holistic cardiorenal view.
LC-MS/MS for proBNP and Natriuretic Peptide Quantification
We address the challenges of glycosylation interference and peptide instability through two complementary strategies.
Sequence-Level Specificity with LC-MS/MS
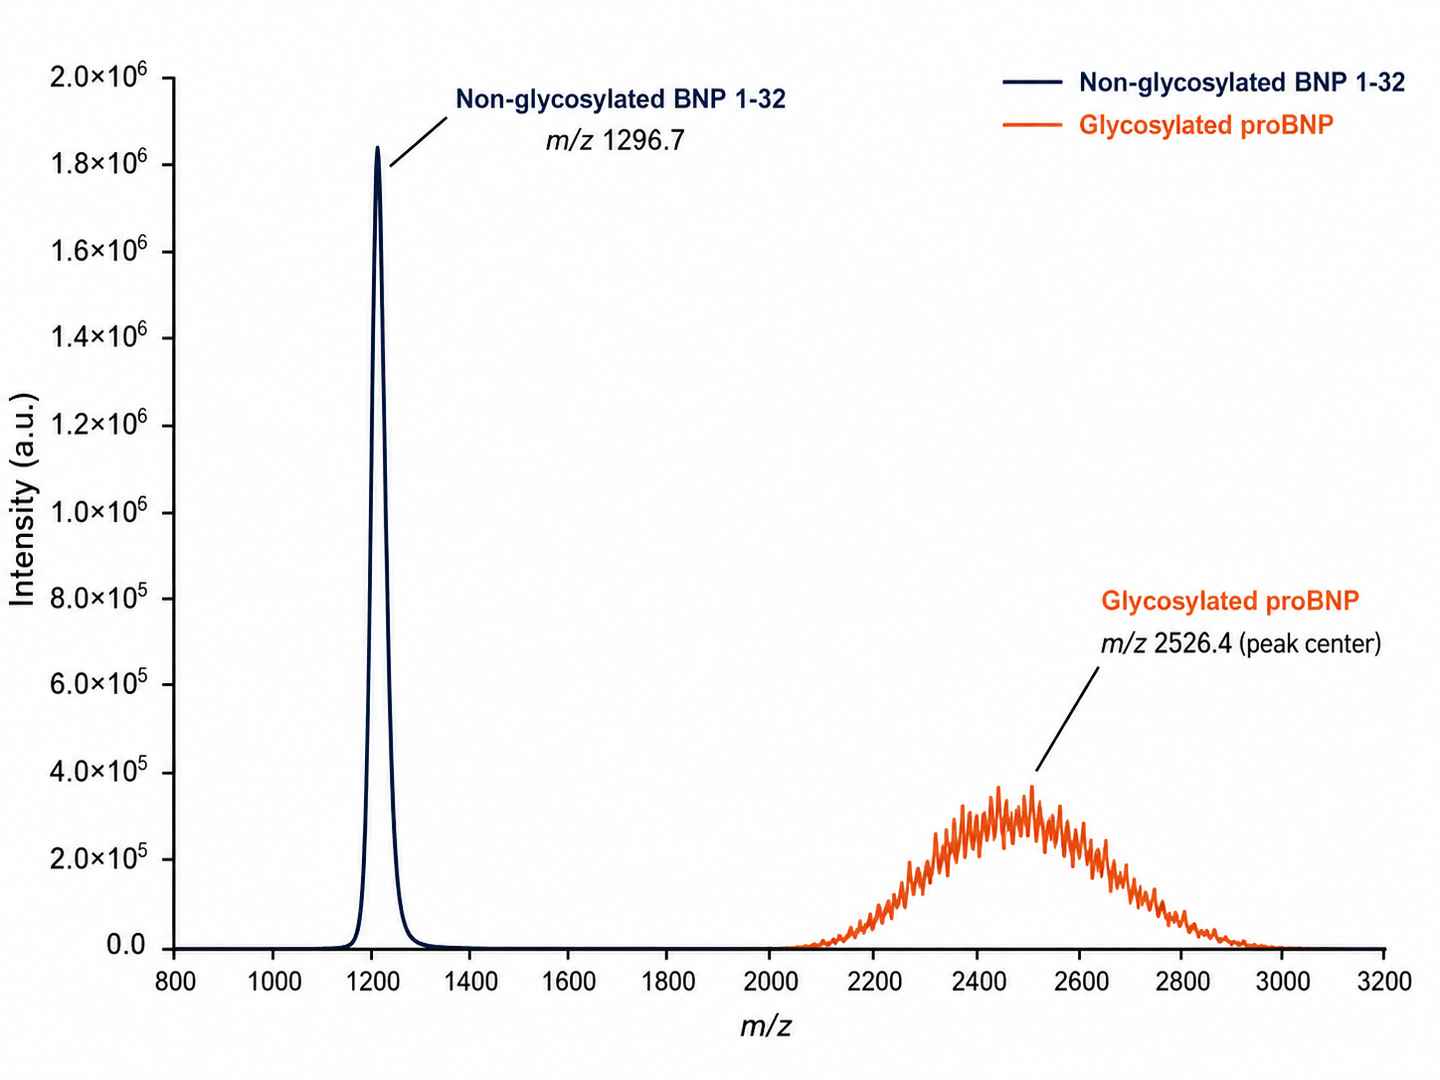
Unlike antibody-based methods, targeted LC-MS/MS differentiates proBNP, mature BNP 1-32, NT-proBNP, and ANP 1-28 based on exact mass-to-charge ratios and fragmentation patterns. The cyclic disulfide bridge structure of ANP and BNP is preserved and used for targeted MRM transitions. Glycosylated proBNP species are identified by characteristic mass shifts and resolved from non-glycosylated forms. This means we can report total proBNP, mature BNP, and NT-proBNP as independent concentrations—something no immunoassay can do. Internal links to neuropeptidomics platform provide access to our broader peptidomics capabilities.
Pre-Analytical Stabilization Protocol
ANP has a plasma half-life of only 2–4 minutes. BNP survives about 20 minutes. Standard EDTA collection fails to inhibit neprilysin and aminopeptidases that rapidly degrade these peptides. Our approach uses a proprietary multi-target protease inhibitor cocktail, added at the point of collection, that specifically blocks neprilysin, aminopeptidase N, and insulin-degrading enzyme. Blood must be drawn into pre-chilled tubes containing this cocktail, processed at 4°C within 15 minutes, and flash-frozen at −80°C. This protocol preserves the in vivo natriuretic peptide profile and is the foundation of reliable data.
Platform Specifications and Detection Performance
We deploy high-resolution LC-MS/MS platforms for optimal natriuretic peptide quantification, achieving sensitivity and specificity that immunoassays cannot match.
- pg/mL sensitivity
High-sensitivity detection for low-abundance ANP and BNP using PRM with isotope-labeled internal standards. - >90% MS/MS Peptide Coverage
HCD and ETD fragmentation for high-confidence identification of cyclic natriuretic peptides. - 1% FDR Stringent Filtering
Ensures data reliability and reproducibility across biological replicates. - PRM & SureQuant™ Quantification
Absolute quantification using targeted acquisition with isotope-labeled internal standards. - Glycosylation-Resolved Detection
Distinguishes glycosylated proBNP from non-glycosylated forms by characteristic mass shifts. - Low Input Compatibility
Deep coverage from as little as 100 μL plasma or 20 mg cardiac tissue.
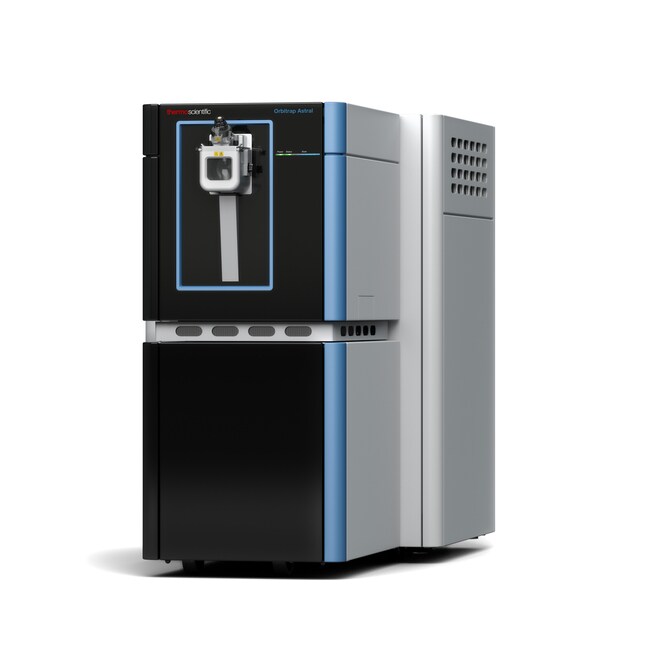 Orbitrap Astral™
(Fig from Thermo Scientific)
Instrument Capability Overview
| Feature | Orbitrap Astral™ | timsTOF Pro | Q Exactive HF-X |
|---|---|---|---|
| Scan Speed | Up to 200 Hz | ~100 Hz (PASEF) | ~20–25 Hz |
| Quantification | Label-free, PRM, SureQuant™ | Label-free, DIA, PRM | Label-free, TMT |
| Peptide Coverage | >90% MS/MS | >90% MS/MS | ~85% MS/MS |
| Low-Abundance | Single-peptide resolution | Ion mobility separation | Standard |
Comparative Analysis of Natriuretic Peptide Quantification Approaches
| Dimension | Creative Proteomics LC-MS/MS | Typical ELISA/Immunoassay | Standard MS-Based Service |
|---|---|---|---|
| Multiplexing | 5+ NPs per run (ANP, BNP, NT-proBNP, proBNP, CNP) | 1–2 per assay | Unlimited (discovery mode) |
| Glycosylation Handling | Resolves glyco vs non-glyco proBNP forms by mass shift | Glycosylation may affect antibody epitope accessibility | Glycopeptides detected but not resolved from non-glyco forms |
| Molecular Specificity | Distinguishes proBNP, BNP 1-32, NT-proBNP independently | Reports combined signal from proBNP, BNP, and fragments | Detects tryptic peptides; intact species not preserved |
| Sensitivity | pg/mL (PRM with isotope-labeled ISTD) | pg/mL range with antibody-based signal amplification | ng/mL range in standard discovery mode |
| Stabilization | Proprietary multi-target inhibitor cocktail | Standard EDTA plasma collection | Standard collection protocols |
| Sample Input | ≥100 μL plasma or 20 mg tissue | Varies by kit | ≥50 μg protein |
| PTM Resolution | Detects amidation, glycosylation, disulfide bridging | PTM detection depends on antibody specificity | Not addressed in standard workflow |
Heart Failure Drug Development Applications
Our panel is designed to support specific R&D tasks across the cardiovascular drug development pipeline.
- Target Engagement in ARNI Programs. Quantify ANP and BNP accumulation following neprilysin inhibition to confirm pharmacodynamic activity of sacubitril/valsartan-like candidates.
- HFpEF Phenotyping. Use NT-proBNP/BNP ratios and proBNP processing efficiency to subclassify HFpEF models and evaluate compound effects on diastolic dysfunction.
- Cardio-Renal Syndrome. Profile natriuretic peptides alongside RAAS peptides to dissect the interplay between cardiac decompensation and kidney function decline.
- Preclinical Safety Assessment. Monitor ANP and BNP as early indicators of drug-induced cardiac stress or hemodynamic overload in toxicology studies.
- Biomarker Surrogate Endpoint Validation. Correlate MS-based natriuretic peptide data with echocardiographic, hemodynamic, and histopathological endpoints.
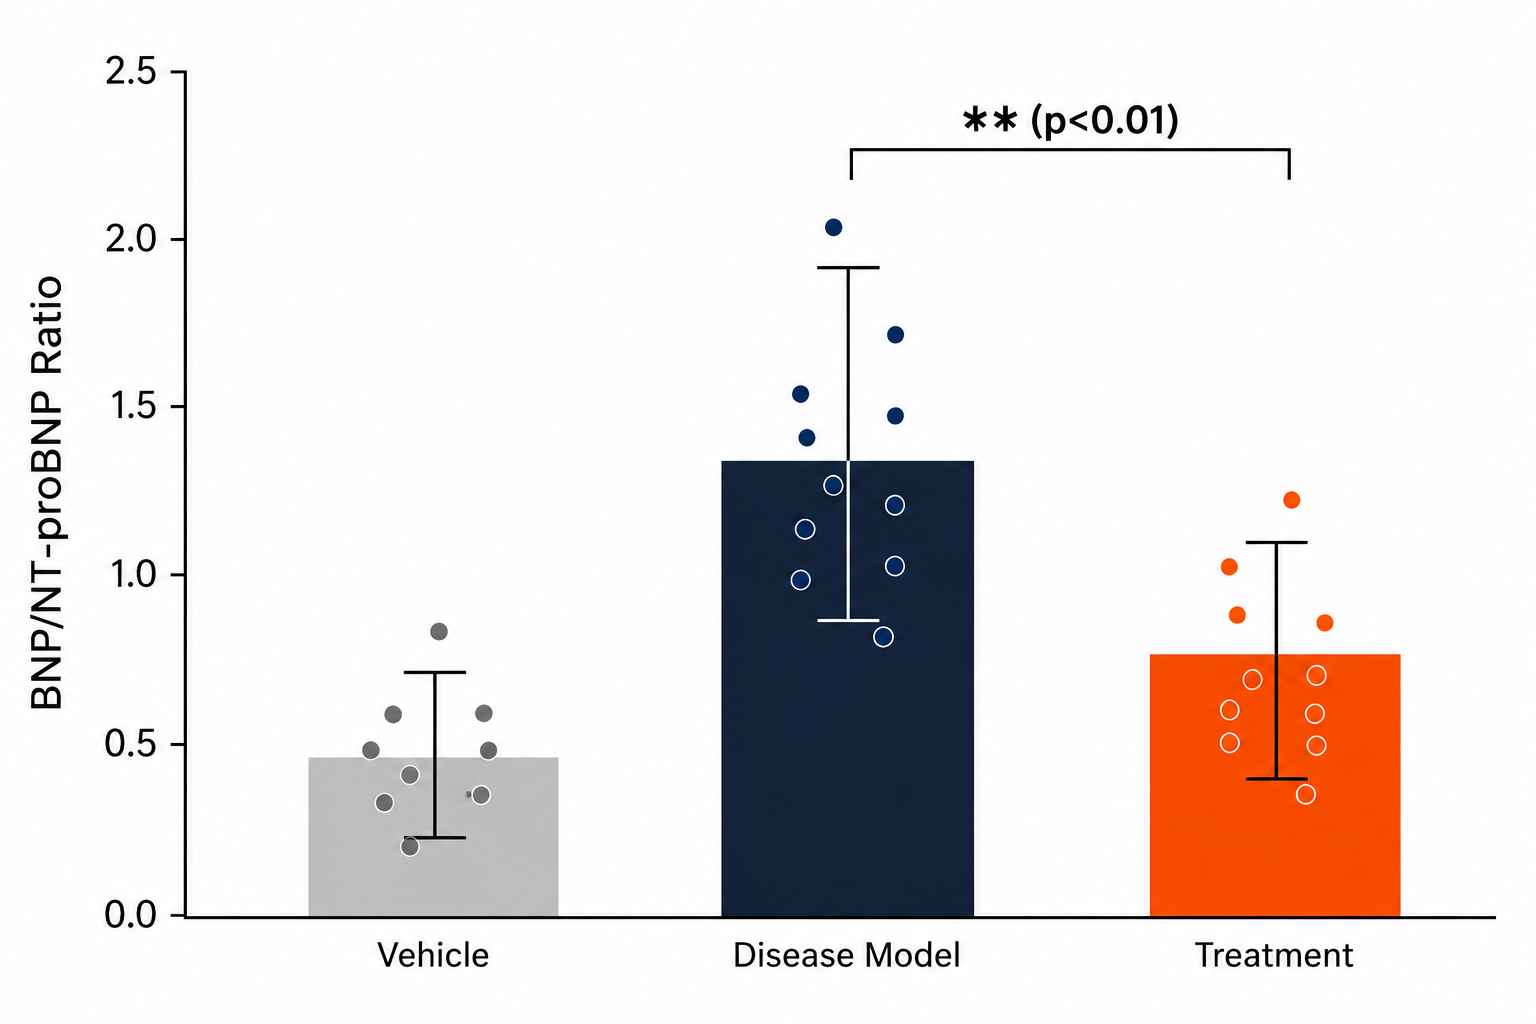
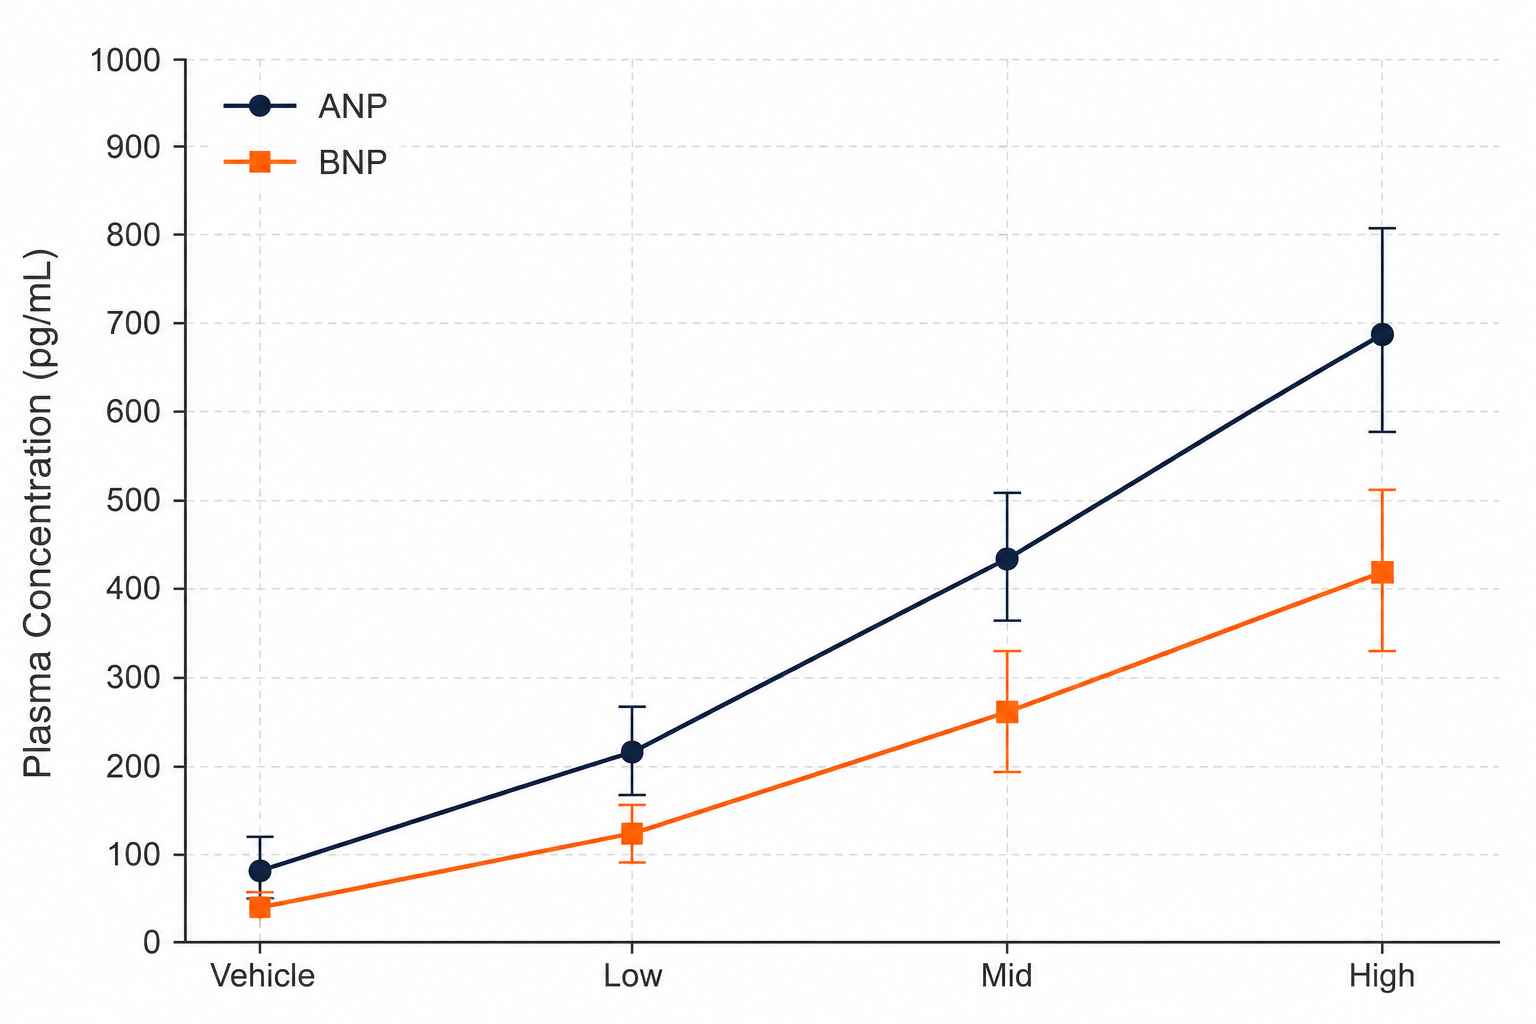
Natriuretic Peptide Panel Demo Data
BNP / NT-proBNP Ratio Analysis
Drug-Response Stratification
Glycosylation Pattern Profiling
Bioanalytical QC Package
Sample Collection Requirements for Natriuretic Peptide Analysis
| Sample Type | Species / Context | Min Volume / Mass | Critical Pre-Analytical SOPs |
|---|---|---|---|
| Plasma (EDTA) | Rodent, NHP, Human | 100 μL | Must be collected into pre-chilled tubes with neprilysin inhibitor cocktail. Standard EDTA alone is not sufficient to arrest ANP/BNP degradation. |
| Serum | Rodent, NHP, Human | 200 μL | Collect in serum separator tubes. Add protease inhibitors immediately. ANP recovery from serum may be lower due to clotting-associated proteolysis. |
| Heart Tissue (Atrium/Ventricle) | Rodent Models | 20 – 50 mg | Snap-freeze in liquid nitrogen < 30 seconds after excision. Homogenize in acidified extraction buffer containing protease inhibitors. |
| Urine | Rodent, Human | 500 μL | Collect on ice with inhibitor cocktail. Centrifuge at 4°C to remove debris. ANP and BNP are detectable in urine but at lower concentrations than plasma. |
| Cell Supernatant | Ex vivo / In vitro | 200 μL | Add inhibitor cocktail immediately upon collection. Centrifuge at 4°C, flash-freeze supernatant within 10 minutes. |
(Consult with our scientific team prior to initiating your in vivo study for tailored guidance on collection protocols.)
Deliverables: What You Receive
- Natriuretic Peptide Quantification Report (PDF)
Complete summary of all detected and quantified peptides across all samples, with statistical analysis and ratio calculations (BNP/NT-proBNP, ANP/BNP). - Raw Data Files
Full LC-MS/MS raw data in standard format (Thermo .raw or Bruker .d) for archival and regulatory submission support. - Quantification Table (CSV)
Peptide IDs, retention times, peak areas, absolute concentrations (pg/mL), and QC metrics for each individual NP species. - Internal Standard Recovery Report
Recovery rates for each isotope-labeled standard, ensuring data integrity across the analytical batch. - Comparative Statistics
Fold-change analysis, p-values, PCA plots, and dose-response curves for multi-group and multi-dose study designs. - Optional: Glycosylation Profiling Add-On
Semi-quantitative assessment of proBNP glycosylation occupancy by deconvoluted intact mass analysis.
Why is LC-MS/MS preferred over immunoassays for BNP measurement? +
FDA-cleared BNP immunoassays report a composite signal that includes proBNP, BNP 1-32, and fragments. In drug development, molecular specificity is essential. LC-MS/MS independently quantifies each species without cross-reactivity or glycosylation interference.
How do you handle proBNP glycosylation? +
Our LC-MS/MS method detects intact proBNP 1-108 alongside glycosylated forms by monitoring mass transitions unaffected by glycan moieties. Total proBNP, mature BNP, and NT-proBNP are reported as separate concentrations.
Can you distinguish active BNP, NT-proBNP, and proBNP in a single assay? +
Yes. Unique MRM transitions for BNP 1-32 (cyclic), NT-proBNP (linear), and proBNP 1-108 (full-length) are quantified simultaneously from the same injection.
What collection protocol is needed for ANP? +
ANP has a half-life of only 2–4 minutes. Pre-chilled tubes with our multi-protease inhibitor cocktail (targeting neprilysin and IDE) are required. Plasma must be separated within 15 minutes.
Can this panel support ARNI pharmacodynamic studies? +
Yes. The panel quantifies neprilysin substrate accumulation (ANP, BNP, CNP). ANP/BNP and BNP/NT-proBNP ratios serve as PD markers of NEP inhibition.
Is the method validated for both rodent and human plasma? +
Yes. Rat, mouse, and human plasma have been validated. Cross-species sequence differences are accounted for in MRM transition design.
Disclaimer: All services and analytical platforms described are intended for translational research and preclinical support. Research Use Only (RUO). Not for use in diagnostic procedures.