Why Precision in Mineral Homeostasis Matters for Bone & CKD-MBD Research
In translational research, relying on conventional assays for mineral metabolism often introduces significant analytical challenges. The endocrine regulation of calcium and phosphate—governed by the kidney-bone axis—is tightly controlled. Disruption in this axis not only leads to skeletal deterioration but also drives systemic pathologies such as vascular calcification and secondary hyperparathyroidism. Therefore, the bioanalytical tools used to measure these pathways must be highly precise and specific.
| Analytical Challenge | Why It Happens | Impact on R&D Decisions |
|---|---|---|
| Structural Epimer Interference | Standard immunoassays cannot distinguish 25(OH)D3 from its biologically distinct 3-epimer (3-epi-25(OH)D3). | Artificially inflates the measured active vitamin D pool, confounding the true efficacy of pharmacological interventions. |
| Sub-Physiological Abundance Gap | Active hormonal regulators, such as 1,25(OH)2D, circulate at extreme sub-picogram concentrations. | Standard methods lack sensitivity, yielding noisy data or falling below the LLOQ when tracking trace-level shifts in volume-limited models. |
Target Applications: From Early R&D to Translational Studies
This service provides quantitative data for scientists evaluating pharmacological efficacy and underlying disease mechanisms. Our coordinated assessment strategy is dynamically configured for research teams focusing on:
A Coordinated Assessment Strategy for the Bone–Kidney Axis
Because vitamin D sterols (lipophilic small molecules), peptide hormones (hydrophilic macromolecules), and bone turnover markers (structural protein fragments) exhibit vastly different physicochemical properties, multiplexing them into a single default assay compromises analytical sensitivity.
Our approach avoids rigid panels by coordinating distinct, optimized workflows to deliver an integrated view of mineral homeostasis:
- Vitamin D Metabolite Profiling: Comprehensive measurement including 25(OH)D2/D3, active 1,25(OH)2D2/D3, and the catabolic 24,25(OH)2D3.
- Bone Turnover Markers (BTMs): Contextual assessment of bone formation (e.g., P1NP, Osteocalcin) and bone resorption (e.g., CTX-I, NTX) to capture real-time skeletal dynamics.
- Peptide and Protein Regulators: Coordination with targeted mass spectrometry quantitation of neuropeptidomics or specialized protein assays for intact PTH, FGF23, and Klotho.
Final analyte combinations are configured based on matrix type, available sample volume, and the required lower limit of quantification (LLOQ) for each specific marker class.
Resolving Epimer Interference and Sensitivity Limitations
Resolving 3-epi-25(OH)D3 Epimer Interference
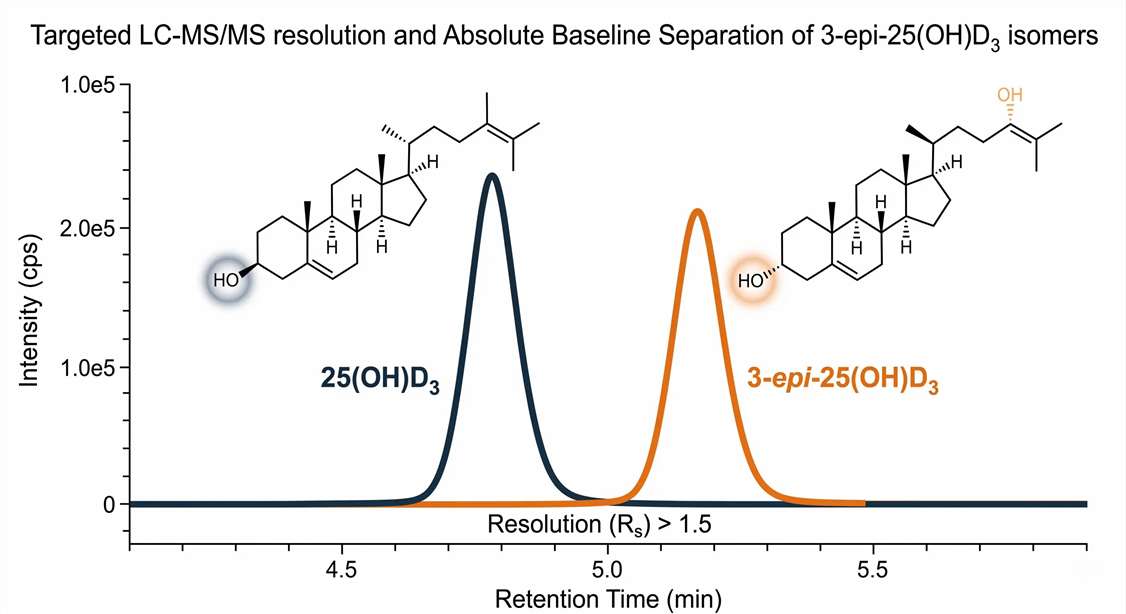
The 3-epimer of 25(OH)D3 can account for a significant proportion of total circulating 25(OH)D, particularly in early developmental models or following high-dose therapeutic interventions. Because standard diagnostic assays cross-react with this epimer, they inadvertently mask underlying deficiencies or altered metabolic pathways. Our targeted LC-MS/MS chromatography provides clear baseline separation, allowing researchers to accurately quantify only the biologically relevant metabolites.
Sub-pg/mL Sensitivity for Micro-Volume Rodent Samples
Quantifying the active 1,25(OH)2D metabolite is analytically demanding in low-volume preclinical in vivo studies. We deploy derivatization-supported LC-MS/MS protocols that improve the ionization efficiency of these low-abundance targets. This technique enables the quantification of trace-level active vitamin D metabolites directly from small rodent serum aliquots (as low as 50 μL), preserving biological samples for parallel multi-omics analyses.
Technical Workflow and Analytical Quality Control
Ensuring reproducibility across diverse matrices—ranging from serum to heavily mineralized bone tissue—requires strict analytical rigor and validated Standard Operating Procedures (SOPs).
Matrix Evaluation
Analyte Extraction
Targeted Derivatization
Isotope-Dilution LC-MS/MS
1
Pre-analytical Assessment & Micro-Aliquoting
Quality Control: Comprehensive visual inspection for hemolysis or lipemia is performed, as these factors can suppress ionization. Sample volumes are strictly partitioned to support configured marker tracks without unnecessary volume waste.
2
Extraction Optimization & Bone Demineralization
Methodological Control: Tailored Liquid-Liquid Extraction (LLE) or Solid-Phase Extraction (SPE) is deployed. For bone tissue extracts, specialized protocols mitigate the severe ion suppression caused by high calcium and phosphate concentrations, avoiding harsh EDTA treatments that irreversibly degrade target peptide integrity.
3
Targeted Derivatization (For Ultra-Low Abundance)
Reaction Monitoring: The application of specific chemical tagging (e.g., PTAD reagents) is strictly monitored for reaction completeness. This critical step enables the LLOQ for 1,25(OH)2D3 to reach the sub-pg/mL range.
4
High-Resolution LC-MS/MS Acquisition
Quantitative Accuracy: Absolute quantification utilizes perfectly matched Stable Isotope-Labeled Internal Standards (SIL-IS, e.g., d3-25(OH)D3) to normalize extraction recovery variations and correct for instrument fluctuations across all longitudinal experimental cohorts.
Data Deliverables and Physiological Interpretation
Beyond delivering concentration tables, we provide data interpretation support, including physiological correlation analysis, to translate raw analytical data into biological insights.
Sensitivity Validation
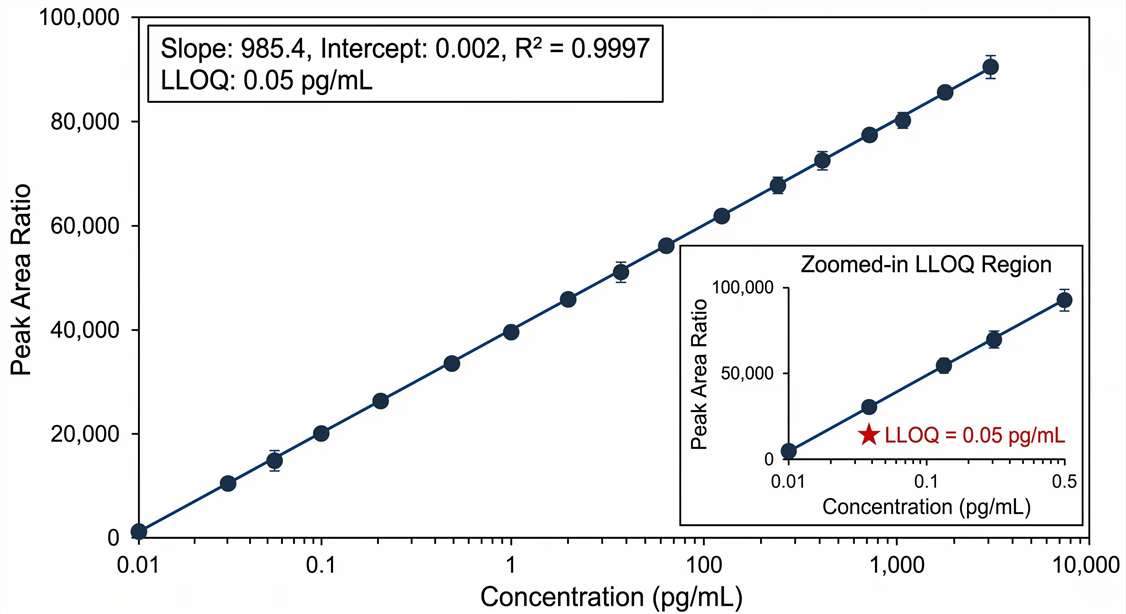
Multi-point linear regression plots for derivatized 1,25(OH)2D3, highlighting the sub-pg/mL detection limits achieved for specific in vivo models.
Metabolic Flux (VMR)
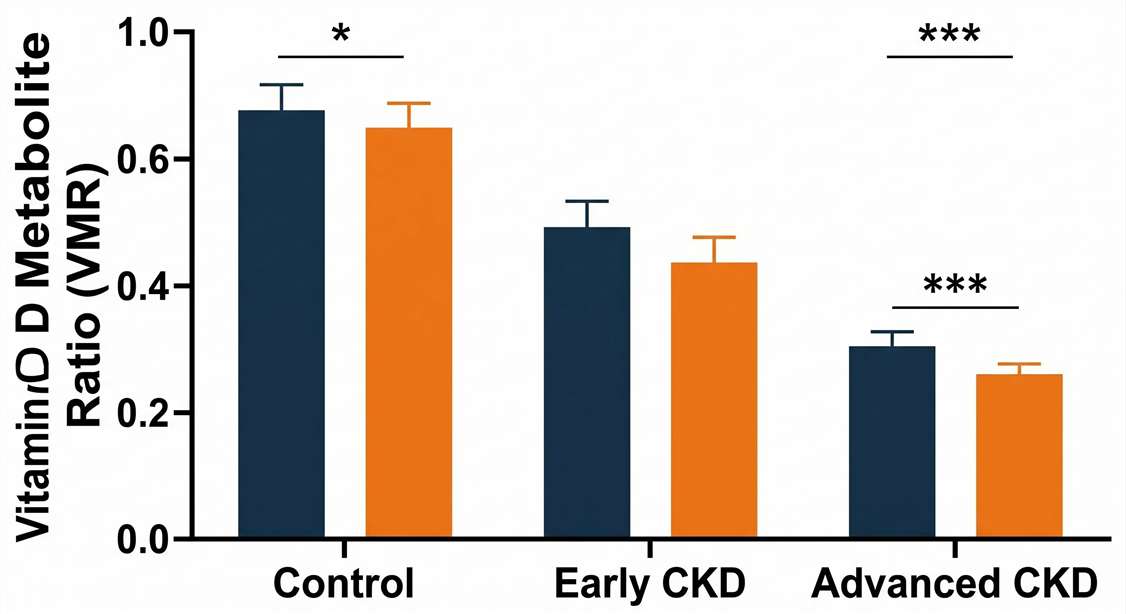
Grouped charts plotting the VMR (24,25(OH)2D3 / 25(OH)D) across cohorts, serving as a functional readout of CYP24A1 enzymatic activity and overall catabolic flux.
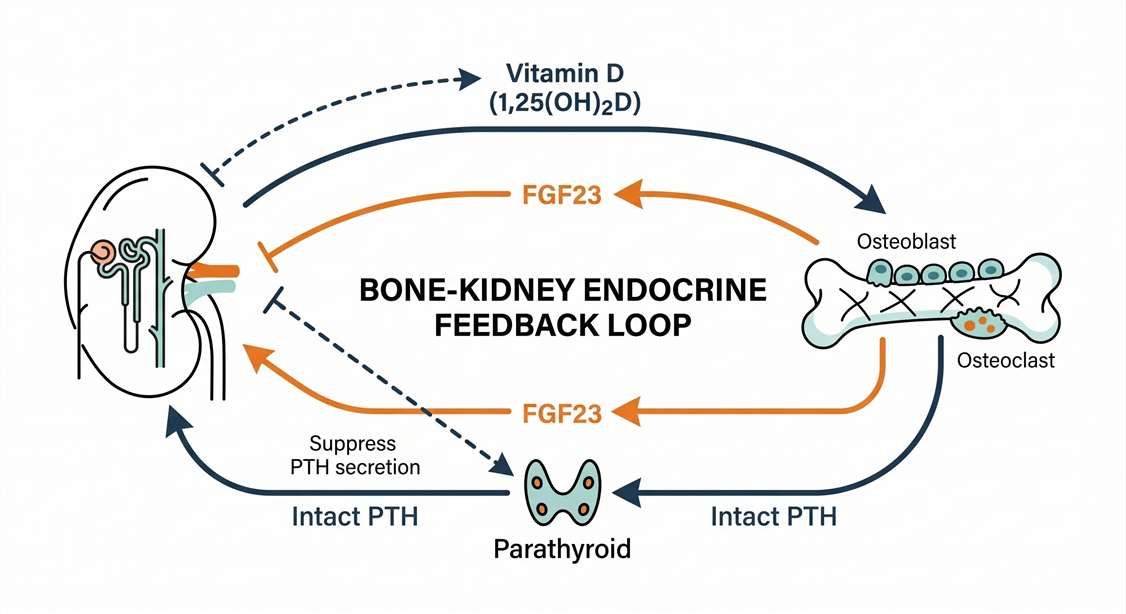
Endocrine Correlation
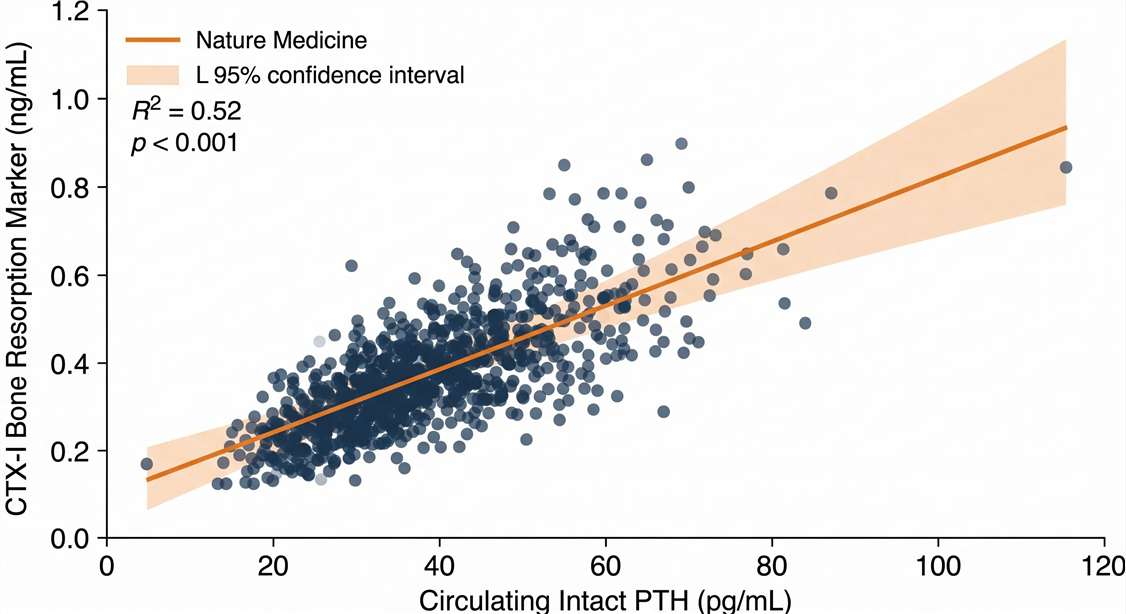
Scatter plots correlating circulating intact PTH or FGF23 levels against bone resorption markers (such as CTX-I) to evaluate the intactness of the bone-kidney feedback loop.
Complex Matrix QC
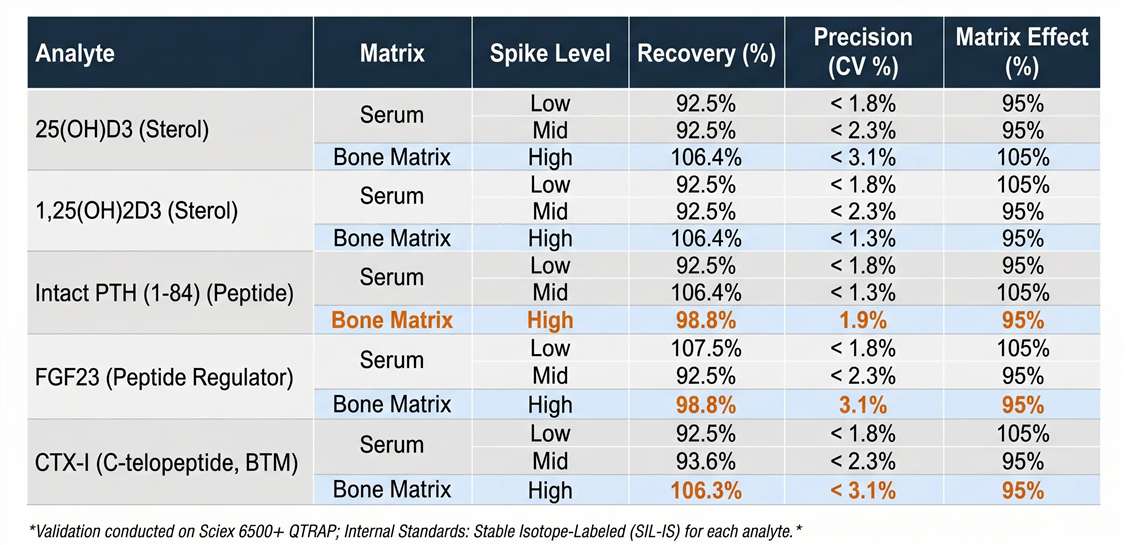
Tabular data documenting inter-day and intra-day assay precision, coefficient of variation (CV%), and absolute recovery rates from complex matrices like bone extracts.
Sample Requirements Aligned with Target Stability
Our analytical strategy ensures methodological consistency across preclinical models and human clinical samples.
| Matrix Type | Minimum Volume / Mass | Biological Context / Timing | Handling SOP Requirements |
|---|---|---|---|
| Serum / Plasma (Human) | 200 μL | Diurnal timing; fasting states preferred to minimize dietary artifact. | Protect from UV light; rapid cold centrifugation required. |
| Serum / Plasma (Rodent) | 50 - 100 μL | Longitudinal rodent OVX or severe renal failure models. | Highly sensitive extraction protocols for sample-sparing multiplexing. |
| Bone Tissue Extracts | 30 - 50 mg | Local microenvironment mapping in the femur or tibia. | Snap-freeze immediately in LN2; avoid EDTA demineralization prior to MS analysis. |
Note: For projects investigating secondary osteoporosis linked to systemic stress or inflammation, coordinating this panel with an HPA-axis stress hormone panel can provide a comprehensive systemic evaluation.
Targeted LC-MS/MS vs. Routine Immunoassays
| Analytical Parameter | Coordinated LC-MS/MS Strategy | Routine Clinical Assays (CLIA/ELISA) |
|---|---|---|
| Epimer Separation | Absolute baseline resolution; actively excludes 3-epi isomers. | Poor specificity; frequently overestimates active vitamin D status. |
| Low-Abundance Sensitivity | High; optimized for trace rodent samples via specific derivatization. | Often falls below standard physiological limits for 1,25(OH)2D. |
| Matrix Interference | Resistant. Uses SIL-IS to correct for bone/tissue matrix ion suppression. | Susceptible to false signals and cross-reactivity in non-serum matrices. |
| Assessment Scope | Configurable, multi-marker combination strategies across molecular classes. | Strictly limited to rigid, single-marker detection kits. |
Platform Selection Guidelines:
- Routine, high-volume screening of abundant markers where structural specificity is not a primary variable can be adequately supported by conventional immunoassays.
- Targeted LC-MS/MS is recommended when research designs rely on differentiating specific isomers (3-epi exclusion), require the calculation of catabolic metabolic fluxes (such as the VMR), involve severe matrix effects from dense bone tissues, or demand the accurate quantification of ultra-low abundance hormones in restricted rodent sample volumes.
Frequently Asked Questions (FAQ)
Why is resolving the 3-epi-25(OH)D3 epimer necessary for translational research? +
The 3-epimer is biologically distinct and exhibits markedly reduced functional activity at the vitamin D receptor compared to the primary 25(OH)D3 molecule. Because standard diagnostic assays cross-react and sum these molecules together into a single readout, they can falsely elevate total vitamin D measurements. This analytical overlap masks functional deficiencies and confounds the apparent efficacy of pharmacological interventions during preclinical and clinical evaluations.
Can peptide regulators like PTH be measured alongside vitamin D metabolites in small rodent samples? +
Yes, but they require coordinated, fit-for-purpose workflows rather than a single multiplex injection. Due to their vastly differing physicochemical properties (sterols vs. peptides), we configure specialized extraction and analysis parallel tracks from the available sample volume. This ensures both the small-molecule sterols and the larger peptide hormones are measured with maximum accuracy without unnecessarily depleting precious biological samples.
What does the 24,25(OH)2D3 to 25(OH)D ratio (VMR) indicate biologically? +
The VMR serves as a dynamic, functional readout of the CYP24A1 enzyme's catabolic activity. Instead of relying on a static snapshot of circulating precursors, the VMR provides deeper insight into the metabolic flux and degradation rate of vitamin D. This flux is highly responsive to kidney function and parathyroid hormone levels, making it a valuable metric in CKD-MBD and secondary hyperparathyroidism models.
How are bone tissue extracts handled to prevent biomarker degradation? +
Extracting biomarkers directly from bone matrix presents analytical challenges due to extreme mineralization. While some protocols use decalcification agents like EDTA, these chemicals can suppress mass spectrometry signals and degrade delicate peptide structures. Our protocols utilize specialized mechanical pulverization in liquid nitrogen combined with optimized SPE buffers that separate the target hormones from the calcium-phosphate matrix while preserving molecular integrity.
24,25-Dihydroxy Vitamin D and Vitamin D Metabolite Ratio as Biomarkers of Vitamin D in Chronic Kidney Disease
Background
In Chronic Kidney Disease (CKD), the precise regulation of mineral homeostasis is frequently disrupted, leading to secondary hyperparathyroidism and bone disorders (CKD-MBD). Absolute circulating levels of standard 25(OH)D often fail to accurately reflect a subject's true vitamin D status and the actual severity of mineral metabolism disruption. The enzyme CYP24A1 is responsible for catabolizing 25(OH)D into 24,25(OH)2D. Researchers require sensitive, dynamic biomarkers that capture this metabolic flux to properly model disease progression and evaluate novel therapeutic interventions.
Methods
A highly specific targeted LC-MS/MS workflow was utilized to precisely quantify both the primary precursor 25(OH)D and the catabolic product 24,25(OH)2D in a cohort of patients with advancing CKD (Stages 2 through 5). The absolute concentrations derived from the mass spectrometer were then used to calculate the Vitamin D Metabolite Ratio (VMR = 24,25(OH)2D / 25(OH)D). This ratio effectively normalizes the data, mapping the real-time catabolic activity driven by renal hydroxylases rather than just systemic storage.
Results
Diagnostic Limitations of Total 25(OH)D
- The comprehensive LC-MS/MS profiling demonstrated that the calculated VMR provided significantly deeper mechanistic insight than standard total 25(OH)D levels.
- While total 25(OH)D remained relatively static in early-stage disease, both absolute 24,25(OH)2D levels and the VMR decreased substantially as CKD progressed.
VMR as a Superior Indicator of Endocrine Disruption
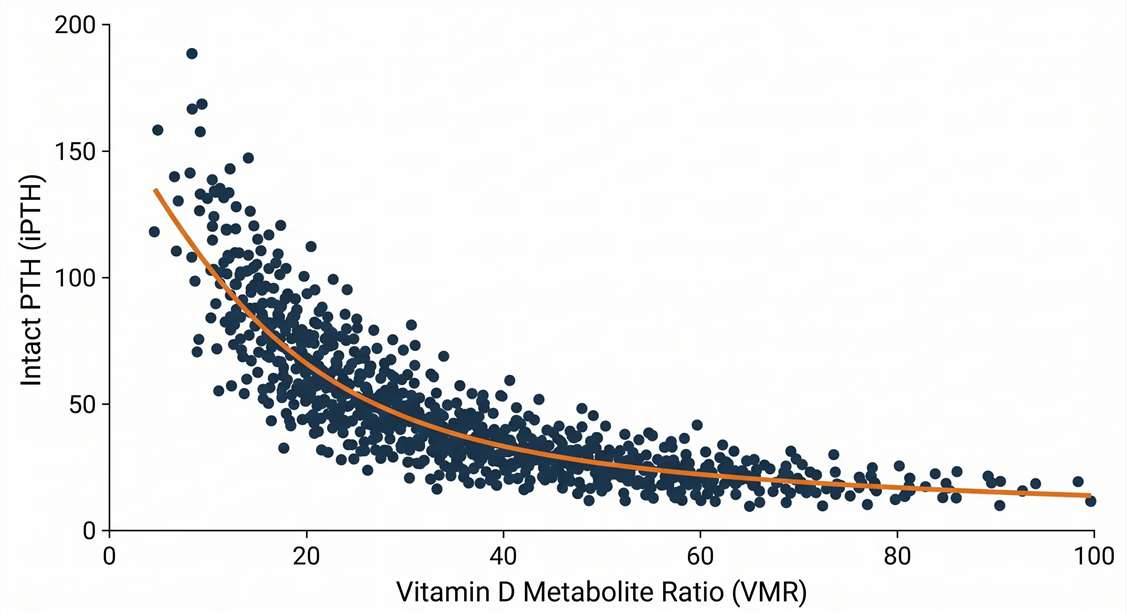
- Crucially, the VMR exhibited a profound inverse correlation with intact parathyroid hormone (iPTH) levels, a major driver of bone loss in renal failure.
- This pivotal relationship is clearly demonstrated in Figure 2 of the referenced study, illustrating how iPTH concentrations rise dramatically as the catabolic VMR ratio declines, effectively signaling the onset of secondary hyperparathyroidism independent of total vitamin D stores.
Conclusion
Coordinated LC-MS/MS assessment enables researchers to calculate advanced, physiological metrics like the VMR. This provides a flux-based indicator of mineral homeostasis and endocrine disruption, offering critical decision-support data for pharmacological therapies targeting the bone-kidney axis.
Disclaimer: All services and analytical platforms described herein are intended exclusively for preclinical, translational, and mechanistic research applications. Research Use Only (RUO). Not for use in diagnostic procedures.