Protein Sequencing

Top-Down Protein Sequencing Service — Intact Mass & Proteoform Analysis

Intact protein mass spectrometry with proteoform-level resolution. Direct observation of PTM combinations, terminal truncations, and sequence variants that bottom-up proteomics cannot resolve.

Intact Mass Analysis Proteoform Resolution ECD/ETD/HCD Fragmentation Native MS

Service Scope

Intact protein analysis without enzymatic digestion for complete proteoform characterization

biotech

Intact Mass

High-resolution intact protein mass measurement on Orbitrap and FT-ICR platforms.

Top-Down MS/MS

ECD, ETD, HCD, and UVPD fragmentation for sequence and PTM localization.

Subunit Analysis

Middle-down approaches for large proteins including intact mAbs (≥150 kDa).

Native MS

Non-denaturing analysis preserving quaternary structure and non-covalent complexes.

No Digestion

Analyze intact proteins — no enzymatic digestion required.

Proteoform-Level

Resolve isoforms, variants, and combinatorial PTMs.

High Resolution

Orbitrap & FT-ICR with ≤3 ppm mass accuracy.

Service Details

Deliverables

Case Study

What Is Top-Down Protein Sequencing?

Top-down protein sequencing is a method of protein identification that either uses an ion trapping mass spectrometer to store an isolated protein ion for mass measurement and tandem mass spectrometry (MS/MS) analysis or other protein purification methods such as two-dimensional gel electrophoresis in conjunction with MS/MS. Top-down proteomics is capable of identifying and quantitating unique proteoforms through the analysis of intact proteins. During mass spectrometry, electrospray ionization is typically used to ionize the intact proteins that are then trapped in a Fourier transform ion cyclotron (Penning trap), quadrupole ion trap (Paul trap) or Orbitrap mass spectrometer. Fragmentation for tandem mass spectrometry is accomplished by electron-capture dissociation or electron-transfer dissociation. Top-down MS proteomics interrogates protein structure through measurement of an intact mass followed by direct ion dissociation in the gas phase.

Unlike bottom-up proteomics, which requires enzymatic digestion of proteins into peptides prior to analysis, top-down sequencing preserves the intact protein throughout the workflow. This is critical because many functionally important features — including combinatorial post-translational modifications (PTMs), N- and C-terminal truncations, sequence variants, and splice isoforms — exist at the intact protein level and can be lost or obscured when proteins are digested into peptides. Each gene can give rise to multiple distinct proteoforms, and top-down mass spectrometry is uniquely positioned to resolve this complexity.

Creative Proteomics provides complete top-down protein sequencing services to directly observe C/N-terminal truncations, confirm 20 to 80 residues from each terminus, and characterize PTM combinations at proteoform-level resolution — capabilities that complement our protein N-terminal sequencing and protein C-terminal sequencing services for complete terminal characterization of biotherapeutic proteins.

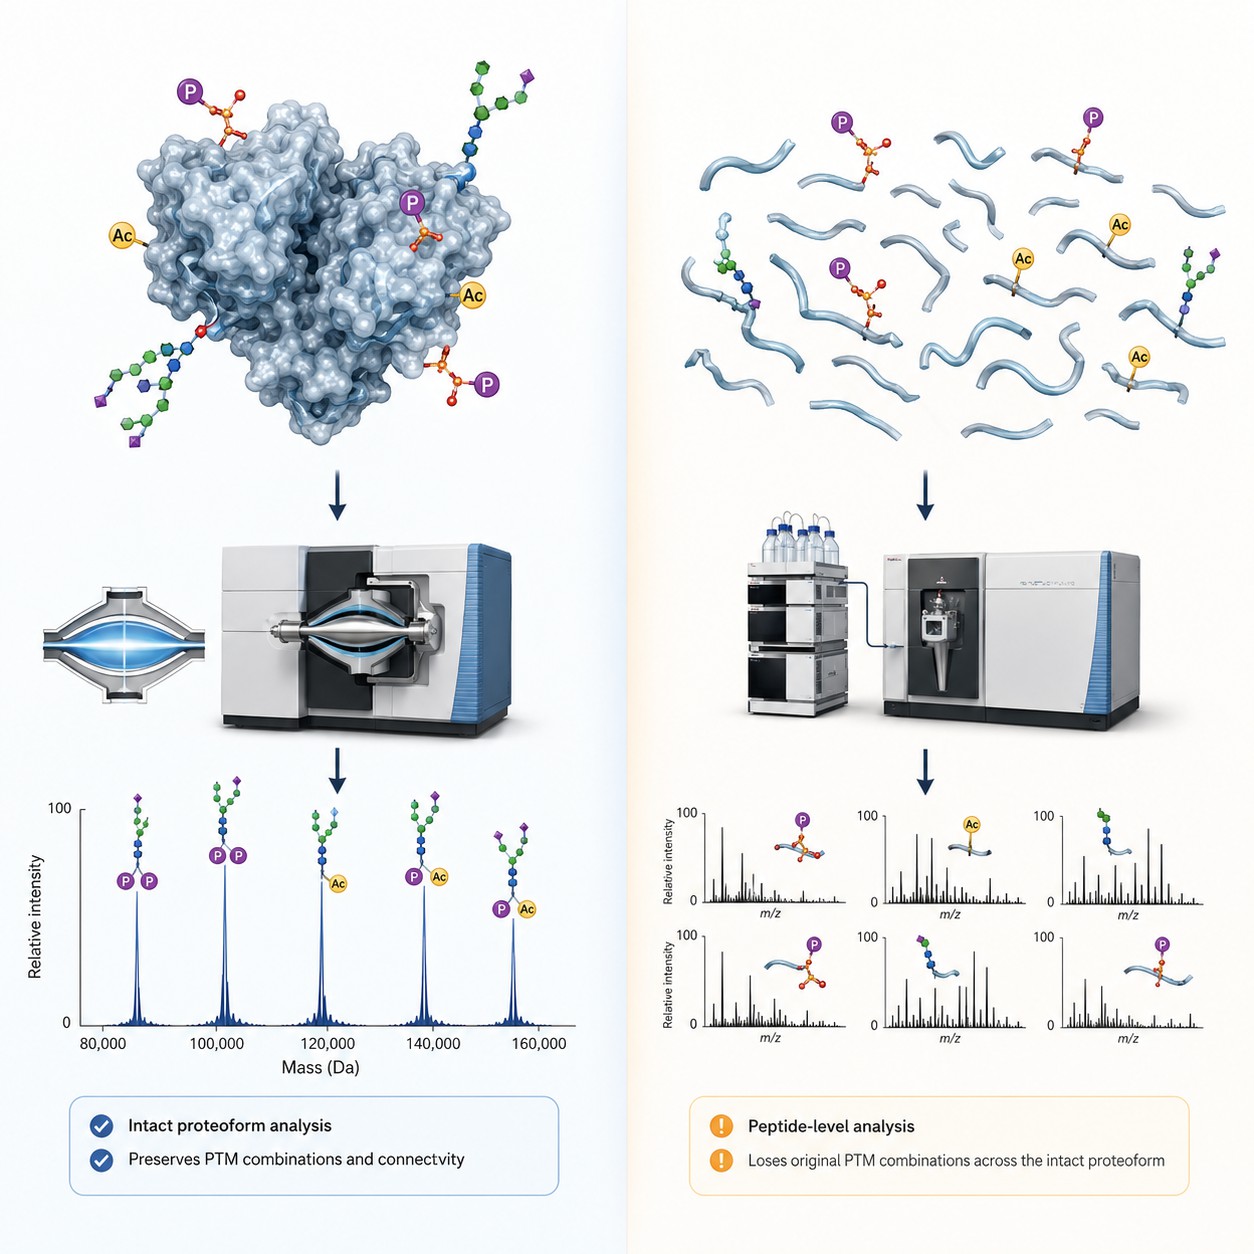
Scientific illustration comparing top-down intact protein analysis versus bottom-up peptide-based proteomics workflows, showing direct proteoform resolution on a clean white background.

Top-Down vs Bottom-Up Proteomics

Understanding the fundamental differences helps select the right approach for your protein characterization goals.

Dimension Top-Down Protein Sequencing Bottom-Up Proteomics
Analytical Target Intact proteins Peptides from enzymatic digestion
Proteoform Resolution Directly distinguishes proteoforms, variants, and PTM combinations Limited — same peptide from different proteoforms cannot be distinguished
PTM Characterization Preserves full PTM connectivity on individual protein molecules May lose PTM context; modifications assigned to isolated peptides
Sequence Coverage Confirms 20–80 residues from N/C-termini; up to 100% for smaller proteins High backbone coverage but may miss terminal regions
Terminal Analysis Direct observation of truncations, signal peptide processing, and blocked termini Terminal peptides may be missed or difficult to assign
Sample Preparation No chemical digestion or enzymatic hydrolysis required Requires trypsin or other protease digestion
Throughput Suited for targeted characterization of individual proteins Suited for large-scale discovery proteomics
Instrument Requirement High-resolution MS: Orbitrap, FT-ICR Standard LC-MS/MS instruments

Our Top-Down Protein Sequencing Services

Creative Proteomics provides protein sequencing analysis services based on the top-down method, using high-resolution mass spectrometry and MALDI ISD technology for comprehensive protein characterization.

scale

Intact Mass Analysis

High-resolution mass measurement of intact proteins under denaturing or native conditions. Reveals the overall modification state, glycosylation profile, and any truncation or processing events — critical for biotherapeutic protein characterization where a single amino acid difference has regulatory implications.

  • Orbitrap and FT-ICR — ≤3 ppm mass accuracy
  • Native or denaturing — conditions matched to your protein
  • Deconvolution — proteoform-level mass assignment
  • 5–150+ kDa range — small peptides to intact mAbs
Orbitrap FT-ICR
broken_image

Top-Down MS/MS Sequencing

Direct fragmentation of intact proteins using ECD, ETD, HCD, or UVPD. Fragment ions are analyzed to determine amino acid sequence, localize PTMs to specific residues, and map N- and C-terminal processing events — all without prior digestion.

  • ECD/ETD — preserves labile PTMs during fragmentation
  • HCD/UVPD — complementary cleavage patterns
  • Sequence localization — maps modifications to specific residues
  • 20–80 residues — confirmed from each terminus
Core Service
join_inner

Subunit & Middle-Down Analysis

For large proteins such as monoclonal antibodies (≥150 kDa), limited proteolysis or selective reduction generates 25–100 kDa subunits amenable to top-down analysis. Bridges intact mass analysis and full sequencing for domain-level characterization.

  • mAb subunits — Fc, Fd, LC analysis with high sequence coverage
  • Limited proteolysis — IdeS, papain, or selective reduction
  • Domain-level PTM mapping — glycosylation and oxidation sites
Large Proteins
terminal

N- & C-Terminal Sequencing

Confirmation of 20 to 80 amino acid residues from both N- and C-termini through gas-phase fragmentation of intact proteins. Particularly valuable when termini are modified — including N-terminal acetylation, pyroglutamate, sequence truncation, or blocked N-termini — where traditional Edman degradation cannot be applied.

Terminal Analysis
find_in_page

MALDI-ISD Sequencing

Matrix-assisted laser desorption/ionization in-source decay (MALDI-ISD) provides rapid N- and C-terminal sequence ladders directly from intact proteins, offering complementary sequence information to ECD/ETD-based top-down approaches. Well-suited for smaller proteins and peptides where terminal sequence confirmation is the primary goal.

Rapid Terminal Readout
account_tree

Native Mass Spectrometry

Analysis of proteins under non-denaturing conditions to preserve non-covalent interactions, quaternary structure, and ligand binding. Native MS combined with top-down fragmentation simultaneously determines complex stoichiometry and identifies proteoforms within assemblies.

  • Complex stoichiometry — determine subunit composition
  • Ligand binding — detect small molecule and cofactor interactions
  • Protein assemblies — analyze multi-subunit complexes intact
Structural Biology

Top-Down Protein Sequencing Workflow

From sample preparation to data delivery, our workflow follows protocols standardized by the Consortium for Top-Down Proteomics.

01

Sample Preparation

Intact proteins are extracted and purified. We apply optimized protocols — dilution, molecular weight cutoff filtration, or protein precipitation — depending on the sample matrix and buffer composition.

02

Intact Protein Separation

Proteins are separated by reversed-phase liquid chromatography using C4, C8, or PLRP-S stationary phases. For complex samples, 2D separation strategies combine SEC or CZE with RPLC.

03

Ionization

Intact proteins are ionized by ESI producing multiply charged ions. MALDI is available for smaller proteins. Native MS uses volatile ammonium acetate buffers to preserve non-covalent interactions.

04

MS & Fragmentation

Intact mass is measured on Orbitrap or FT-ICR instruments. Selected charge states are fragmented using ECD, ETD, HCD, or UVPD for sequence and PTM information.

05

Data Analysis & Report

Spectra are deconvoluted and searched against databases using specialized top-down proteomics software. Results are compiled into a comprehensive report with annotated spectra.

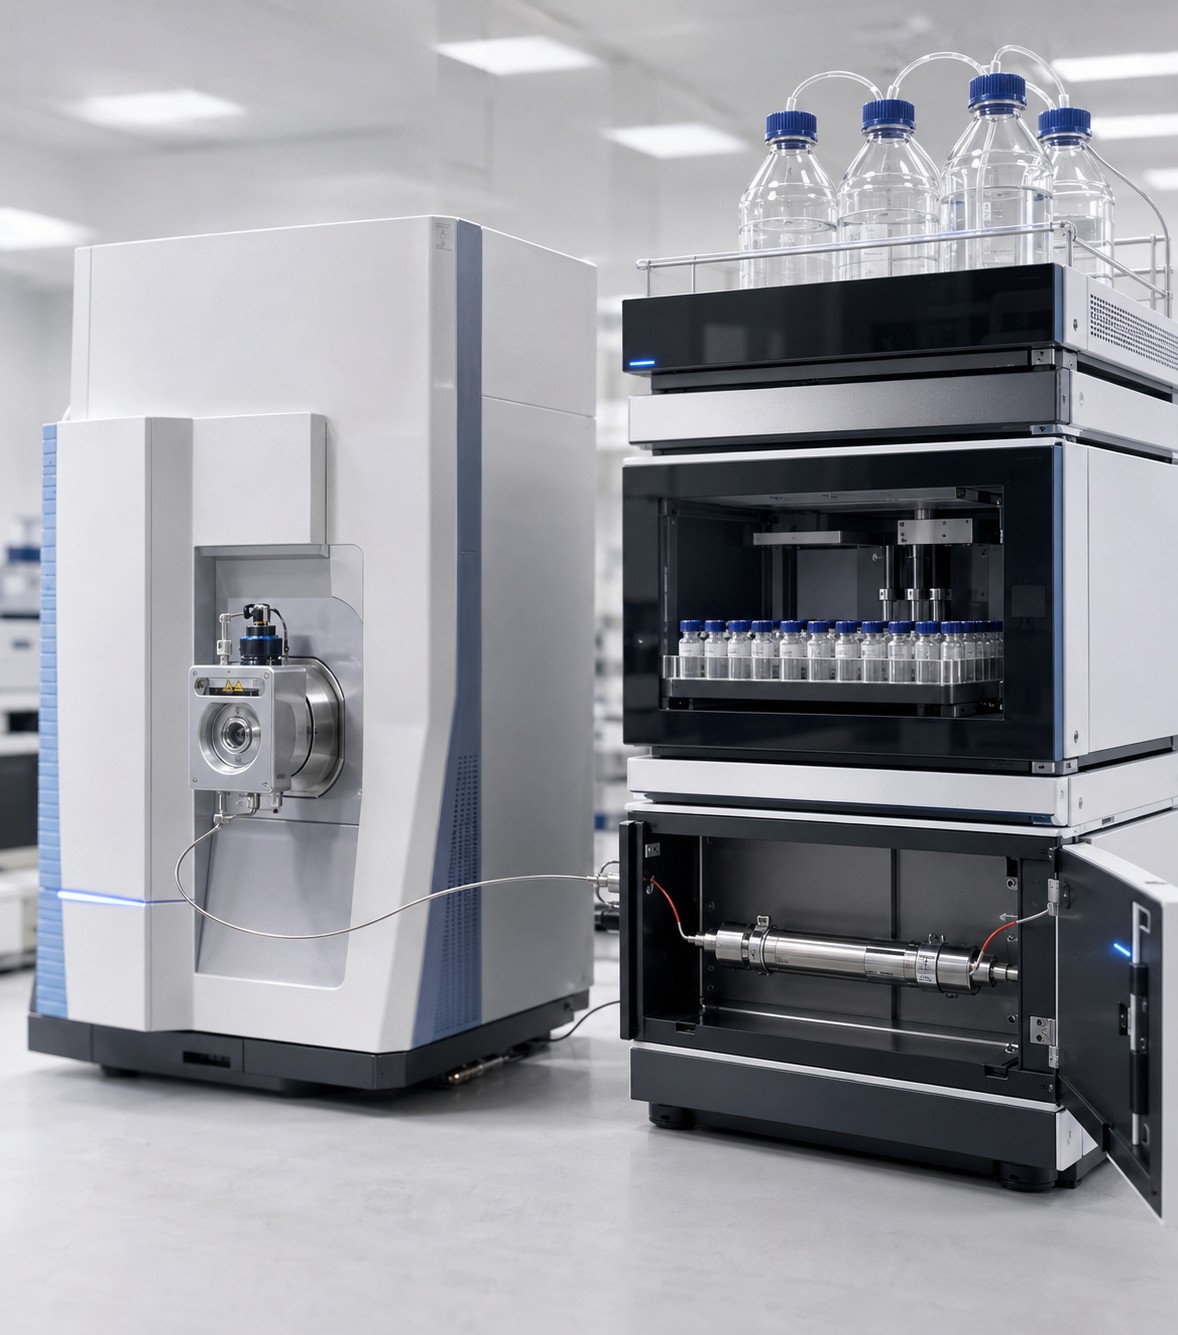
High-resolution Orbitrap mass spectrometer system in a clean analytical laboratory for intact protein and top-down proteomics analysis.

Instrument Platform

Instrument Resolution Mass Accuracy Fragmentation
Orbitrap Fusion Lumos Up to 500,000 ≤3 ppm ECD, ETD, HCD, UVPD
Orbitrap Exploris 480 Up to 480,000 ≤3 ppm HCD, ETD
Q Exactive UHMR Up to 200,000 ≤5 ppm HCD (Native MS)
FT-ICR (12T SolariX) >1,000,000 ≤1 ppm ECD, IRMPD
MALDI-TOF/TOF Up to 40,000 ≤25 ppm CID, ISD

Our multi-platform capability allows us to select the optimal instrument for each protein — from small therapeutic peptides on MALDI-TOF to intact monoclonal antibodies on the Orbitrap Fusion Lumos and multi-subunit protein complexes on the Q Exactive UHMR.

Applications of Top-Down Protein Sequencing

From biotherapeutic characterization to fundamental proteoform discovery, top-down sequencing addresses questions that bottom-up approaches cannot.

medication

Monoclonal Antibody Characterization

Intact mass confirmation, glycoform profiling, N-terminal pyroglutamate, C-terminal lysine truncation, and subunit-level sequencing for biosimilar comparability and drug substance characterization.

hub

PTM Analysis

Site-specific localization of phosphorylation, acetylation, methylation, oxidation, and glycosylation. Combinatorial PTM patterns directly observed on intact proteoforms. See our protein post-translational modification analysis for deeper characterization.

cut

Protein Degradation Analysis

Direct detection of degradation products, enzyme cleavage sites, and processing intermediates. N- and C-terminal truncations are immediately visible in deconvoluted mass spectra without peptide-level inference.

terminal

N- and C-Terminal Sequencing

Confirmation of 20–80 residues from both termini through gas-phase fragmentation. Particularly effective when termini are modified — including N-terminal acetylation, pyroglutamate, sequence truncation, or blocked N-termini — conditions where traditional Edman degradation is not applicable.

compare_arrows

Biosimilar Comparability

Head-to-head intact mass and top-down MS comparison of innovator and biosimilar products. Proteoform-level comparison reveals differences in PTM profiles, terminal processing, and sequence variants.

layers

Membrane Protein Analysis

Integral membrane protein characterization using optimized solubilization and LC-MS protocols. Membrane proteins represent ~60% of drug targets and benefit from top-down approaches that preserve structural context.

For proteins without database entries, top-down fragmentation data provides complementary evidence to de novo protein sequencing approaches, confirming intact mass and validating sequence assignments.

Sample Requirements

Sample quality directly impacts data quality in top-down protein sequencing. We provide pre-analysis consultation to assess buffer compatibility.

Sample Type Minimum Amount Purity Requirement Notes
Purified protein in solution 5–10 μg ≥90% recommended Higher purity yields better intact mass spectra and sequence coverage
Gel bands (SDS-PAGE) Visible band Single band preferred Coomassie-stained; avoid silver stain when possible
Gel spots (2D-PAGE) Visible spot Single spot preferred Compatible with both MALDI and ESI workflows
Lyophilized protein 5–10 μg ≥90% recommended Reconstitute in appropriate buffer prior to submission
Membrane protein preparations 10–20 μg Enriched fraction May require detergent or amphipol solubilization; consult with our team

For samples containing high concentrations of non-volatile salts, detergents, or other MS-incompatible components, we recommend discussing buffer conditions with our team prior to shipment to ensure the most appropriate sample preparation protocol is selected.

Why Choose Our Top-Down Protein Sequencing

difference

Proteoform-Level Resolution

Unlike bottom-up proteomics, which analyzes digested peptides, our top-down approach preserves and resolves the complete set of proteoforms present in your sample. Each sequence variant, splice isoform, and combinatorial PTM pattern is detected and characterized as an intact molecular species, providing a complete portrait of protein complexity that peptide-level analysis cannot deliver.

call_split

Versatile Fragmentation Capabilities

Our platform integrates multiple complementary fragmentation techniques — ECD, ETD, HCD, and UVPD — on high-resolution Orbitrap and FT-ICR instruments. ECD and ETD provide extensive backbone fragmentation ideal for sequence determination and PTM localization, while HCD and UVPD offer complementary cleavage patterns for challenging proteins including membrane proteins.

group

Experienced Scientific Team

Our scientists bring deep expertise in top-down proteomics, intact protein mass spectrometry, and biotherapeutic protein characterization. From experimental design through data interpretation, we collaborate with you to define the analytical strategy that addresses your specific research questions.

description

Comprehensive Data and Reporting

Every analysis delivers instrument-generated raw data alongside interpreted results: deconvoluted intact mass spectra, annotated MS/MS fragmentation maps, proteoform identification tables, and a detailed technical report. For protein full-length sequencing projects requiring complementary bottom-up data, we integrate both approaches into a single cohesive report.

Top-Down Protein Sequencing Deliverables

Every project includes a complete analytical package with instrument-generated raw data and interpreted results suitable for publication or regulatory documentation.

description

Intact Mass Spectrum

Deconvoluted intact mass spectrum with molecular weight determination. Monoisotopic or average mass reported based on protein size and instrument resolution.

analytics

MS/MS Fragmentation Data

Annotated MS/MS spectra with fragment ion assignments. Sequence coverage map showing confirmed residues from N- and C-termini with residue-level annotation.

hub

Proteoform Identification & PTM Report

Proteoform identification and relative quantification table. Post-translational modification annotation with site-specific localization and occupancy estimates.

description

Technical Report

Detailed report summarizing methods, data interpretation, and conclusions. Raw instrument data files in standard format provided alongside the processed results.

integration_instructions

Complementary Service Data

Peptide mapping and bottom-up proteomics results included when combined services are requested, providing multi-level protein characterization from a single sample submission.

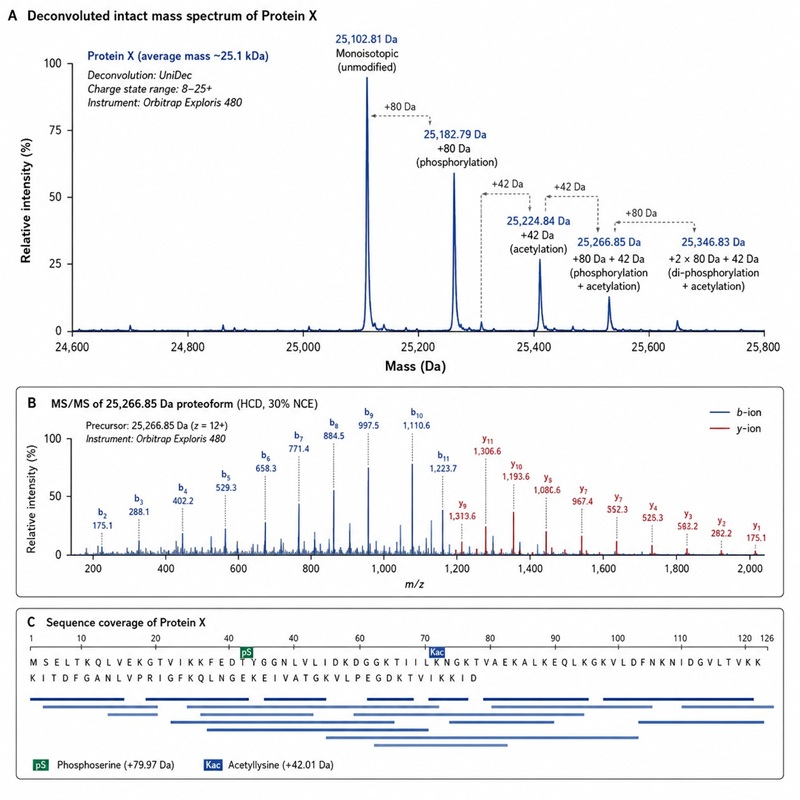
Example top-down mass spectrometry report showing deconvoluted intact protein mass spectrum, proteoform distribution, and MS/MS fragment ion assignment for a characterized protein.

Published Research

Best Practices and Benchmarks for Intact Protein Analysis by Top-Down Mass Spectrometry

Journal

Nature Methods

Year

2019

DOI

10.1038/s41592-019-0457-0

Challenge

Intact protein analysis by mass spectrometry — the foundation of top-down protein sequencing — presents unique challenges compared to peptide-level analysis. Large proteins such as monoclonal antibodies (~150 kDa) require specialized sample preparation to remove MS-incompatible buffer components without denaturing or losing the protein. Prior to this study led by the Consortium for Top-Down Proteomics, there were no standardized protocols or benchmarks for intact protein sample preparation and MS analysis, making it difficult for laboratories and CROs to establish reliable workflows.

Analytical Approach

  • Three sample preparation protocols systematically evaluated across multiple laboratories and instrument platforms.
  • Protocol 1 (Dilution) — tested for high-concentration protein samples with MS-compatible buffers.
  • Protocol 2a (MWCO Filtration) — evaluated for buffer exchange applications requiring salt or detergent removal.
  • Protocol 3 (Protein Precipitation) — assessed for detergent-containing samples such as those extracted with RIPA buffer.
  • Intact protein mass spectra acquired on Orbitrap, FT-ICR, and QTOF instruments across nine laboratories, with standardized protein standards and NISTmAb reference material.

Relevance to Top-Down Protein Sequencing

  • Demonstrates that intact monoclonal antibodies (NISTmAb, 150 kDa) can be characterized at the intact protein level with high mass accuracy.
  • Establishes quantitative benchmarks for buffer compatibility — critical for successful sample preparation in any top-down sequencing project.
  • Validates cross-platform consistency, confirming that results from different instrument types are comparable when standardized protocols are followed.
  • Provides the foundation for the sample preparation protocols used in our top-down protein sequencing services.
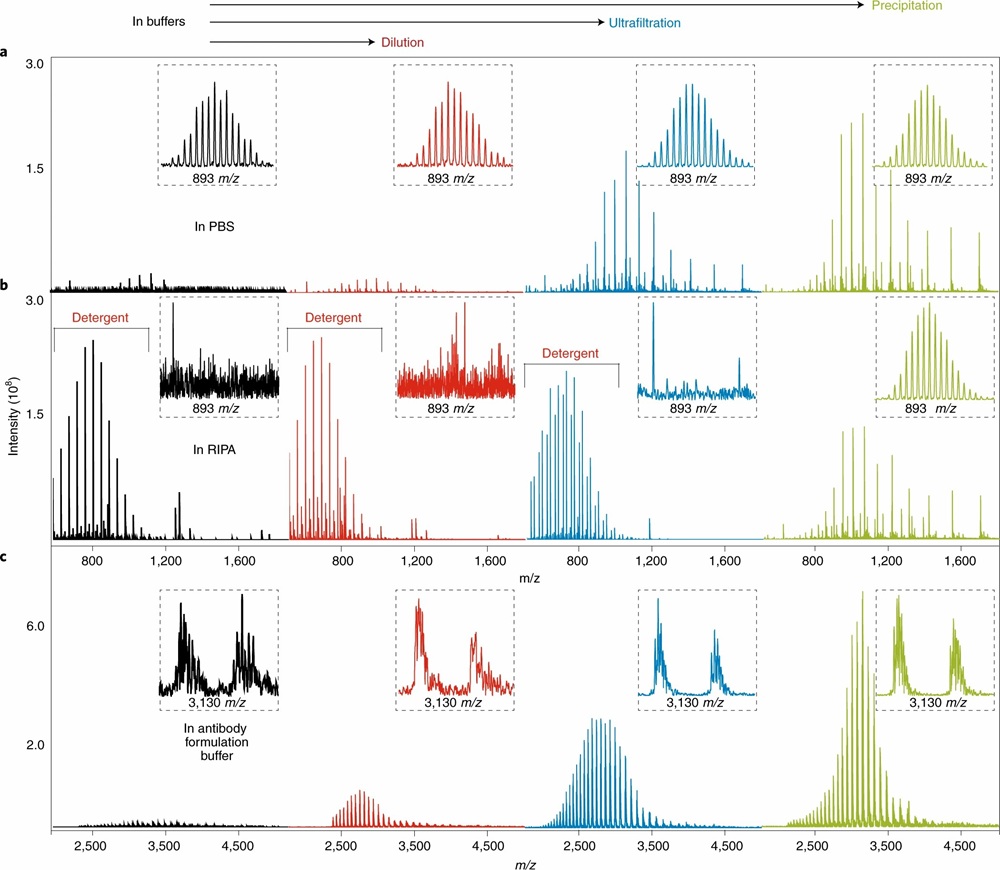
Figure 3 from Donnelly et al. 2019 showing intact mass spectrum of NIST monoclonal antibody reference material acquired by top-down mass spectrometry.

Intact mass analysis of NISTmAb and standard proteins demonstrating the benchmarks and best practices established for top-down mass spectrometry. (Adapted from Donnelly et al., 2019, Nature Methods)

Key Findings

Buffer Inhibition Thresholds

NaCl inhibits ESI-MS signal with SC₅₀ ≈ 1.5 mM; detergents produce the strongest signal suppression; volatile salts (ammonium acetate) are the most MS-compatible

Mass Accuracy Benchmarks

FT-MS instruments achieved ≤10 ppm mass accuracy; QTOF instruments achieved ≤20 ppm for intact protein measurements

Intact Antibody Success

NISTmAb (150 kDa) intact mass successfully measured after optimized sample preparation with clear glycoform resolution

Native vs Denaturing MS

Native MS produced approximately 2× the base peak intensity of denaturing MS for carbonic anhydrase at the same concentration

Publication Reference

Donnelly DP, Rawlins CM, DeHart CJ, et al. Best practices and benchmarks for intact protein analysis for top-down mass spectrometry. Nat Methods. 2019;16(7):587–594. DOI: 10.1038/s41592-019-0457-0.

Frequently Asked Questions

What is the difference between top-down and bottom-up protein sequencing?expand_more
Top-down sequencing analyzes intact proteins directly without enzymatic digestion, preserving proteoform-level information including combinatorial PTM patterns, terminal modifications, and sequence variants. Bottom-up proteomics first digests proteins into peptides using trypsin or other proteases, then identifies proteins by matching peptide MS/MS spectra to databases. While bottom-up approaches provide high-throughput protein identification, the peptide-centric workflow inherently loses information about which modifications co-occur on the same protein molecule, and which peptides originated from the same proteoform. Top-down sequencing resolves this by measuring the intact mass first, then fragmenting the whole protein to localize features — providing a complete picture of protein structure that bottom-up cannot deliver.
What size of proteins can be analyzed by top-down sequencing?expand_more
We routinely analyze proteins ranging from small peptides (~5 kDa) to intact monoclonal antibodies (~150 kDa). Proteins in the 5–30 kDa range typically achieve the highest sequence coverage in top-down MS/MS experiments. For larger proteins (30–150 kDa), we employ subunit approaches (middle-down analysis) using limited proteolysis or selective reduction to generate domains of 25–100 kDa, which are then analyzed individually. Ultra-high molecular weight assemblies up to several megadaltons can be analyzed under native MS conditions, though with lower sequence coverage — here the emphasis is on intact mass, complex stoichiometry, and subunit composition rather than amino acid-level sequencing.
Can top-down sequencing identify post-translational modifications?expand_more
Yes — this is one of the primary strengths of top-down sequencing. Because the intact protein is analyzed before fragmentation, modifications are detected as mass shifts from the expected molecular weight, and their positions are localized through fragment ion analysis. Critically, top-down sequencing reveals the complete modification profile on each individual proteoform — for example, whether phosphorylation at two different sites occurs together on the same molecule or on separate proteoforms — information that is lost when proteins are digested for bottom-up analysis.
How many amino acid residues can be confirmed from the N- and C-terminus?expand_more
In a typical top-down sequencing experiment, 20 to 80 residues can be confirmed from each terminus through gas-phase fragmentation, depending on protein size, amino acid composition, and the fragmentation technique employed. ECD and ETD typically provide the most extensive terminal sequence coverage. For smaller proteins (<30 kDa), near-complete sequence coverage (approaching 100%) is achievable with optimized fragmentation conditions.
What sample amount is required for top-down protein sequencing?expand_more
We require 5–10 μg of purified protein in solution for standard top-down analysis. Gel bands and gel spots from SDS-PAGE or 2D-PAGE are also accepted and processed directly. For membrane proteins, 10–20 μg of enriched membrane fraction is recommended. The most critical factor for successful top-down analysis is sample purity — contaminants, non-volatile salts, and detergents can suppress ionization and reduce data quality. We provide pre-analysis consultation to assess buffer compatibility before you ship samples.
Is top-down sequencing suitable for membrane proteins?expand_more
Yes. Membrane proteins represent a significant portion of drug targets (approximately 60%) and the human proteome (approximately 23%), making their characterization essential for biomedical research. We have developed specialized protocols for membrane protein solubilization, chromatographic separation, and mass spectrometric analysis using both denaturing and native conditions. Membrane proteins including GPCRs, ion channels, and transporters have been successfully characterized by our top-down approaches. For integral membrane proteins, we recommend discussing the specific protein and its buffer conditions with our team during study design.

* This service is provided for research use only. Not for use in diagnostic or therapeutic procedures.

Online Inquiry
Online Inquiry