Biopharmaceutical Characterization

Peptide Mapping Service — Sequence Confirmation & PTM Profiling

LC-MS/MS-based peptide mapping for therapeutic protein characterization — sequence confirmation, PTM profiling, and biosimilar comparability. Multi-protease strategies for ≥99% sequence coverage with ICH Q6B-ready data packages.

Sequence Confirmation PTM Profiling Biosimilar Comparability ICH Q6B Compliance

Service Scope

Complete peptide map analysis from protein digestion to regulatory report

fingerprint

Multi-Protease

Trypsin, Lys-C, Glu-C, Asp-N, Chymotrypsin for ≥99% coverage.

High-Res MS

Orbitrap / Q-TOF with DDA for peptide identification.

ICH Q6B Ready

Data packages structured for regulatory submissions.

Expert Review

Manual data inspection beyond automated software results.

≥99%

Sequence coverage with dual protease strategy.

5+

Protease options for challenging sequences.

<5 ppm

Mass accuracy on high-resolution instruments.

Service Details

Workflow

Platform

Applications

Deliverables

Case Study

What Is Peptide Mapping?

Peptide mapping is an analytical technique widely used in the biopharmaceutical industry throughout the development of therapeutic proteins, primarily for the identification and verification of protein primary structure (amino acid sequence and chemical modifications). For recombinant protein drugs, peptide mapping analysis can be used to identify and characterize primary structures.

In addition, the drug discovery process, various post-translational modifications (PTMs) produced by antibodies, degradation of protein molecules before storage, and contamination of protein samples directly affect the efficacy, stability and safety of drugs. Peptide map analysis serves as an important technique for process monitoring and Quality Assurance/Quality Control (QA/QC) to ensure that there are no undesired changes in the product.

Creative Proteomics has developed a liquid chromatography and tandem mass spectrometry (LC-MS/MS)-based peptide mapping platform for protein primary structure confirmation, combining high-resolution mass spectrometry with multi-protease digestion strategies to maximize sequence coverage.

Split-screen comparison of peptide mapping chromatograms — reference standard vs test sample — showing matched peak patterns for biosimilar identity confirmation.

Why Peptide Mapping for Protein Characterization?

Compared to other protein analytical techniques, peptide mapping provides the highest structural resolution for identity testing, making it the method of choice in ICH Q6B guidelines.

Method What It Measures Structural Resolution Quantitative Key Limitation
Peptide Mapping (LC-MS/MS) Amino acid sequence + PTMs at residue level Highest Semi-quantitative (PTM occupancy) Requires enzymatic digestion; database-dependent
Intact Mass Analysis Whole-protein molecular weight Low No Cannot localize modifications; averages mass shifts
IEX / cIEF Charge heterogeneity Low Yes (profile distribution) Cannot identify the chemical nature of charge variants
ELISA / Western Blot Epitope recognition N/A Yes Antibody-dependent; no structural detail
Edman Degradation N-terminal sequence (first 30–50 residues) Moderate No N-terminus only; blocked N-termini inaccessible

Our Peptide Mapping Services

End-to-end peptide mapping from protein digestion to regulatory-ready data packages. Every analysis combines automated LC-MS/MS acquisition with expert manual data review.

dna

Sequence Confirmation

Confirm the complete amino acid sequence of your therapeutic protein by matching experimentally observed peptide masses to the theoretical sequence. Multi-protease strategies achieve ≥99% sequence coverage.

  • Full sequence coverage — targeted with dual/multi-protease digestion
  • Residue-level verification — each amino acid confirmed by at least one unique peptide
  • N- and C-terminal confirmation — verify terminal integrity
Trypsin Lys-C
biotech

PTM Profiling

Identify and quantify post-translational modifications including deamidation, oxidation, glycosylation, and isomerization. Track modification levels across batches for stability assessment.

  • Deamidation — Asn→Asp/IsoAsp, key CQA for mAbs
  • Oxidation — Met, Trp, His residues
  • N-Glycosylation — glycoform profiling at conserved sites
  • Asp isomerization — Asp→IsoAsp, CDR stability indicator
PTM Focus
compare_arrows

Biosimilar Comparability

Head-to-head peptide mapping of innovator and biosimilar products. Detect sequence variations, PTM pattern differences, and any structural discrepancies between products.

  • Side-by-side comparison — reference vs test sample in the same LC-MS run
  • PTM pattern alignment — deamidation, oxidation levels compared
  • Sequence variant detection — single amino acid substitutions identified
Comparability
verified

Multi-Attribute Method (MAM)

A single peptide mapping run that monitors multiple critical quality attributes simultaneously — replacing multiple orthogonal assays for QC lot release and stability testing.

  • Single-run QC — identity, purity, PTMs in one analysis
  • New Peak Detection — flag unexpected modifications between batches
  • ICH Q6B alignment — data packages structured for regulatory review
Advanced QC
link

Disulfide Bond Mapping

Determine the complete disulfide bond connectivity of therapeutic proteins. Non-reduced enzymatic digestion followed by LC-MS/MS identifies each disulfide-linked peptide pair.

  • Complete connectivity — map all disulfide bond pairings
  • Free thiol detection — quantify unpaired cysteine residues
  • Disulfide scrambling — detect mispaired bonds under stress
Structure

Protease Selection for Optimal Coverage

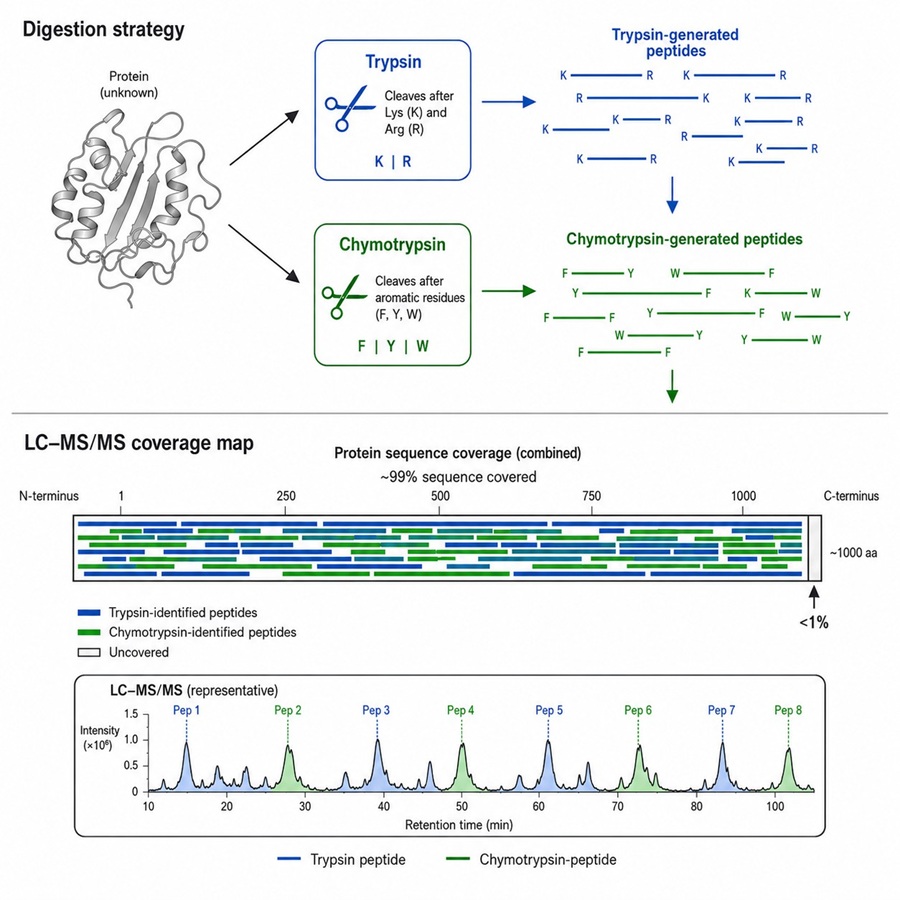
Trypsin alone typically yields 85–95% sequence coverage. Strategic pairing with a complementary protease pushes coverage above 99% — critical for high-coverage peptide mapping.

Protease Cleavage Site Typical Peptide Length Best Paired With Use Case
Trypsin C-terminal to Arg, Lys 8–25 residues Chymotrypsin or Tryp-N Standard first choice; mAb heavy/light chains
Chymotrypsin C-terminal to Phe, Tyr, Trp, Leu 3–15 residues Trypsin Fills Arg/Lys-poor gaps; short peptides for coverage
Lys-C C-terminal to Lys only 10–30 residues Trypsin Larger peptides; denaturing conditions tolerated
Glu-C C-terminal to Glu (Asp at low pH) 8–25 residues Trypsin Complementary to trypsin; acidic region coverage
Asp-N N-terminal to Asp (occasionally Cys) 8–25 residues Trypsin + Glu-C Asp-rich regions; disulfide bond characterization

How Peptide Mapping Works

A systematic process from sequence-based planning to expert-reviewed data delivery.

01

Sequence Analysis & Enzyme Selection

Computational prediction of digestion patterns for each candidate protease. Enzyme combinations are selected to maximize coverage, particularly for CDR regions in antibodies and hydrophobic stretches in membrane proteins.

02

Protein Digestion

Reduction and alkylation of disulfide bonds followed by protease digestion — single-enzyme for routine work or dual-protease for high-coverage requirements. Optimized sample-to-enzyme ratios for consistent results.

03

LC-MS/MS Acquisition

Peptides are separated on a UPLC C18 column (sub-2 µm) and analyzed by high-resolution mass spectrometry using data-dependent acquisition (DDA) — each survey scan triggers MS/MS of the most abundant precursors.

04

Bioinformatics Analysis

MS/MS spectra are searched against the protein sequence database. Peptide-spectrum matches are scored and filtered. Sequence coverage and PTM positions are mapped onto the theoretical protein sequence.

05

Expert Data Review

Manual inspection of every peptide-spectrum match. False positives flagged by automated software are reviewed and corrected. Only validated identifications are included in the final report.

Coverage Comparison: Single vs. Dual Protease Strategy

Trypsin Only

85–95%

Typical coverage for standard mAbs. Missing regions usually occur in Arg/Lys-poor CDR loops or hydrophobic transmembrane domains.

Trypsin + Chymotrypsin

≥99%

Complementary cleavage fills coverage gaps. Short chymotryptic peptides confirm residues missed by trypsin — critical for regulatory submissions.

Analytical Instrumentation & Data Quality

Instrument Type Mass Accuracy Resolution Acquisition Mode
Orbitrap Fusion Lumos Orbitrap <3 ppm (external) Up to 500,000 DDA, Targeted-MS²
Q-Exactive HF-X Quadrupole-Orbitrap <3 ppm (external) Up to 240,000 DDA, PRM, DIA
Vanquish UPLC UHPLC N/A N/A Sub-2 µm C18, 30–90 min gradient

LC-MS/MS data are analyzed using industry-standard bioinformatics platforms with manual expert review. Automated software results are verified by an experienced mass spectrometrist — a critical quality step that catches false-positive assignments not flagged by computational scoring. This combined pipeline ensures that peptide identifications, sequence coverage calculations, and PTM assignments in your final report meet the evidentiary standards expected for regulatory submissions.

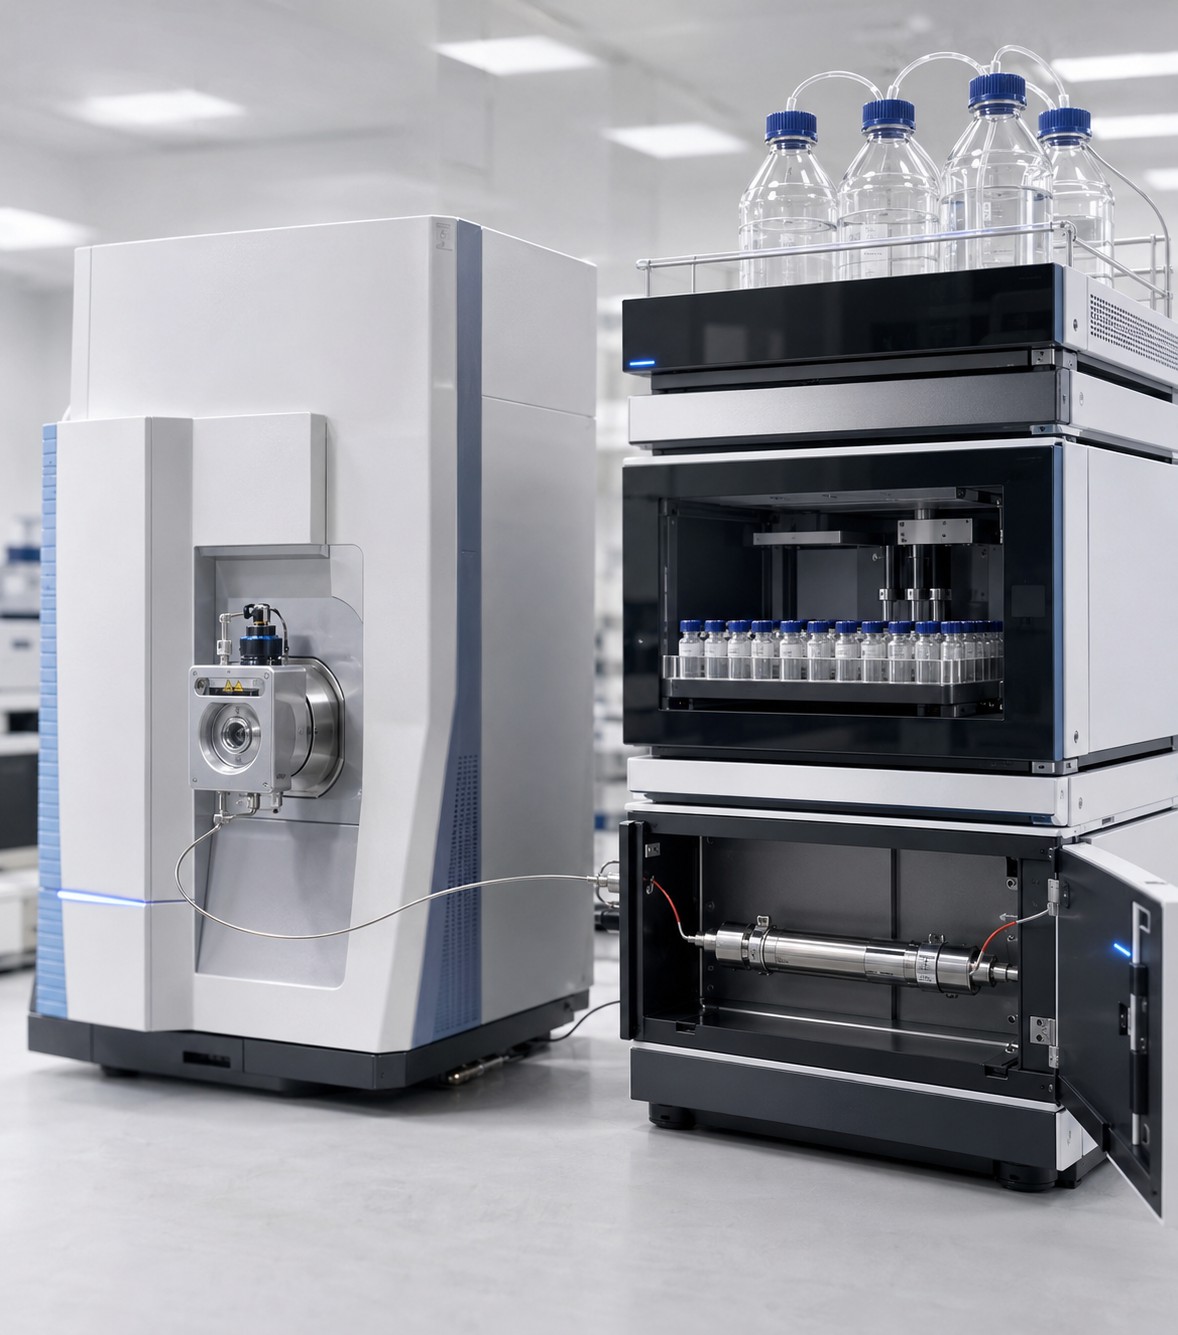
Close-up of UHPLC and Orbitrap mass spectrometer instrumentation used for high-resolution peptide mapping analysis.

Applications of Peptide Mapping

inventory_2

Lot Release & Identity Testing

Peptide mapping serves as the primary identity test for biopharmaceutical lot release under ICH Q6B. Each production batch is compared against a reference standard peptide map to confirm structural consistency before release.

  • Confirm complete expression of recombinant protein
  • Verify N- and C-terminal integrity
  • Detect unexpected sequence variants or truncations
monitoring

Stability & Degradation Studies

Track chemical degradation of therapeutic proteins under storage, stress, or forced-degradation conditions. PTM-specific peptide mapping quantifies modification levels over time.

  • Deamidation kinetics at individual Asn residues
  • Methionine oxidation under oxidative stress
  • Asp isomerization in CDR regions (potency impact)
balance

Biosimilar Analytical Similarity

Regulatory guidelines require extensive analytical comparison between innovator and biosimilar. Peptide mapping provides residue-level structural evidence for similarity assessment.

  • Head-to-head sequence verification
  • Comparative PTM profiling
  • Disulfide bond pattern confirmation
sync_alt

Process Change Comparability

When manufacturing processes are modified — cell line changes, scale-up, purification optimization — peptide mapping demonstrates that the product remains structurally unchanged.

  • Pre- vs post-change peptide map overlay
  • Quantitative PTM comparison across process versions
  • New peak investigation for any process-related variants

Why Our Peptide Mapping Service

psychology

Expert Data Review

Automated search engines flag peptide-spectrum matches, but commercial software is not infallible. Our mass spectrometrists manually inspect each assignment — catching false positives that would otherwise appear in your report. This is the quality difference between a software-generated output and a scientist-validated result.

auto_awesome

Adaptive Protease Strategy

We do not default to trypsin-only digestion. Each project begins with an in silico analysis of your protein sequence, followed by selection of the optimal protease or protease pair — ensuring coverage that meets regulatory expectations out of the box.

description

ICH Q6B-Ready Reporting

Deliverables are structured for direct inclusion in regulatory filings. Sequence coverage maps, peptide identification tables, annotated MS/MS spectra, and PTM quantification summaries — organized to answer the questions reviewers will ask.

Sample Requirements

Protein Amount

  • Standard analysis: 100–500 µg per sample
  • Multi-protease package: 200 µg per protease
  • MAM for lot release: 100 µg per sample (routine)

Sample Conditions

  • Concentration: ≥0.5 mg/mL recommended
  • Buffer: PBS, Tris, or similar; avoid amine-containing buffers (Tris >50 mM interferes with labeling)
  • Shipping: Cold packs or dry ice; lyophilized samples stable at ambient

What You Receive

bar_chart

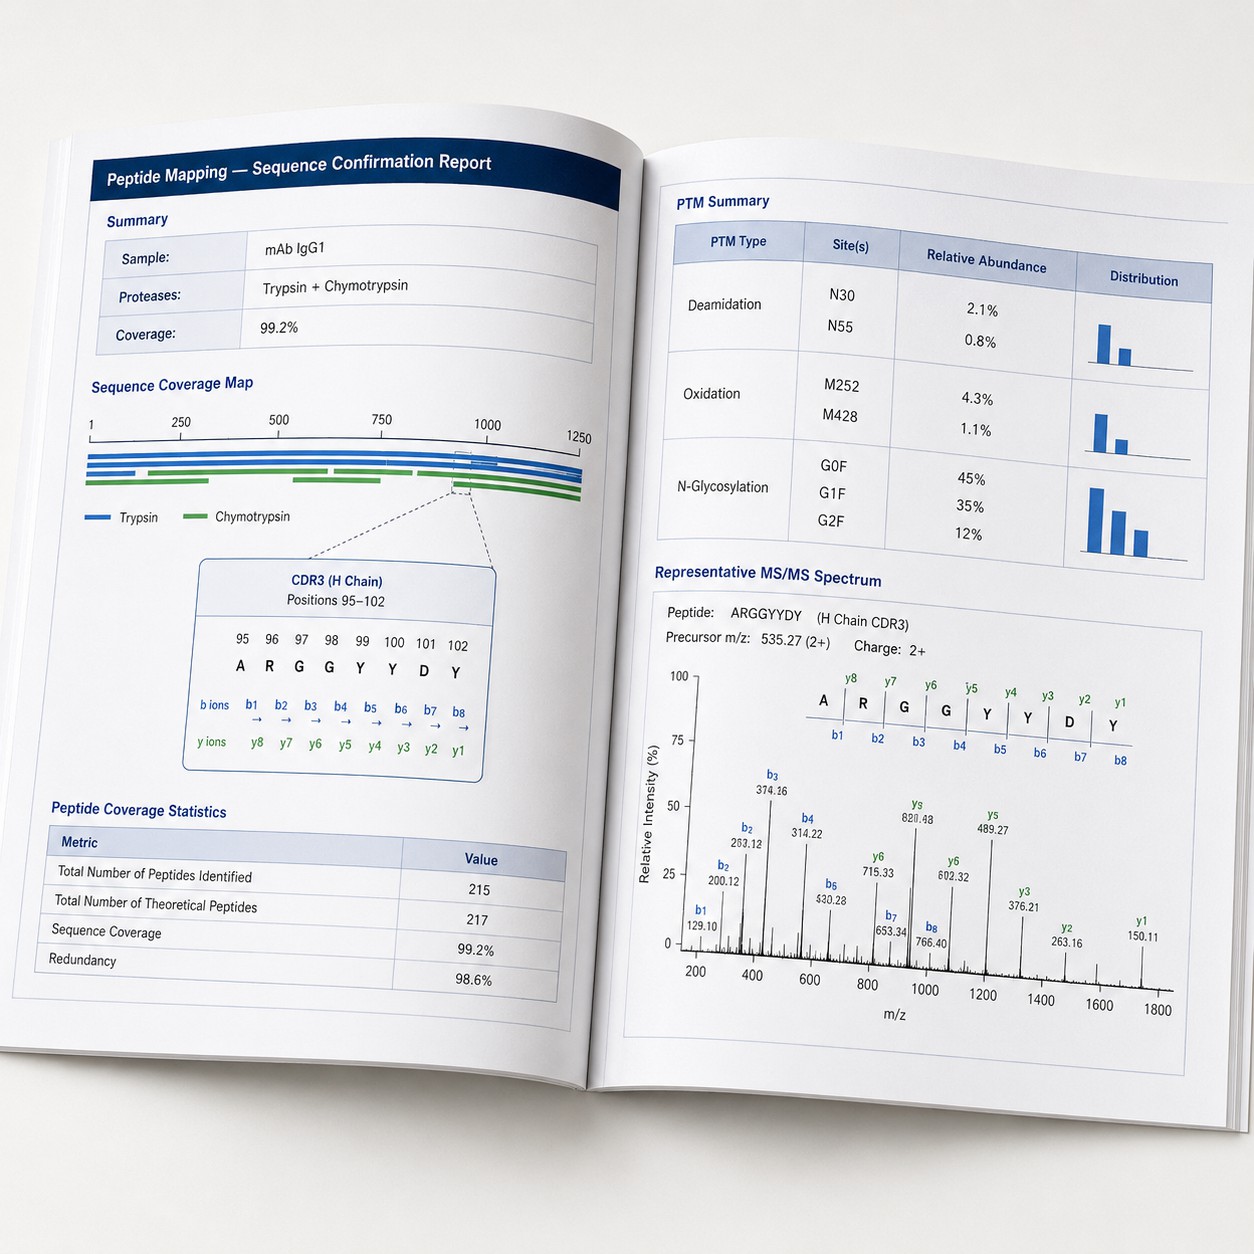
Sequence Coverage Map

Color-coded coverage map showing every confirmed residue. Peptides from each protease are overlaid on the theoretical sequence. Unexplained gaps are documented and addressed.

table_chart

Peptide Identification Tables

Complete list of identified peptides with observed m/z, charge state, mass error (ppm), retention time, and sequence. Linked to annotated MS/MS spectra for each identification.

donut_small

PTM Quantification

Relative quantification of each detected modification. Deamidation %, oxidation %, and glycosylation profiles reported alongside MS/MS evidence for each PTM site assignment.

All deliverables include raw LC-MS/MS data files (.RAW), processed search results, and an executive summary. For additional protein characterization services — including peptide testing for synthetic peptides and purity analysis — contact our team to discuss your project requirements.

Open peptide mapping report booklet showing sequence coverage map, PTM quantification table, and annotated MS/MS spectra — ICH Q6B-ready deliverables.

Published Research

Peptide Mapping for Sequence Confirmation of Therapeutic Proteins: Software Performance and Expert Review

Journal

Int J Mol Sci

Year

2025

DOI

10.3390/ijms26209962

Study Overview

Dobrowolski et al. (International Journal of Molecular Sciences, 2025) performed peptide mapping on three therapeutic proteins — denosumab, cetuximab, and SARS-CoV-2 variant sequences — to evaluate the performance of commercial peptide mapping software (BioPharma Finder 5.1) for sequence confirmation. The study revealed that while automated software provides rapid initial assignment, it generates a non-trivial number of false-positive sequence variants that can mislead characterization if not manually reviewed.

Key Methods

  • Proteins analyzed: Denosumab (IgG2), Cetuximab (IgG1), SARS-CoV-2 Spike variant sequences
  • Digestion: Trypsin + complementary protease for high sequence coverage
  • LC-MS/MS: High-resolution mass spectrometry with data-dependent acquisition
  • Data analysis: BioPharma Finder 5.1 auto-search + manual expert review of all variant calls

Relevance to Peptide Mapping Services

  • Directly validates the necessity of expert data review alongside automated software analysis in a peptide mapping workflow.
  • Demonstrates how real therapeutic protein peptide maps are used for sequence confirmation in a regulatory context.
  • Shows that even mature commercial software (BioPharma Finder 5.1) requires human oversight for reliable sequence variant detection.

Key Finding

Automated peptide mapping software generated false-positive sequence variant calls across all three proteins tested. Manual expert review identified and removed these artifacts — confirming that software-only peptide mapping workflows are insufficient for regulated characterization. The study underscores a critical quality differentiator in peptide mapping services: the presence of an experienced mass spectrometrist who reviews every spectrum, not just software output.

Publication Reference

Dobrowolski K, Gerber SA, Keating AE. Peptide Mapping for Sequence Confirmation of Therapeutic Proteins: The Role of Manual Expert Review in Automated Workflows. Int J Mol Sci. 2025;26(20):9962. DOI: 10.3390/ijms26209962.

Frequently Asked Questions

What level of sequence coverage can I expect from peptide mapping?expand_more
A single protease (trypsin) typically achieves 85–95% sequence coverage for standard monoclonal antibodies. Adding a complementary protease such as chymotrypsin or Lys-C pushes coverage above 99%. Gaps in coverage usually occur in Arg/Lys-poor regions (some CDR loops) or in peptides too short (<4 residues) or too large (>30 residues) for confident MS detection. We provide a color-coded coverage map that transparently shows which residues were confirmed and which, if any, remain unassigned.
What is the difference between peptide mapping and de novo sequencing?expand_more
Peptide mapping compares experimentally observed peptide masses to a known reference sequence — it confirms that your protein matches what you expect it to be. De novo sequencing determines the amino acid sequence without any prior sequence knowledge, constructing the sequence directly from MS/MS fragmentation spectra. Peptide mapping is faster, higher-throughput, and the standard for batch release testing. De novo sequencing is used when the sequence is unknown — for novel proteins, antibody variable regions, or when unexpected variants are detected by peptide mapping.
Can peptide mapping detect all types of post-translational modifications?expand_more
Peptide mapping with LC-MS/MS detects mass-shifting modifications — deamidation (+1 Da), oxidation (+16 Da), glycosylation (variable mass shift), and others. It cannot detect modifications that do not change mass (e.g., racemization of single amino acids without chiral chromatography) or modifications on peptides that fall outside the detectable mass range. For a comprehensive view, peptide mapping is often paired with intact mass analysis to capture the global modification profile and ion-exchange chromatography to assess charge heterogeneity.
What makes a peptide mapping data package ICH Q6B-ready?expand_more
An ICH Q6B-ready peptide mapping package includes: (1) a sequence coverage map showing every confirmed residue and documented gaps; (2) peptide identification tables with mass error, retention time, and spectral evidence for each peptide; (3) annotated MS/MS spectra supporting each identification; (4) PTM quantification data with site localization; and (5) a methods section describing digestion conditions, LC gradient, MS acquisition parameters, and data analysis workflow in sufficient detail for regulatory review.
Can you perform peptide mapping on samples with unknown sequences?expand_more
Peptide mapping requires a reference sequence for database matching. If your protein sequence is unknown, we recommend de novo sequencing to determine the sequence first, followed by peptide mapping for routine confirmation. However, if you know the sequence of a closely related protein (e.g., the same antibody from a different species), we can use it as a homology template to guide the analysis.
How long does a standard peptide mapping project take?expand_more
A standard single-protease peptide mapping project is typically completed within 2–3 weeks from sample receipt. Multi-protease projects or MAM method development may require additional time for protease optimization. For urgent projects, please contact us — we can often accommodate accelerated timelines.
Online Inquiry
Online Inquiry