Amide I FTIR Protein Analysis Service
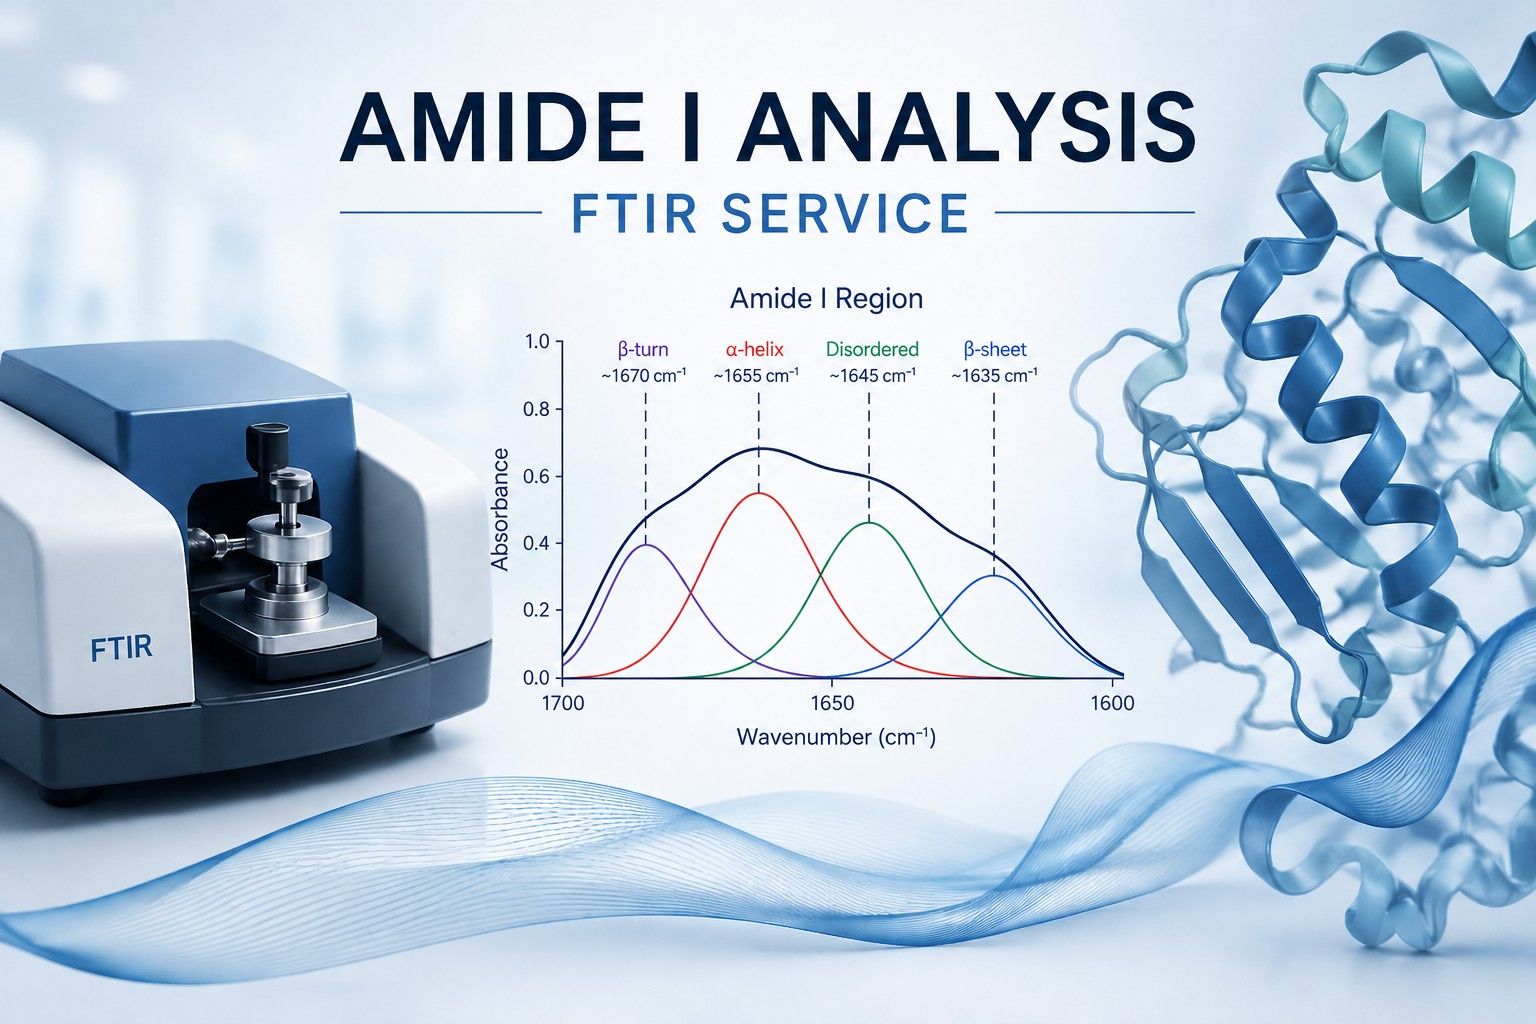
Protein secondary structure can shift during formulation, concentration, freeze-drying, storage, or thermal stress—sometimes before visible particles or loss of activity become apparent. Our Amide I FTIR analysis service characterizes α-helical, β-sheet, turn, and disordered contributions; detects aggregation-associated intermolecular β-sheet formation; and compares structural fingerprints across formulations, lots, or stress conditions. Modality- and sample-state-specific acquisition, solvent/background control, and transparent spectral processing provide interpretable evidence for research-stage biologic and peptide development.
Discuss Your ProjectIn line with ICH Q6B Guidance for biologic characterization
Jump to Section
- Why it matters
- Service Capabilities
- Sample states
- Analytical approaches
- Advantages
- Instrument Platform
- Workflow
- Report Deliverables
- Sample requirements
- FAQs
Why Amide I Analysis Matters in Biologic Development
The Amide I envelope, typically evaluated across approximately 1700–1600 cm⁻¹, is dominated by peptide-backbone C=O stretching. Its component bands respond to backbone conformation and hydrogen bonding, making the region useful for comparing protein secondary structure and detecting conformational change. Because the bands overlap, reliable interpretation depends on matched backgrounds, appropriate preprocessing, resolution enhancement, and project-specific assignment rather than a universal peak list.
For formulation and analytical-development teams, the practical questions are threefold:
- Higher-order-structure comparability: Does a formulation, lot, process change, or biosimilar candidate retain a comparable Amide I fingerprint and secondary-structure profile?
- Stress and stability sensitivity: Does heat, agitation, freeze–thaw, drying, or storage produce unfolding or a shift toward aggregation-associated intermolecular β-sheet structure?
- Sample-state relevance: Can the protein be characterized in a concentrated, opaque, gelled, or lyophilized state where conventional optical techniques may be constrained?
ICH Q6B recognizes spectroscopic profiling as part of physicochemical characterization and emphasizes product-specific, orthogonal analytical strategies. Amide I FTIR is therefore best used as one component of a higher-order-structure and stability-indicating characterization package—not as a standalone measure of potency, particle count, or clinical comparability.
Assignment principle. Band positions can vary with sequence, hydration, hydrogen bonding, sample state, temperature, isotope exchange, and processing choices. Secondary-structure estimates are model-dependent and should be interpreted with residuals, replicates, sensitivity checks, and orthogonal evidence.
Amide I FTIR Analysis Service Capabilities
Our platform supports projects ranging from rapid structural fingerprint comparison to quantitative band-area analysis and aggregation-focused stress studies.
Secondary-Structure Profiling
Resolve and estimate relative contributions from α-helix, β-sheet, turns, and disordered/irregular structure using derivative analysis, Fourier self-deconvolution, and justified curve-fitting models.
Aggregation-Sensitive β-Sheet Analysis
Track low-wavenumber Amide I components associated with strengthened intermolecular β-sheet interactions and compare them with native-state fingerprints.
Solid-State & Lyophilized Analysis
Assess powders, films, and dried formulations directly by ATR-FTIR, avoiding reconstitution when the solid-state structure itself is the attribute of interest.
Formulation & Stress Comparability
Compare control and test conditions after heat, agitation, freeze–thaw, pH, excipient, concentration, or storage challenges using aligned spectral metrics.
High-Concentration Biologic Analysis
Select ATR or short-pathlength transmission configurations to reduce pathlength and water-interference constraints in concentrated formulations.
Orthogonal HOS Study Support
Integrate FTIR findings with CD, DSC, DLS, SEC, or other methods when the study requires complementary evidence on folding, thermal stability, particles, or soluble aggregates.
Amide I FTIR Analysis Across Sample States
Acquisition mode and preprocessing are selected according to the physical state and formulation matrix of the submitted material.
- Aqueous Protein Solutions
Use short-pathlength transmission or an appropriate ATR configuration with an exact formulation blank to manage strong water absorption near the Amide I region. - Concentrated and Viscous Liquids
Apply short effective pathlengths and controlled sample contact to characterize high-concentration formulations that may challenge conventional optical techniques. - Lyophilized Powders
Analyze the dried formulation directly by ATR-FTIR when reconstitution could obscure the solid-state structural attribute under investigation. - Films and Gels
Evaluate thin films, gelled preparations, and other semi-solid formats with state-appropriate contact, background, and replicate controls. - Aggregated or Stressed Material
Compare native and stressed samples for fingerprint changes and enhanced intermolecular β-sheet contributions associated with structural aggregation. - Peptides and Engineered Proteins
Tailor the fitting model and assignment boundaries to the expected conformation, sample state, and limitations of the available reference information.
Analytical Approaches for Amide I FTIR Analysis
The approach is selected according to sample state, solvent interference, required output, and whether the objective is fingerprint comparison or relative structural estimation.
| Configuration | Best suited for | Key considerations and outputs |
| ATR-FTIR | Lyophilized powders, films, gels, and viscous or concentrated liquids | Minimal preparation and direct-state analysis; consistent crystal contact, cleaning, pressure, and replicate handling are essential. |
| Short-pathlength transmission | Aqueous protein solutions and comparative liquid studies | Requires matched windows, controlled pathlength, and an exact formulation blank; supports consistent liquid-to-liquid comparison. |
| Temperature-controlled analysis | Thermal transition or stress studies | Temperature equilibration, replicate design, pathlength stability, and condensation control are predefined in the study plan. |
| Resolution-enhanced band analysis | Secondary-structure estimation and aggregation-focused comparison | Second derivatives and/or Fourier self-deconvolution guide component placement; curve fitting is used only with justified constraints and residual review. |
Service Advantages
- State-Independent Measurement
FTIR can analyze transparent or opaque solutions, powders, films, gels, and aggregated materials, allowing the physical state of interest to be studied directly.
- Aggregation-Sensitive Structural Readout
Low-wavenumber Amide I changes can reveal intermolecular β-sheet formation, providing structural information complementary to particle-size or chromatographic measurements.
- High-Concentration Compatibility
ATR and short-pathlength approaches help accommodate concentrated formulations that can challenge conventional optical measurements.
- Controlled Spectral Processing
Matched backgrounds, replicate acquisition, documented preprocessing, residual review, and sensitivity checks reduce overinterpretation of deconvolution results.
- Flexible Study Design
Compare formulations, lots, stress conditions, sample states, or storage time points within a project-specific acquisition and analysis plan.
- Scientist-Reviewed Interpretation
Receive transparent processing parameters, study limitations, and recommendations for orthogonal follow-up when FTIR alone cannot resolve the research question.
Instrument Platform for Amide I FTIR Analysis
Analysis is performed using a research-grade Bruker INVENIO® FTIR platform configured for protein secondary-structure characterization. Accessory and detector selection are matched to sample state, volume, concentration, solvent matrix, and sensitivity requirements.
ATR accessories support powders, films, gels, and concentrated materials, while controlled short-pathlength transmission can be used for aqueous comparative studies. Replicate acquisition, matched backgrounds, atmospheric compensation where appropriate, and documented resolution and scan settings support traceable comparison.
Amide I FTIR Analysis Workflow
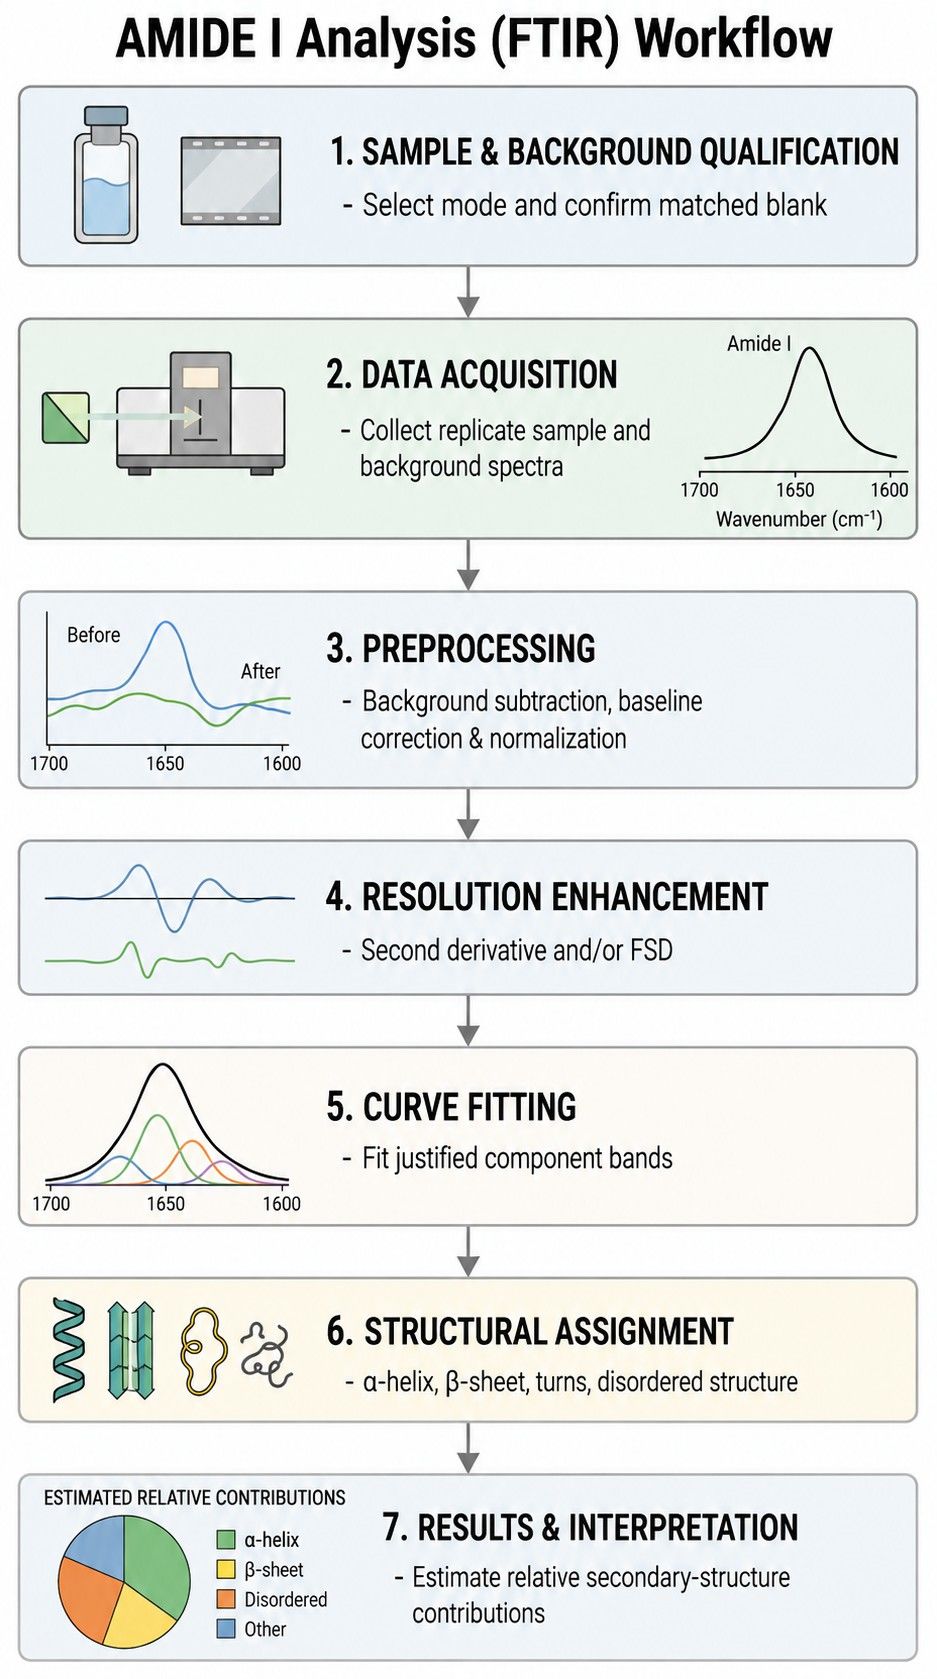
- 1
Sample & Background Qualification
Review the sample concentration, volume, formulation, physical state, and potentially interfering excipients. Confirm an exact matched formulation blank for aqueous samples and select an appropriate ATR or short-pathlength transmission configuration.
- 2
FTIR Data Acquisition
Collect replicate sample and background spectra using predefined resolution, scan number, ATR contact or transmission pathlength, temperature, and measurement sequence.
- 3
Spectral Preprocessing
Apply the same predefined preprocessing sequence across all comparison groups, including background subtraction, atmospheric compensation where appropriate, baseline correction, normalization, and spectral quality checks.
- 4
Resolution Enhancement
Use second derivatives and/or Fourier self-deconvolution to reveal overlapping Amide I components and guide the selection of candidate band positions. These procedures support component identification but do not independently provide quantitative secondary-structure content.
- 5
Curve Fitting
When relative band-area estimation is required, fit component bands using justified line shapes, starting positions, boundaries, and constraints. Evaluate fit residuals, replicate consistency, and sensitivity to modeling choices to reduce overinterpretation.
- 6
Structural Assignment
Assign spectral components cautiously to α-helical, β-sheet, turn, and disordered/irregular contributions using protein-, formulation-, and sample-state-specific evidence rather than a universal peak list.
- 7
Results & Interpretation
Compare Amide I fingerprints, peak positions, relative band areas, and other predefined metrics across formulations, lots, stress conditions, or time points. Evaluate replicate variability, model limitations, and meaningful condition-dependent changes.
Report Deliverables
The final report is tailored to the agreed study objective and typically includes:
- Sample and method summary: sample state, concentration, formulation, acquisition mode, pathlength or ATR conditions, resolution, scan count, and temperature.
- Raw and preprocessed spectra: background-subtracted Amide I spectra with the documented preprocessing sequence.
- Resolution-enhanced analysis: second-derivative and/or Fourier self-deconvolution plots used to guide component assignment.
- Band-fitting results: fitted components, band positions, relative areas, model constraints, residuals, and fit-quality observations when quantitative modeling is included.
- Data package: agreed raw files, processed datasets, tables, and publication-ready figures.
Frequently Asked Questions About Amide I FTIR Analysis
Why must I provide an exact buffer blank for liquid samples?
Water has a strong infrared absorption band near 1640 cm⁻¹ that overlaps the protein Amide I region. Accurate comparison therefore requires a precisely matched formulation blank, collected under the same optical conditions, for background subtraction.
Can you analyze my lyophilized powder directly?
Yes. ATR-FTIR can analyze a lyophilized powder directly on the ATR crystal, allowing the solid-state structure to be studied without reconstitution when sufficient material and consistent crystal contact are available.
Can FTIR distinguish between native β-sheets and aggregated β-sheets?
FTIR can often detect new or enhanced Amide I components consistent with aggregation-associated intermolecular β-sheet formation. Because these bands may overlap with native β-sheet contributions, interpretation should remain protein- and condition-dependent and be supported by controls and orthogonal methods.
What is D₂O exchange, and is it always required?
D₂O shifts the dominant solvent bending absorption away from the conventional H₂O Amide I overlap and can improve access to protein bands. It is not always required; the decision depends on acquisition mode, formulation, protein concentration, and study objective.
Sample Requirements for Amide I FTIR Analysis
Final requirements are confirmed after review of protein concentration, formulation, sample state, acquisition mode, and analytical objective. The values below are planning guidelines.
| Parameter | General guideline | Additional notes |
| Accepted sample types | Purified protein or peptide as liquid, lyophilized powder, film, or gel | Provide the complete formulation, expected structure, storage history, and comparison design. |
| ATR solid samples | Approximately 1–2 mg powder | Actual need depends on crystal area, contact, material density, and replicate plan. |
| ATR liquid samples | Typically at least 50 mg/mL and at least 20 µL | Lower concentrations may be feasible in selected configurations; confirm before shipment. |
| Transmission liquid samples | Typically 1–10 mg/mL and at least 50 µL | Pathlength and total quantity are matched to absorbance and study design. |
| Buffer blank | An exact matched blank is required for aqueous samples | Use the same formulation lot or matched dialysate or flow-through whenever possible. |
| Components to review | High urea and concentrated citrate, acetate, or other strongly absorbing components | Tris may be acceptable at moderate concentration when precisely matched in the blank. |
Before shipping samples, please contact our technical team for a tailored submission plan. We will confirm the acquisition mode, minimum quantity, controls, buffer blank, and condition matrix for your project.
References
- Byler DM, Susi H. Examination of the secondary structure of proteins by deconvolved FTIR spectra. Biopolymers. 1986;25:469–487. doi:10.1002/bip.360250307.
- Dong A, Huang P, Caughey WS. Protein secondary structures in water from second-derivative Amide I infrared spectra. Biochemistry. 1990;29:3303–3308. doi:10.1021/bi00465a022.