Introduction to Circular Dichroism: A Tool for Protein Structural Insights
Proteins are naturally chiral molecules—built from asymmetrical subunits that twist light in unique ways. This chiral nature makes them excellent candidates for circular dichroism (CD) analysis, a technique that leverages the behavior of circularly polarized light to probe protein structures.
When circularly polarized light in the far-UV (170–240 nm) and near-UV (260–300 nm) ranges interacts with peptide bonds and aromatic amino acids, it triggers electronic transitions in the protein backbone. These transitions generate distinct optical signals due to the differential absorption of left- and right-handed polarized light—a phenomenon known as circular dichroism.
In CD analysis, the key measurement is the difference in absorption between the two light forms (Δε = εL - εR). This differential is plotted against wavelength to produce a CD spectrum, which reveals valuable structural information.
Why Circular Dichroism Matters in Structural Biology
CD spectroscopy serves two major functions in protein research:
- Secondary Structure Analysis (Far-UV)
The far-UV region detects transitions in peptide bonds, allowing for the quantification of common secondary structures like alpha-helices and beta-sheets. - Tertiary Structure Monitoring (Near-UV)
Peaks in the near-UV spectrum reflect the local environments of aromatic residues—tryptophan, tyrosine, and phenylalanine—making it possible to study folding dynamics and higher-order structure.
These sensitive spectral shifts can detect even minor conformational changes in proteins. That makes CD ideal for assessing:
- Environmental influences (pH, temperature, ionic strength) on protein structure
- Mutation-induced folding changes
- Interaction mechanisms between proteins and small molecules
With its rapid detection capabilities and minimal sample requirements, CD has become a cornerstone method for real-time protein analysis in drug discovery and structural biology workflows.
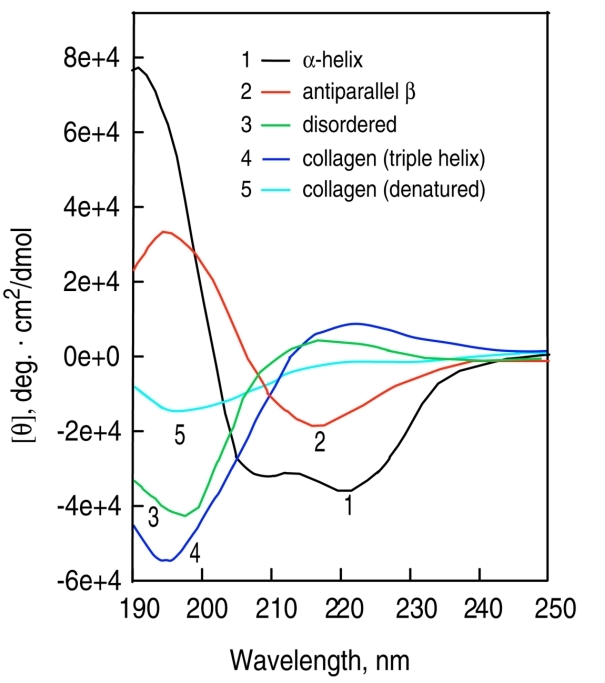 Circular dichroism (CD) spectra of polypeptides and proteins with representative secondary structures.
Select Service
Support resource
Protein Sample Preparation, Measurement, and CD Data Analysis
Accurate CD results rely heavily on proper protein handling, precise measurement settings, and rigorous data interpretation. The following section outlines the full workflow from sample preparation to final spectral analysis.
1. Protein Sample Preparation
To ensure reliable and reproducible CD data, the protein sample must meet strict quality standards:
- Purity Requirements: The protein should be purified to >95% purity. Low-purity samples may introduce interfering peaks that obscure accurate structural interpretation.
- Solubility and Clarity: The protein must be completely dissolved in the selected buffer or solvent, forming a homogeneous, transparent solution. Aggregation or precipitation can distort light signals and compromise data quality.
- Concentration Range: The protein concentration must be carefully controlled between 0.1 and 1 mg/mL. Concentrations outside this range can lead to weak signals or detector saturation, affecting the reliability of the CD spectrum.
- Buffer Selection: Choose a buffer with high optical transparency and minimal UV absorbance. Avoid additives like DTT or imidazole at high concentrations, as they can introduce background noise. Phosphate-buffered saline (PBS) is commonly recommended due to its compatibility with CD measurements. Adjust the pH to maintain protein stability and prevent denaturation during scanning.
2. Sample Determination and CD Spectral Measurement
Instrument calibration and measurement settings play a crucial role in capturing high-quality spectra:
- Instrument Calibration: Before scanning, the CD spectrometer should be zero-calibrated and its wavelength accuracy verified.
- Background Correction: First, record the CD signal of the blank buffer to serve as a background reference. Then, scan the sample spectrum across the desired wavelength range (typically 190–250 nm), which may be adjusted based on the protein's properties.
- Scanning Parameters:
- Bandwidth: 1.0 nm
- Step size: 1.0 nm
- Integration time per data point: 0.5 seconds
These settings are chosen to improve the signal-to-noise ratio while maintaining spectral resolution.
For thermal stability studies (CD-melting curves):
- Use a circulating water bath pre-heated before scanning.
- Place a precision needle thermometer into the cuvette to monitor temperature in real-time.
- A typical temperature ramp program involves equilibrating at 25°C for 5 minutes, then heating to 95°C at 1°C per minute, collecting CD data every 2°C. This temperature range and ramp rate can be adjusted depending on the thermal sensitivity of the target protein.
3. CD Data Analysis and Secondary Structure Estimation
Once spectral data is collected, the next step is accurate interpretation and structure estimation:
- Baseline Correction: Subtract the background signal from the raw CD data to obtain the true spectral curve of the protein.
- Structure Fitting: Use validated analysis software such as SELCON3, CONTIN, or CDPro to deconvolute the spectrum and calculate the relative content of α-helices, β-sheets, β-turns, and random coils.
- Spectral Smoothing and Validation: Apply smoothing algorithms carefully to avoid overfitting. To verify CD-derived structural results, cross-reference findings with complementary techniques like X-ray crystallography or nuclear magnetic resonance (NMR) when possible.
Summary
Each component—from protein purity and buffer composition to spectral acquisition and analysis—affects the final outcome of CD-based structural evaluation. Strict control over experimental variables ensures trustworthy results, particularly for applications involving folding studies, protein-ligand binding, or thermal stability characterization.
Troubleshooting Circular Dichroism Experiments: Common Issues and Proven Solutions
Even with a well-designed protocol, circular dichroism experiments can be affected by subtle factors—from protein quality to instrument variability. Here's a breakdown of frequent problems and how to resolve them effectively.
Protein-Related Issues
1. Protein Purity
Problem: Impurities in the protein sample (e.g., degradation fragments or unrelated proteins) can introduce misleading spectral features, especially in the far-UV region where peptide bond transitions dominate.
Solution: Use multi-step purification techniques such as affinity chromatography, ion-exchange, and gel filtration. Confirm that the final sample reaches >95% purity via SDS-PAGE analysis. Re-purify as needed until this benchmark is achieved.
2. Protein Concentration Accuracy
Problem: CD signal intensity must be normalized to standard units. Inaccurate protein concentration measurements can lead to misinterpretation of secondary structure content.
Solution: Avoid relying solely on colorimetric assays (e.g., biuret, Lowry, BCA, Coomassie blue), as results vary depending on amino acid composition. For most applications, measuring absorbance at 280 nm (A280) using a micro-volume spectrophotometer like a NanoDrop offers a more consistent and reliable approach.
Buffer Composition Challenges
1. Salt Concentration
Problem: High ionic strength buffers (e.g., with excessive Na⁺) can alter protein folding by neutralizing intramolecular repulsion, potentially causing proteins to collapse into more compact conformations. This impacts spectral interpretation of α-helices or β-sheets.
Solution: Use low-salt buffers to preserve the native conformation while ensuring protein solubility. Validate that the protein remains stable at reduced ionic strength.
2. Buffer Ion Type
Problem: Buffers with ions like Cl⁻ or Mg²⁺ show strong absorbance below 200 nm, often distorting CD signals in the far-UV region.
Solution: Opt for phosphate-buffered saline (PBS), which provides excellent transparency. If ion effects are under investigation, restrict interpretation to wavelengths above 200 nm to minimize interference. Always record an absorbance baseline for comparison.
Instrument and Cuvette-Related Considerations
1. Cuvette Path Length and Material
Problem: Errors in optical path length or impurities in the cuvette material can distort spectral amplitude and lead to inaccurate structural quantification.
Solution: Verify the cuvette path length using the interference fringe method with a standard UV-Vis spectrophotometer. Always use high-quality quartz cuvettes that are certified for low UV absorbance.
2. Instrument-to-Instrument Variability
Problem: CD instruments differ in optical components, potentially resulting in significant discrepancies when analyzing the same sample on different machines.
Solution: Regularly calibrate instruments using standard reference materials (SRMs) such as camphorsulfonic acid (CSA) or camphorsulfonic acid ammonium (ACS). These compounds feature well-characterized ellipticity peaks. Establish a wavelength-dependent calibration curve by comparing your measured values to the SRM's known theoretical values. Apply correction factors to normalize data across platforms, improving data reproducibility and comparability.
Final Tip
CD spectroscopy is a sensitive, high-precision tool—but it demands rigorous attention to sample quality, buffer compatibility, and system calibration. When each variable is carefully controlled, CD becomes a powerful method for detecting subtle conformational shifts in proteins, validating folding stability, and supporting structure-function studies in biopharmaceutical R&D.
Summary and Future Outlook of CD Technology
CD spectroscopy offers a sensitive and non-destructive method for studying protein structures. By measuring the differential absorption of left- and right-handed circularly polarized light (Δε = εL − εR), CD provides direct insights into both secondary (e.g., α-helix, β-sheet) and tertiary (e.g., aromatic residue environments) structural features of chiral biomolecules.
One of the key strengths of CD is its ability to analyze proteins at low concentrations (0.1–1 mg/mL) under near-physiological conditions, making it highly suitable for evaluating conformational stability, monitoring folding dynamics, and assessing the effects of environmental changes or ligand binding.
Limitations to Address
Despite its versatility, several technical limitations need to be managed for optimal use:
High Purity Requirement: Samples must be >95% pure to avoid spectral interference from contaminants.
Buffer Compatibility: Buffers must be optically transparent and free of ions like Cl⁻ that absorb in the far-UV range.
Instrument Optimization: Parameters such as slit width, scan speed, and cuvette path length must be precisely tuned for consistent results.
Cross-Instrument Variability: Results can vary between CD machines due to differences in optical components, making calibration with reference standards (e.g., CSA, ACS) essential for reproducibility and platform comparability.
Future Directions in CD Technology
To overcome current limitations and expand its applicability, future development in CD analysis is trending toward:
Integrated Technologies: Combining CD with complementary techniques like Differential Scanning Calorimetry (DSC) or fluorescence spectroscopy for more comprehensive structural profiling.
High-Throughput Platforms: Developing automated systems that can analyze multiple samples simultaneously, accelerating screening in drug discovery pipelines.
Algorithm and Software Advancements: Leveraging AI and deep learning to enhance secondary structure prediction accuracy and reduce dependence on manual interpretation.
Standardized Data Repositories: Building open-access, annotated databases of CD spectra to support reference-based analysis and machine learning applications.
Closing Note
As instrumentation advances and analytical workflows become more standardized, circular dichroism will continue to be a cornerstone tool in structural biology and biopharmaceutical research. Its balance of sensitivity, speed, and low sample requirement makes it especially valuable for early-stage protein characterization and formulation stability studies.
References
- Kelly SM, Jess TJ & Price NC (2005). How to study proteins by circular dichroism. Biochimica et Biophysica Acta 1751(2):119–139. https://doi.org/10.1016/j.bbapap.2005.06.005
- Greenfield NJ (2006). Using circular dichroism spectra to estimate protein secondary structure. Nature Protocols 1(6):2876–2890. https://doi.org/10.1038/nprot.2006.202
- Woody RW & Dunker AK (1996). Aromatic and cystine side-chain circular dichroism in proteins. In: Fasman GD, ed. Circular Dichroism and the Conformational Analysis of Biomolecules. Springer, pp. 109–157. https://doi.org/10.1007/978-1-4757-2508-7_4
- Wallace BA (2019). The role of circular dichroism spectroscopy in the era of integrative structural biology. Current Opinion in Structural Biology 58:191–196. https://doi.org/10.1016/j.sbi.2019.04.001
- Bertozo L C, Kogut M, Maszota-Zieleniak M, Samsonov SA & Ximenes VF (2022). Induced circular dichroism as a tool to monitor the displacement of ligands between albumins. Spectrochimica Acta Part A 278:121374. https://doi.org/10.1016/j.saa.2022.121374
- Miles AJ & Wallace BA (2006). Synchrotron radiation circular dichroism spectroscopy of proteins and applications in structural and functional genomics. Chemical Society Reviews 35:39–51. https://doi.org/10.1039/B316168B
- Miles AJ, Janes RW & Wallace BA (2021). Tools and methods for circular dichroism spectroscopy of proteins: a tutorial review. Chemical Society Reviews 50:8400–8413. https://doi.org/10.1039/D0CS00558D
- Miles AJ, Wien F, Lees JG & Wallace BA (2005). Calibration and standardisation of synchrotron radiation and conventional circular dichroism spectrometers. Part 2: Factors affecting magnitude and wavelength. Spectroscopy 19(1):43–51. https://doi.org/10.1155/2005/263649
- Miles AJ & Wallace BA (2020). Chapter 6: [High-throughput CD and integrative methods] in Houde DJ & Berkowitz SA, eds. Biophysical Characterization of Proteins in Developing Biopharmaceuticals, 2nd edn, pp. 123–152. Elsevier. https://doi.org/10.1016/B978-0-444-64173-1.00006-8