If you're evaluating far‑UV CD for mAbs or a circular dichroism service for ADCs, the question isn't just "can you collect spectra," but whether the workflow and documentation stand up in CMC decisions. This review outlines why Pronalyse Creative Proteomics is often chosen for end‑to‑end far‑ and near‑UV CD studies—covering sample planning, reporting fit, and traceability expectations—so you can scope a defensible package before you commit time and material. Disclosure: this is a first‑party review authored by the Pronalyse biophysical characterization team; we aim for a factual, operations‑grade assessment with authoritative references.
Key takeaways
- End‑to‑end CD workflow designed to yield CMC‑ready reports with traceability.
- Far‑UV plus near‑UV coverage, temperature control, and replicate policies that support comparability decisions.
- Method transparency: optional BeStSel/SP175‑based outputs with diagnostics, confirmed in SOW.
- Part 11‑aware data handling and ICH Q14/Q2(R2) alignment framed in practical buyer language.
Who This Is For and What Decision This Review Helps You Make
This review is written for CMC, analytical development, formulation, and stability teams working with therapeutic mAbs and ADCs. If you're planning comparability, stress/formulation screens, or higher‑order structure readouts, you'll leave with a vendor‑selection checklist and a clear view of a fit‑for‑purpose CD package that can drop into your internal CMC templates.
The 60‑Second Summary: Why Teams Pick Pronalyse for Far‑ and Near‑UV CD
Teams pick us when they want secondary and tertiary structure coverage on a single platform, combined with a documentation mindset built for CMC. Our standard setup is based on the JASCO J‑1500 with Peltier temperature control for precise far‑UV and near‑UV acquisition; reproducibility checks, baseline handling, and clear acceptance gates are part of the workflow. The differentiator isn't a single algorithm—it's an end‑to‑end process geared to decisions you need to defend, with CMC‑ready reporting and traceability.
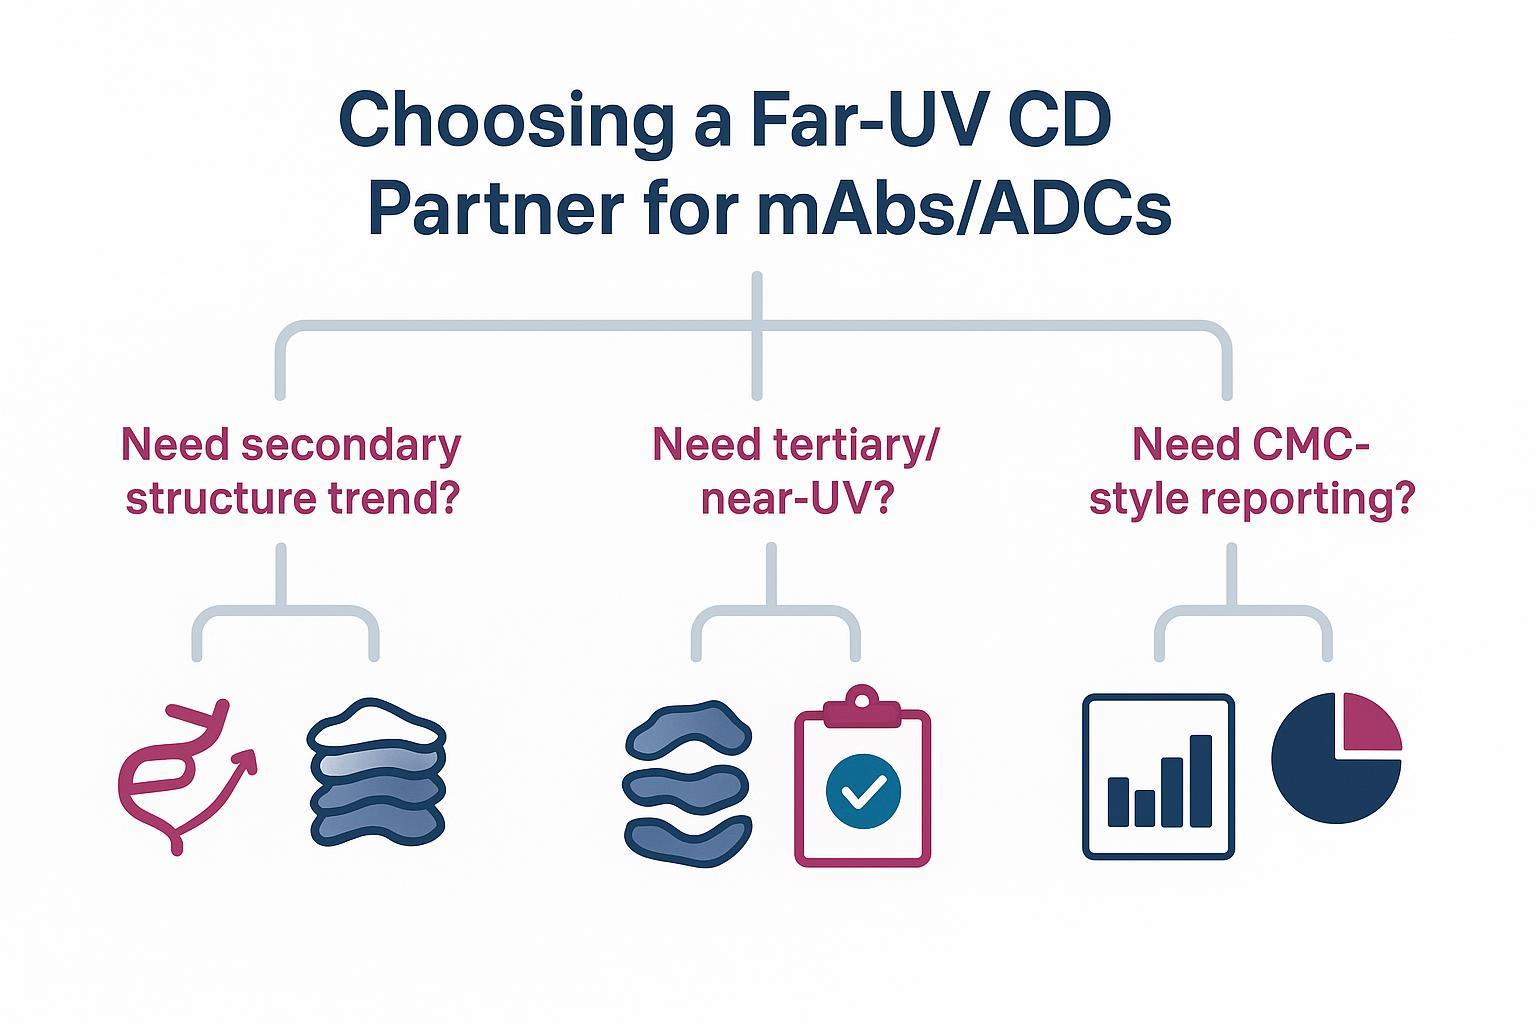 A buyer's decision map for selecting a far‑UV CD partner for mAb/ADC characterization.
What You Get From Far‑UV vs Near‑UV CD for mAbs/ADCs
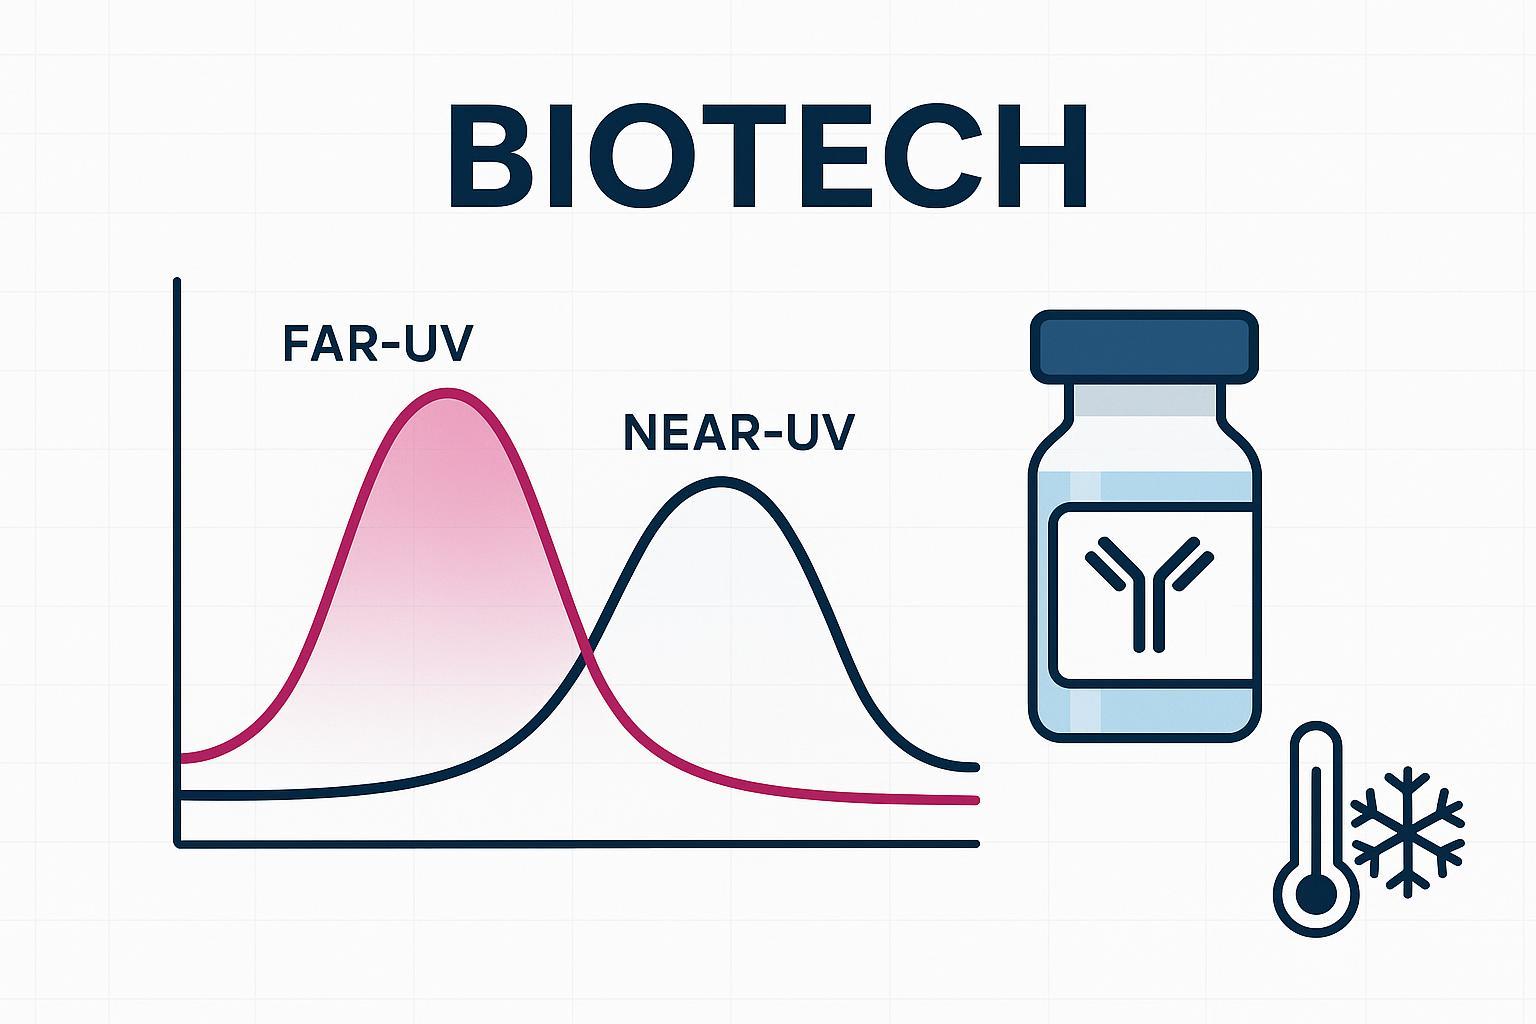
Think of far‑UV CD as your backbone sensor and near‑UV CD as your microenvironment monitor. Far‑UV (roughly 180–260 nm) reads out secondary structure trends—sensitive to unfolding, formulation changes, or stress. Near‑UV (about 250–320 nm) probes the environment of aromatics and disulfide bonds, flagging tertiary‑level shifts that far‑UV might miss or that aggregation could obscure.
In mAb comparability, far‑UV provides a reproducible fingerprint for secondary‑structure consistency, while near‑UV helps interpret subtle tertiary changes around aromatic residues and disulfides. In formulation screening, far‑UV detects drift early when buffers or excipients change; near‑UV supports ranking by tertiary integrity. For ADCs, near‑UV can be especially informative when linker‑drug conjugation perturbs local environments—though you'll want to separate true structural change from aggregation artifacts using replicates, baselines, and orthogonal checks.
If you're weighing method scope, our overview pages on far‑UV and near‑UV provide concise primers and planning notes: see the service pages for far‑UV CD, near‑UV CD, and this brief far‑ vs near‑UV comparison.
Platform and Workflow Snapshot — JASCO J‑1500 CD Spectropolarimeter
Operationally, what matters is stable optics, controlled temperature, and disciplined acquisition. We use a JASCO J‑1500 spectropolarimeter with a Peltier temperature controller to cover far‑UV and near‑UV ranges with tight thermal control. According to JASCO's own documentation, the J‑1500 series spans from deep far‑UV into the near‑IR, with accessory ecosystems that support precise temperature programming and multi‑cell workflows; see the official JASCO J‑1500 series overview for capabilities.
Our typical workflow: confirm sample identity and optical clarity; set pathlength and wavelength range based on buffer cutoffs; acquire far‑UV scans with baselines and replicates; proceed to near‑UV at higher concentration and longer pathlength; run optional thermal ramps with reversibility checks; and compile QC and interpretation notes for reporting. Instrument configuration and sample minimums can be confirmed during scoping and documented in the SOW.
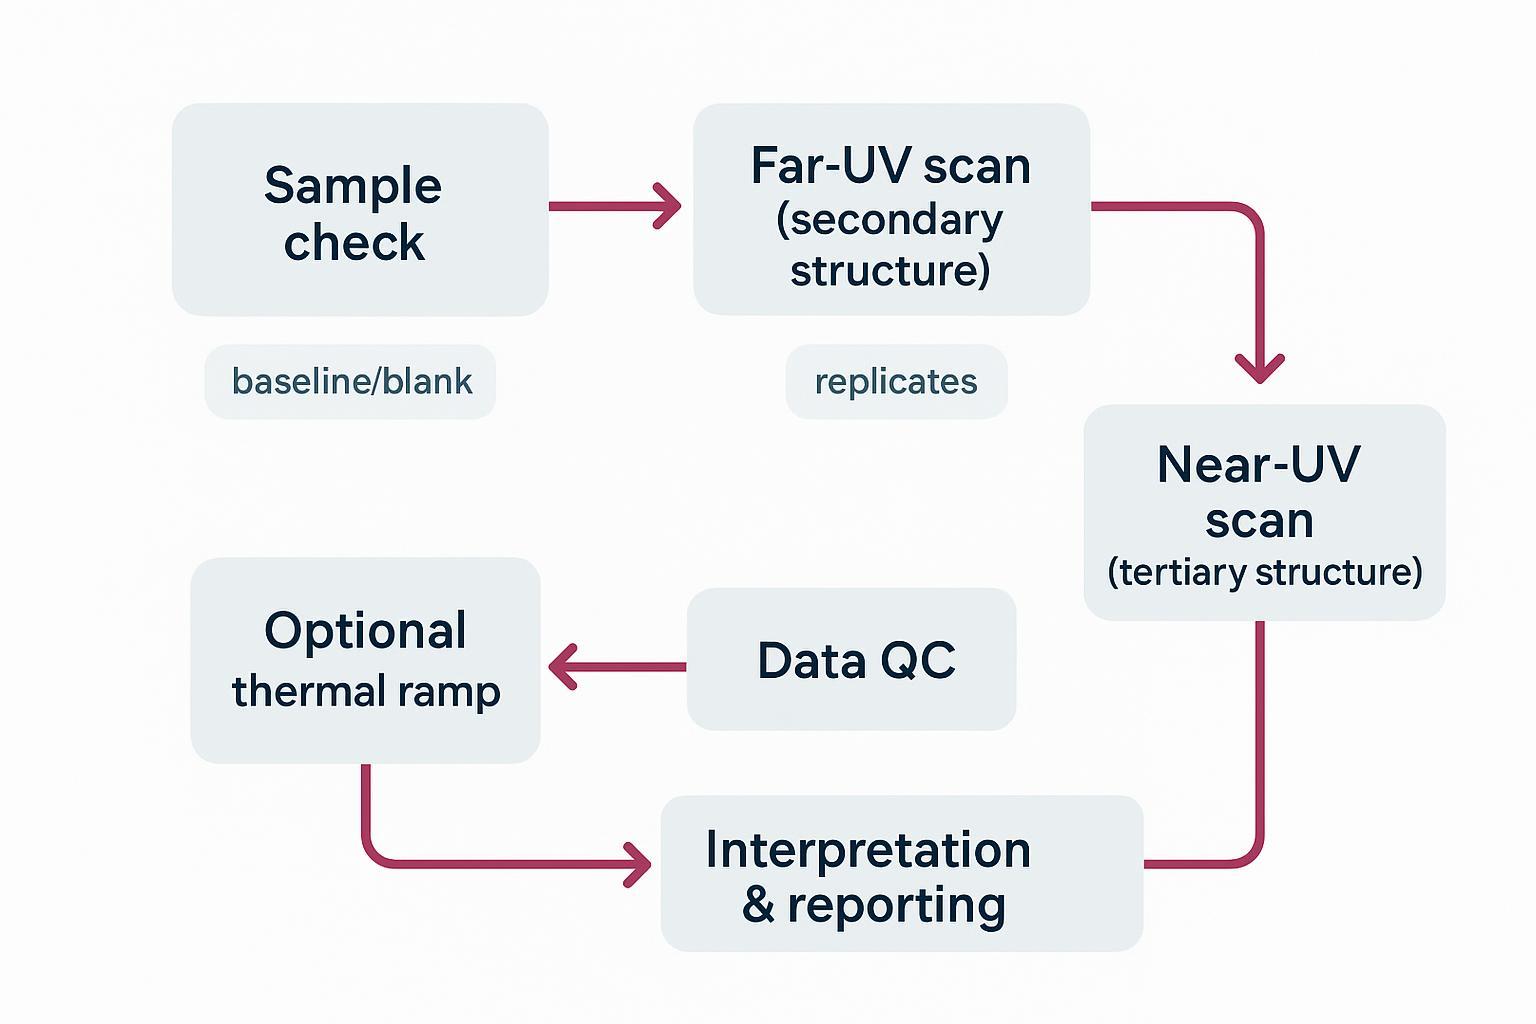 Typical far‑UV and near‑UV CD workflow used for mAb/ADC structure assessment.
"Validated SOPs" — What to Ask For and What Good Looks Like
When sponsors ask for "validated SOPs," they usually mean controlled, versioned procedures with clear acceptance gates and deviation handling that map to their quality expectations. Use this checklist when you assess any provider:
- SOP control and versioning with access to the current effective version; change history recorded.
- Acceptance gates for S/N and high‑tension/noise thresholds, explicit wavelength cutoff rationale, and nitrogen‑purge status where applicable.
- Replicate policy (per condition/day) and acceptance of replicate agreement; baseline/blank procedures documented.
- Thermal reversibility checks for melts and handling rules for non‑reversible transitions.
- Deviation handling with re‑run criteria, documentation, and communication pathway.
We align to controlled workflows and document acceptance gates; confirm the exact scope in your SOW. Deconvolution outputs (e.g., BeStSel / SP175‑based reporting) are available as optional reporting elements depending on study goals and data quality.
Secondary Structure Estimation: BeStSel and SP175 Without the Pitfalls
Deconvolution can add clarity—or confusion—depending on how it's done. BeStSel is particularly strong at handling β‑structures and reports diagnostics like NRMSD; the 2025 web‑server update in Nucleic Acids Research explains outputs and constraints in detail. For background, see the BeStSel web‑server update (2025, NAR).
Reference sets matter just as much. SP175 is a high‑quality SRCD reference set widely used for benchmarking and for deriving basis sets employed by algorithms such as CDSSTR, SELCON3, and CONTIN. In practice, your report should clearly disclose the algorithm used, the reference set (e.g., SP175‑based), the wavelength range included in the fit, and fit diagnostics such as NRMSD, so interpretation boundaries are transparent. For context on SP175 and its role in CD deconvolution and benchmarking, see the Analytical Chemistry work on antibody CD datasets: analysis of therapeutic antibody CD datasets and reference‑set usage (Analytical Chemistry, 2024).
Two practical notes. First, ensure your wavelength range meets algorithm expectations; trimming too aggressively above 200 nm can bias results. Second, treat the numbers as estimates with error—use them comparatively across conditions rather than as absolutes. Deconvolution outputs (e.g., BeStSel / SP175‑based reporting) are available as optional reporting elements depending on study goals and data quality.
Sample Requirements for mAbs/ADCs: Volume, Buffer, and the Lowest Wavelength You Can Trust
Planning samples well saves time and material. As a general reference, our CD service page notes that the minimum liquid volume is generally 200 µL; near‑UV typically requires higher concentration and greater volume than far‑UV. Buffers for far‑UV must be UV‑transparent in the 190–250 nm region; phosphate and borate systems are commonly suitable, while strong absorbers or high concentrations of certain additives can raise the cutoff and degrade S/N. For quick primers, see our CD spectroscopy service landing page and the focused far‑UV and near‑UV pages.
Here's the practical rule of thumb: your buffer's absorbance sets the real lowest wavelength you can trust for far‑UV. If the buffer forces you to stop at 205–210 nm, plan your pathlength and concentration to maximize S/N in the usable range rather than chasing a theoretical 190–195 nm floor. We'll flag risks during scoping; instrument configuration and sample minimums can be confirmed during scoping and documented in the SOW.
Turnaround Time Drivers and How to Prevent Delays
Turnaround depends on scope and readiness, not just instrument hours. The largest drivers are whether you run far‑UV only or include near‑UV, how many conditions/timepoints you need, whether thermal melts are included, and whether any sample QC issues (high absorbance, aggregation, bubbles) appear at intake. Day‑to‑day scheduling also depends on cell availability and nitrogen purge stability for deep far‑UV ranges.
To move quickly, send this information upfront:
- Protein type and study goal (mAb vs ADC; comparability, formulation, or stress) and whether you need far‑UV only or both far‑ and near‑UV.
- Buffer recipe and excipients, target wavelength floor for far‑UV, desired pathlength if pre‑planned, and any near‑UV constraints.
- Sample concentration and total volume available per condition; whether thermal ramps and reversibility checks are desired.
- Any preference for deconvolution outputs (e.g., BeStSel/SP175) and how you plan to interpret them in CMC context.
Data Integrity and Traceability Aligned to 21 CFR Part 11
21 CFR Part 11 governs expectations for electronic records and signatures when electronic records are used in lieu of paper under predicate rules. The official regulation is published in the eCFR, and the FDA's Scope and Application guidance clarifies when and how it applies. For authoritative references, see the eCFR Part 11 text and the FDA's Part 11 Scope and Application guidance.
In buyer terms, ask your provider how raw data, processing steps, method parameters, approvals, and changes are tracked. At Pronalyse, Part 11 expectations are addressed through documented controls and traceability practices aligned to the sponsor's quality requirements. We map records, approvals, and audit‑trail elements so your teams can trace from spectra to report.
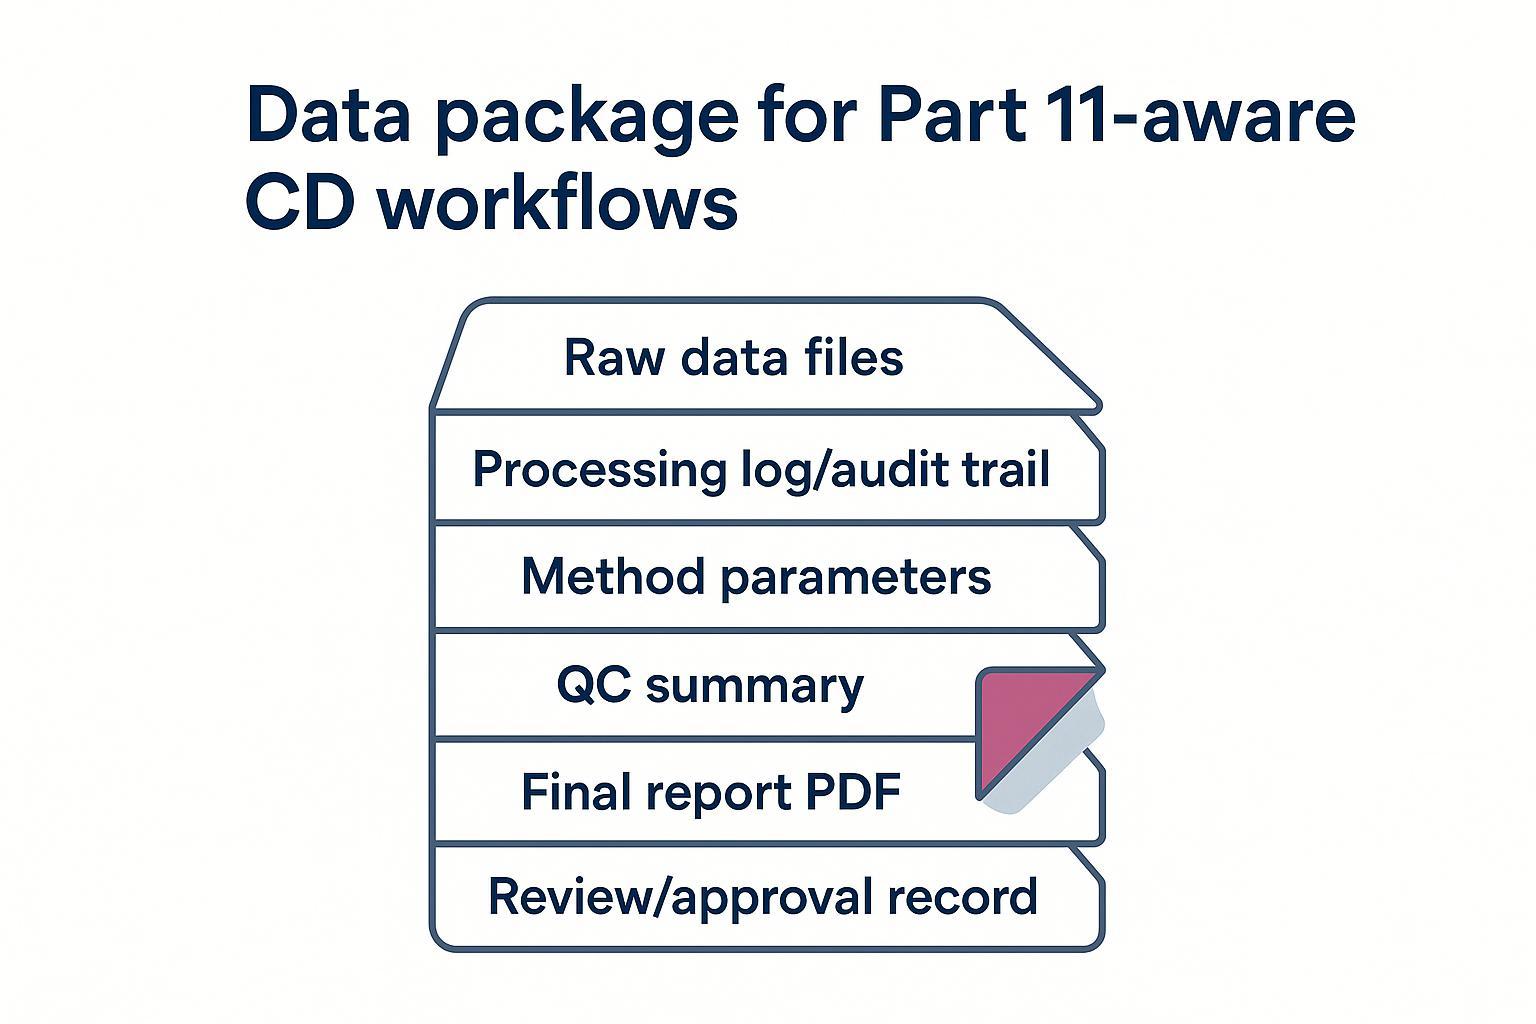 A practical data package checklist for Part 11‑aware CD studies.
Aligning With ICH Q14 and Q2(R2) for Fit‑for‑Purpose CD Methods
ICH Q14 formalizes analytical procedure development and lifecycle thinking, while Q2(R2) defines validation characteristics. For canonical references, consult ICH Q14 Analytical Procedure Development (FDA, 2024) and ICH Q2(R2) Validation of Analytical Procedures (FDA, 2024).
In CMC practice, CD is rarely a release assay; instead, it supports higher‑order structure evidence and comparability. What sponsors typically want is a clear Analytical Target Profile for the CD readout (what decisions it informs), robustness notes (buffer cutoffs, pathlength justification, replicate consistency), and consistent reporting. We plan studies and format reports so these elements are explicit, with deconvolution treated as a contextual aid rather than a single‑number truth source.
Reporting That Drops Into CMC Templates
Sponsors often ask, "Will this report slot into our template without rework?" To make that easy, we standardize the fields most teams expect:
- Objective, study design, and sample identifiers with chain of custody and handling notes.
- Instrument and acquisition parameters (model, wavelength range, step, bandwidth, pathlength, nitrogen purge), and cutoff rationale.
- QC results (S/N, HT/noise, replicate agreement), baselines, deviations, and re‑runs with justifications.
- Interpretation boundaries, including deconvolution algorithm/reference disclosure, wavelength range used, and fit diagnostics (e.g., NRMSD), plus statements on what the data supports—and what it doesn't.
We can format outputs to match your internal headings; confirm during scoping. Deconvolution outputs (e.g., BeStSel / SP175‑based reporting) are available as optional reporting elements depending on study goals and data quality.
Case Examples: What Good Decisions Look Like for mAbs and ADCs
- Formulation screen: A team screening excipients observed small but consistent changes in the far‑UV minima across several buffers. By planning pathlengths against buffer cutoffs and using replicate policies, they identified a formulation that preserved secondary‑structure signals without pushing the wavelength floor into noisy territory. The decision moved forward with confidence because the report documented QC gates and interpretation boundaries.
- Comparability study: For a post‑change mAb, far‑UV fingerprints remained within prior variability, but near‑UV showed localized tertiary shifts. The report's disclosures (algorithm/reference set, wavelength range, NRMSD) and overlay plots supported a "no meaningful difference" conclusion when triangulated with orthogonal methods.
- ADC stress: Under forced degradation, near‑UV suggested environment changes around aromatics. Replicate overlays and baseline checks, combined with orthogonal aggregation monitoring, helped separate true tertiary perturbation from aggregation‑driven artifacts, avoiding over‑interpretation of single‑point spectra.
- Redacted client example (permission pending): A mid‑sized biotech submitted an mAb comparability study for far‑ and near‑UV CD where deconvolution was provided as a redacted deliverable. Key metrics in the anonymized report: BeStSel NRMSD ≈ 0.025 for native vs process‑changed lots and thermal midpoint reproducibility ΔTm = 0.7 °C across three independent runs. Sponsor documentation noted the CD package was used as supportive HOS evidence during internal CMC review; client logo and identifying details are withheld pending written permission.
How to Scope Your Project With Pronalyse — Fast Checklist and What to Send
Here's the deal: well‑scoped inputs shorten timelines and reduce rework. Specify the protein type (mAb vs ADC, with linker/drug notes for ADCs), formulation components (especially UV‑absorbing excipients and surfactants), target lowest wavelength for far‑UV or "near‑UV only," number of conditions/timepoints, whether thermal ramps and reversibility checks are needed, and whether you'd like deconvolution outputs (BeStSel/SP175) included. Instrument configuration and sample minimums can be confirmed during scoping and documented in the SOW.
CTA — Request a Feasibility and Reporting Fit Review
Send your buffer recipe, sample budget, and decision goal. We'll recommend an acquisition plan and reporting structure aligned to your templates and quality expectations. If you're early in planning, we can flag wavelength‑floor risks and pathlength options so you don't burn material unnecessarily.
About the authors: Caimei Li, Senior Scientist at Creative Proteomics — LinkedIn profile. Our team supports mAb/ADC structure and stability programs using circular dichroism (far‑UV and near‑UV) and complementary biophysical methods. We focus on fit‑for‑purpose study design, transparent method disclosure, and documentation practices that help teams defend decisions in CMC settings.
Reviewed by: Quality Systems & Documentation Lead (Pronalyse)
Last updated: 2026‑01‑22