Author: Caimei Li, Senior Scientist, Creative Proteomics — Caimei Li, LinkedIn profile
Near-UV CD for mAb HOS comparability gives biologics teams a structure-sensitive readout of monoclonal antibody tertiary structure and depends on rigorous Near-UV CD sample preparation to avoid false differences. Used correctly, it offers an orthogonal fingerprint of higher-order structure (HOS) that helps confirm sameness across lots, process changes, or biosimilar candidates.
Key takeaways
- Near-UV CD reports tertiary microenvironments around aromatic residues and disulfides; it is complementary to far-UV CD and chromatographic assays.
- Fair comparison requires matched buffer, concentration, pathlength, temperature, settings, and clean baselines; otherwise you risk intensity-only artifacts.
- Prioritize normalized RMSD/SSR for similarity calls, support with Pearson/Spearman correlation, and consider PCA/Hotelling's T2 as optional enhancements.
- Use pilot runs to lock project-specific QC gates; avoid claiming universal thresholds.
- Treat "shape change vs intensity change" differently: shape changes warrant orthogonal confirmation, intensity-only differences usually collapse with proper normalization.
Why Near-UV CD is used for mAb HOS comparability
Near-UV CD is widely adopted as an orthogonal, structure-sensitive readout for mAbs because it probes tertiary microenvironments that far-UV CD (secondary structure) may miss. Reviews and protocols emphasize its utility for comparability work when collected under controlled conditions. For a practical foundation, the NIST near-UV CD protocol outlines buffer baselines, pathlength verification, and instrument guardrails in a method framework; see the NIST near-UV CD protocol entry. A comprehensive tutorial by Miles and colleagues synthesizes best practices and instrumentation nuances in Tools and methods for circular dichroism spectroscopy of proteins. Distinctive near-UV fingerprints across multiple therapeutic mAbs are documented in the Synchrotron Radiation CD analysis of 14 antibodies in Analytical Chemistry (Bruque et al., 2024; PMC dataset).
What Near-UV CD actually measures in antibodies
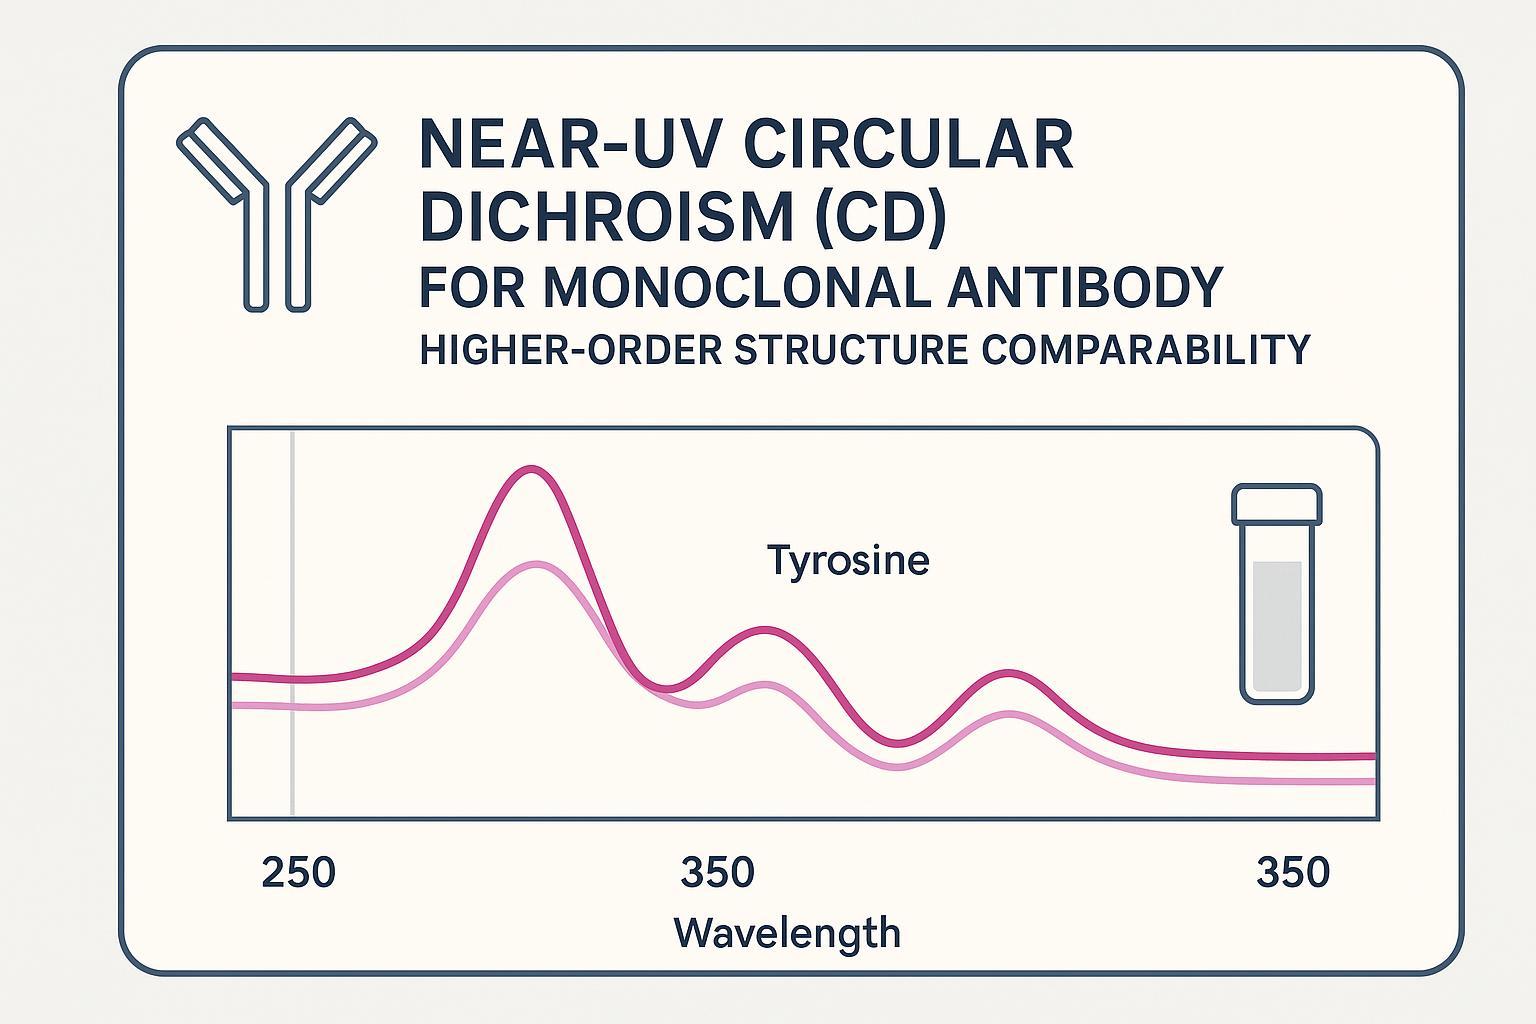
Near-UV CD (≈250–360 nm) measures differential absorption of left- and right-circularly polarized light arising from the chiral environments of aromatic side chains—primarily tryptophan, tyrosine, and phenylalanine—and from disulfide bonds. In practice:
- Tryptophan features often dominate around ~285–305 nm and respond to solvent exposure and packing.
- Tyrosine contributes in the ~270–290 nm region with environment-sensitive band shapes.
- Phenylalanine adds finer structure between ~250–270 nm.
- Disulfides contribute broader signals across the near-UV, reflecting bond geometry and electronic coupling. Because nearby aromatics can couple (exciton effects), the composite spectrum acts as a tertiary "fingerprint." Rather than deconvoluting into discrete folds, teams compare spectra using similarity metrics and corroborate findings with orthogonal assays. Mechanistic overviews are provided in Miles 2021's CD tutorial and illustrated in the 14-mAb SRCD dataset.
Which residues drive the signal and when the method struggles
Residue-level drivers:
- Trp/Tyr/Phe counts, mobility, and packing strongly influence signal magnitude and shape.
- Disulfide patterns can broaden or reshape features, especially if scrambling or oxidation occurs. Method limits:
- Sparse aromatics and highly heterogeneous domains (flexible linkers, glycan shields) tend to reduce signal magnitude and interpretability.
- High matrix absorbance or scattering lowers signal-to-noise (S/N) and pushes differences toward intensity-only artifacts. Evidence across multiple therapeutic mAbs shows unique fingerprints and sensitivity to pH and microenvironment changes; see the 14-mAb SRCD analysis and the tutorial guidance in Miles 2021.
Before you compare anything: Preconditions for a fair Near-UV CD comparison
For defensible comparability, lock these ground rules:
- Same buffer system and matched excipients; acquire a buffer-only baseline with identical settings for subtraction.
- Matched concentration verified by A280; matched, physically verified pathlength (especially for sub-mm cells).
- Consistent temperature (e.g., 20–25°C) and identical instrument parameters (bandwidth, data integration time, accumulations).
- Clean cuvettes; avoid bubbles/particulates; confirm detector HT/PMT stays in the linear range. Don't compare spectra collected under different buffer systems, unmatched pathlengths, unverified concentrations, or with significant baseline drift/noise. These preconditions are codified in the NIST protocol entry on near-UV CD and elaborated in Miles 2021's tutorial.
Practical sample preparation for Near-UV CD (mAbs)
A preparation workflow that transfers well across labs:
- Buffer exchange to a low-absorbance system (e.g., phosphate ≤25 mM); avoid Tris, imidazole, reducing agents, and high salt in near-UV. Filter through 0.22 μm and degas to minimize bubbles.
- Plan concentration and pathlength together. Near-UV signals are weak; typical ranges are ~0.5–5 mg/mL depending on pathlength and instrument linearity. Confirm total absorbance and HT/PMT stay well within the instrument's linear response.
- Handle cuvettes meticulously. Verify pathlength (sub-mm cells require specific checks), clean thoroughly, and orient consistently.
- Record and subtract buffer baselines acquired with the same settings and temperature. Convert spectra to molar ellipticity or mean residue ellipticity before comparisons.
- Mitigate scattering. Centrifuge or filter samples; if turbidity persists, check absorbance and consider DLS/SEC to rule out aggregates. Good practice details are summarized in Miles 2021 and reflected in the NIST near-UV CD framework.
Concentration, pathlength, and buffer: What changes the spectrum most
Intensity-only differences usually trace back to concentration, pathlength, or buffer mismatch. In principle, dilution and pathlength alter amplitude but not shape; normalization to molar/mean residue ellipticity should collapse those amplitude differences. UV-absorbing buffers or excipients elevate the baseline and detector load (HT/PMT), reducing S/N and distorting apparent intensity. The rule is simple: same buffer, same rules, same settings. Practical effects and controls are reviewed in Miles 2021's tutorial and reinforced in the NIST protocol.
Sensitivity limits: How small a change can you trust?
Confidence depends on S/N, aromatic residue content and distribution, instrument stability, and replicate agreement. Near-UV signals are orders of magnitude lower than far-UV, so integration time, accumulations, and stable bandwidth matter. Multi-mAb studies show near-UV detects tertiary perturbations that far-UV may not, but teams should establish acceptance bands via pilot replicates rather than universal thresholds. Vendor practice illustrates biosimilar similarity assessments with statistics; see the JASCO HOS similarity application note, and cross-check general practice in Miles 2021 and the SRCD 14-mAb dataset.
What to do when the signal is too weak
If your near-UV CD looks borderline or noisy, climb this troubleshooting ladder:
- Increase protein concentration judiciously; adjust pathlength to keep absorbance and HT/PMT in range. Verify concentration by UV-Vis.
- Optimize acquisition: extend data integration time (e.g., 1–4 s), increase accumulations (e.g., 3–10 scans), and keep bandwidth near ~1.0 nm for a balance of resolution and flux.
- Stabilize temperature and instrument optics; confirm lamp health and recent calibration.
- Average technical replicates to improve S/N and examine whether shape stabilizes.
- Check sample integrity: rule out aggregation/particles (SEC/DLS), degradation (intrinsic fluorescence, DSC), or excipient interference. If ambiguity persists, lean on orthogonals for confirmation. Workflow guidance is consistent with Miles 2021's practical recommendations.
Common interferences in biologics samples
Watch for these confounders:
- Surfactants/detergents (e.g., polysorbate 20/80, Triton X-100, SDS) can perturb tertiary structure and add absorbance/scattering. Keep well below CMC, monitor via UV-Vis, and use matched blanks.
- UV-absorbing buffers/salts (Tris, imidazole, high chloride), reducing agents, and high salt elevate baseline and HT. Prefer low-absorbance buffers and moderate ionic strength.
- Aggregates or particulates cause light scattering artifacts. Filter/centrifuge and confirm with DLS/SEC.
- Dyes and aromatic small molecules may overlap near-UV bands. Control concentration and subtract buffer spectra. Mechanisms and mitigations are surveyed in Miles 2021's tutorial.
Interpreting changes: Shape change vs intensity change
Operational rules of thumb:
- Shape change: peak positions and profiles shift or redistribute (e.g., altered Trp band between 285–305 nm). This suggests microenvironment changes or conformational rearrangements. Normalize, re-acquire replicates, and seek orthogonal corroboration.
- Intensity-only change: amplitude differs while shape overlays closely. This typically reflects concentration/pathlength/baseline mismatch and should collapse after normalization and matched prep. Practical examples (hypothetical but realistic):
- Example A (intensity-only): Two lots differ in amplitude. After buffer exchange and conversion to molar ellipticity, the residuals shrink; correlation remains ≥0.98; normalized RMSD drops from 0.045 to 0.012. Action: Investigate (repeat) → Pass.
- Example B (shape change): A biosimilar candidate shows 3–5 nm shifts in Tyr/Trp bands and redistributed peak shapes after normalization; NRMSD = 0.038 and Pearson = 0.84. Orthogonal intrinsic fluorescence shows a 4 nm red shift; HDX-MS indicates local protection change. Action: Fail comparability; open root-cause analysis.
- Example C (near sensitivity floor): Weak, noisy spectra with HT approaching limits. Increasing D.I.T. to 3 s, accumulations to 6, and concentration to ~1.8 mg/mL stabilizes shape. SEC/DLS confirm no aggregation. Action: Investigate → Pass after optimization. Interpretation logic follows the normalization and baseline guidance in the NIST near-UV CD framework.
Similarity metrics for Near-UV CD for mAb HOS comparability
Primary call: compute residuals between normalized spectra and use SSR/RMSD as the main metric; NRMSD (normalized RMSD) improves scale invariance and comparability across runs. Correlation (Pearson/Spearman) supports shape similarity—high correlation with residual amplitude differences points to intensity-only mismatch. Optional chemometrics (PCA, Hotelling's T2, Q-residuals) can add multivariate confirmation for larger datasets. Statistical framing is demonstrated in vendor practice in the JASCO HOS similarity application note, and general CD method guidance is provided by Miles 2021.
A simple decision workflow for HOS comparability using Near-UV CD
Use a pass / investigate / fail approach:
- Pass: Normalized RMSD/SSR within your pilot-locked acceptance band; correlation high; replicates overlay; QC gates satisfied.
- Investigate: Intensity-only differences suspected (NRMSD improves after normalization; correlation stays high). Repeat with matched buffer/pathlength, verify concentration and HT, and review orthogonals for aggregation or formulation effects.
- Fail: Persistent shape changes after normalization; NRMSD/SSR outside acceptance band; correlation drops; orthogonals corroborate tertiary disruption or aggregation. This pragmatic workflow aligns with ICH comparability principles (Q5E) without asserting universal numeric thresholds.
QC checklist: What a trustworthy Near-UV CD run should show
An audit-friendly, configurable QC gate list (define exact bands in your pilot):
- Baseline quality: buffer-subtracted spectra with low drift and noise across 250–350 nm.
- Absorbance/HT guardrails: detector voltage and total absorbance in linear range for the chosen pathlength.
- Replicate agreement: technical replicates overlay closely; calculate within-project CV at key wavelengths.
- Wavelength range consistency: stable coverage (e.g., 250–350 nm) with defined bandwidth and integration time; identical settings for sample and buffer.
- Documentation completeness: instrument model, settings, cuvette type/pathlength, temperature, concentration method, baseline spectra, normalization method, similarity metrics (NRMSD/SSR, correlation), and decision rationale. QC framing and documentation expectations are detailed in the NIST near-UV CD protocol entry.
When Near-UV CD should be paired with orthogonal methods
Pair strategically based on the suspected root cause:
- Aggregation or particles: confirm with SEC-MALS or DLS; see service-level overviews in Protein aggregation analysis services.
- Local microenvironment changes: intrinsic fluorescence or HDX-MS.
- Covalent modification/disulfide changes: peptide mapping (LC–MS).
- Global stability changes: DSC or nanoDSF. These orthogonals strengthen comparability calls in line with Q6B/Q5E. For broader context on HOS platforms, see Higher-Order Structure Analysis (platform overview).
What to ask your CRO before you outsource Near-UV CD comparability
To de-risk outsourcing and ensure audit-ready outputs, ask:
- Acceptance criteria: how will similarity be quantified (NRMSD/SSR bands, correlation support)? Is there a pilot to lock project-specific gates?
- Rerun policy: under what conditions do they repeat runs (baseline drift, HT excursions, unexpected scattering)?
- Documentation: will you receive raw spectra, instrument settings, baselines, normalization details, and calculations?
- Raw data ownership and format: confirm access to native files and export formats for independent review. If you need service-level guidance, see Circular Dichroism Analysis (antibody-focused) for an overview of how CD integrates into broader HOS programs.
Practical micro-example (neutral; single brand mention)
Disclosure: Pronalyse is our product. In a pilot comparability run, a team used Pronalyse to acquire reference and test mAb near-UV spectra under matched phosphate buffer and identical settings. After baseline subtraction and conversion to molar ellipticity, the team computed NRMSD and Pearson correlation. An initial amplitude offset collapsed post-normalization; NRMSD entered the pilot-locked acceptance band and Pearson stayed ≥0.98. The run passed, with documentation including raw spectra, baselines, instrument logs, and QC gate outcomes. Equivalent results can be obtained on other CRO/CD platforms when similar guardrails and documentation are applied.
Public, verifiable case — reanalysis-ready example: The open‑access study "The Structural Fingerprint of Therapeutic Monoclonal Antibodies…" provides near‑UV spectra and statistical analysis for multiple therapeutic IgG1s (figures and methods available) and is accessible at PMC: Structural fingerprint of therapeutic mAbs. Acquisition notes: near‑UV range, ~250–300 nm; 25 °C; 1.0 mm pathlength; bandwidth ≈1 nm; 3 accumulations. The authors report PCA and Euclidean‑distance separation (raw plots available); NRMSD/SSR and Pearson can be computed from the published spectra for independent verification (see also the NIST near‑UV CD protocol for processing/replicate guidance). This public example lets readers reproduce similarity metrics from canonical figures and strengthen audit trails.
Conclusion: How to use Near-UV CD confidently for mAb HOS decisions
Near-UV CD, applied with rigorous sample preparation, matched acquisition conditions, and pilot-locked QC gates, is a reliable orthogonal fingerprint for monoclonal antibody tertiary structure comparability. Prioritize normalized RMSD/SSR, use correlation as support, and escalate to orthogonals when shape changes persist or signals sit near the sensitivity floor. For broader HOS context and next steps, explore Higher-Order Structure Analysis and extended reading on secondary vs tertiary CD roles in Secondary Structure Analysis (Pronalyse).
References (selected for further reading)
- NIST near-UV CD protocol entry: Method framework and baselines.
- Miles AJ et al., 2021: Tools and methods for circular dichroism spectroscopy of proteins.
- Bruque MG et al., 2024: Synchrotron radiation CD analysis of 14 therapeutic antibodies.
- JASCO application note: HOS similarity assessment using high-throughput CD.
- ICH quality guidelines: Q6B/Q5E portals.