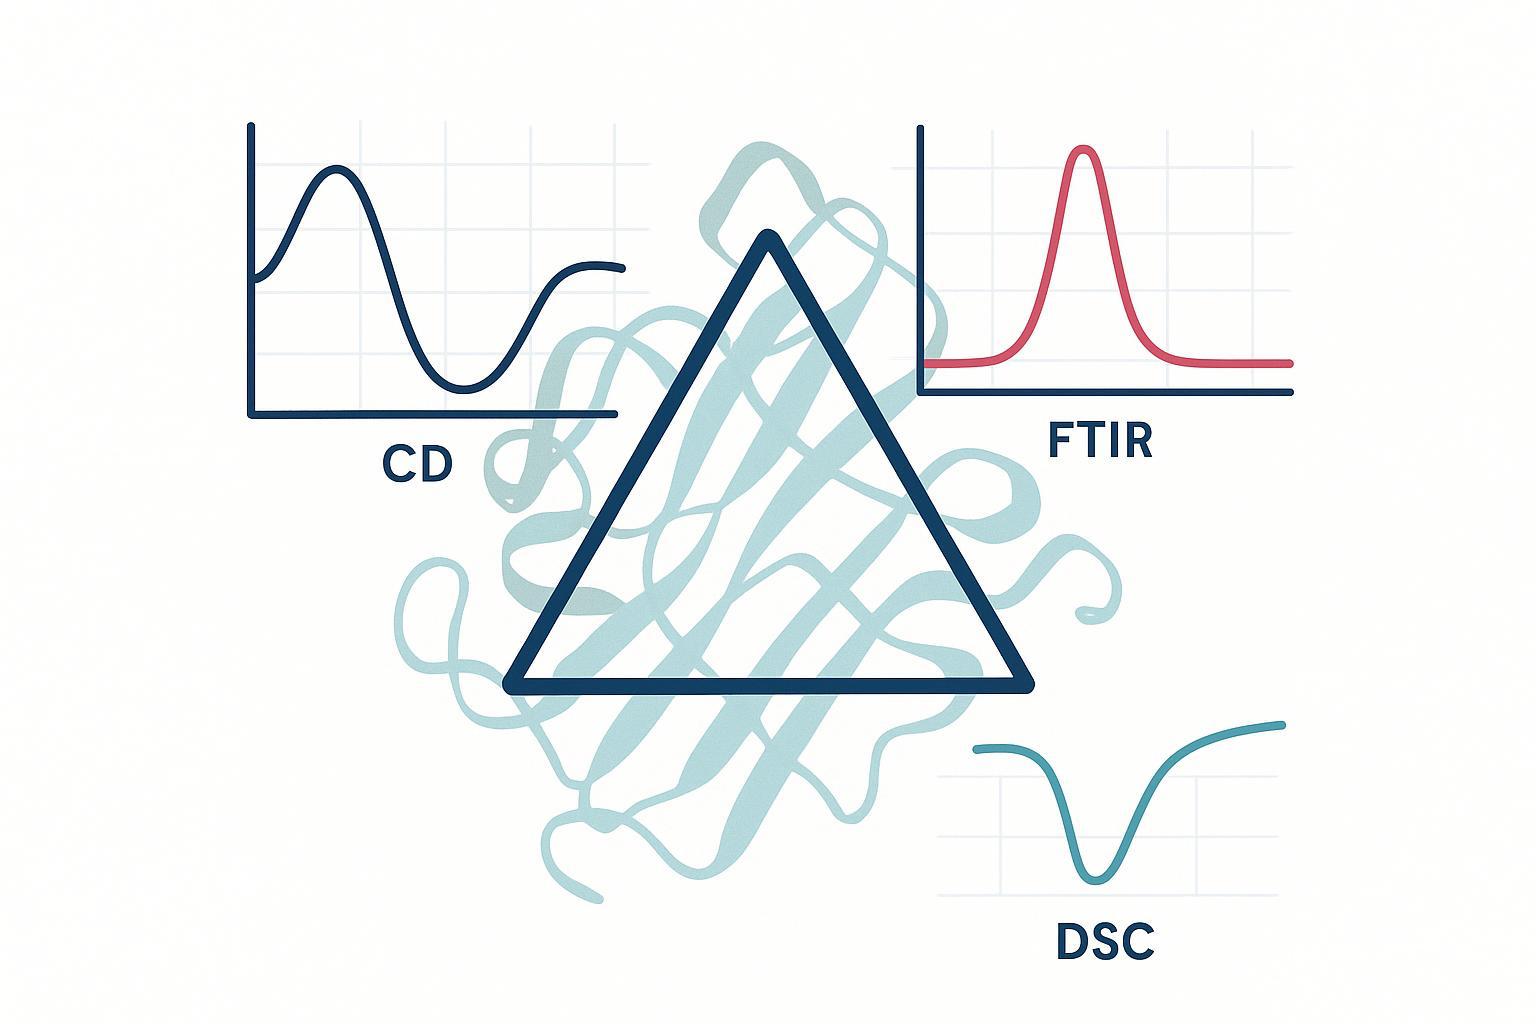
If you're weighing CD vs FTIR vs DSC for protein formulation screening, here's the short answer: use a structural fingerprint (CD or FTIR) to flag changes fast, then use DSC to rank finalists on thermal stability. This sequencing keeps sample use and spend low while preserving native buffers. In the next sections you'll get a decision matrix, clear sample/buffer guardrails, and scenario-based stacks grounded in secondary structure analysis methods and real-world protein formulation screening.
Key takeaways
- Choose methods by decision job: CD/FTIR track structure; DSC tracks thermal stability.
- Screen broadly with CD or FTIR under native buffers; run DSC only on top 2–4 candidates.
- Plan around sample limits: ~50–200 µL per condition and 0.2–5 mg/mL are common project windows.
- Trigger orthogonal checks when far‑UV access is limited, FTIR backgrounds dominate, or structure and Tm disagree.
The Quick Answer: When to Choose CD, FTIR, or DSC
- CD (far‑UV for secondary; near‑UV for tertiary) excels at quick structural fingerprints when your buffer's UV cutoff allows access below ~200–205 nm. Pick CD first when you want sensitive structure trendlines across many conditions with modest volume.
- FTIR (amide I) is the structural workhorse when far‑UV CD is blocked by excipients or UV‑absorbing buffers; ATR‑FTIR often fits sample‑limited, excipient‑heavy formulations. Use it to compare fingerprints and quantify secondary structure fractions via curve fitting.
- DSC is your stability ranking tool—quantitative Tm(s), ΔH, onset, and unfolding cooperativity. Reserve DSC for finalists or when stability context is the decision bottleneck.
Decision Matrix: CD vs FTIR vs DSC (Outputs, Sample Needs, Throughput, Cost)
Below is a crisp, side‑by‑side comparison to plan a minimal‑sample, minimal‑buffer‑change screen.
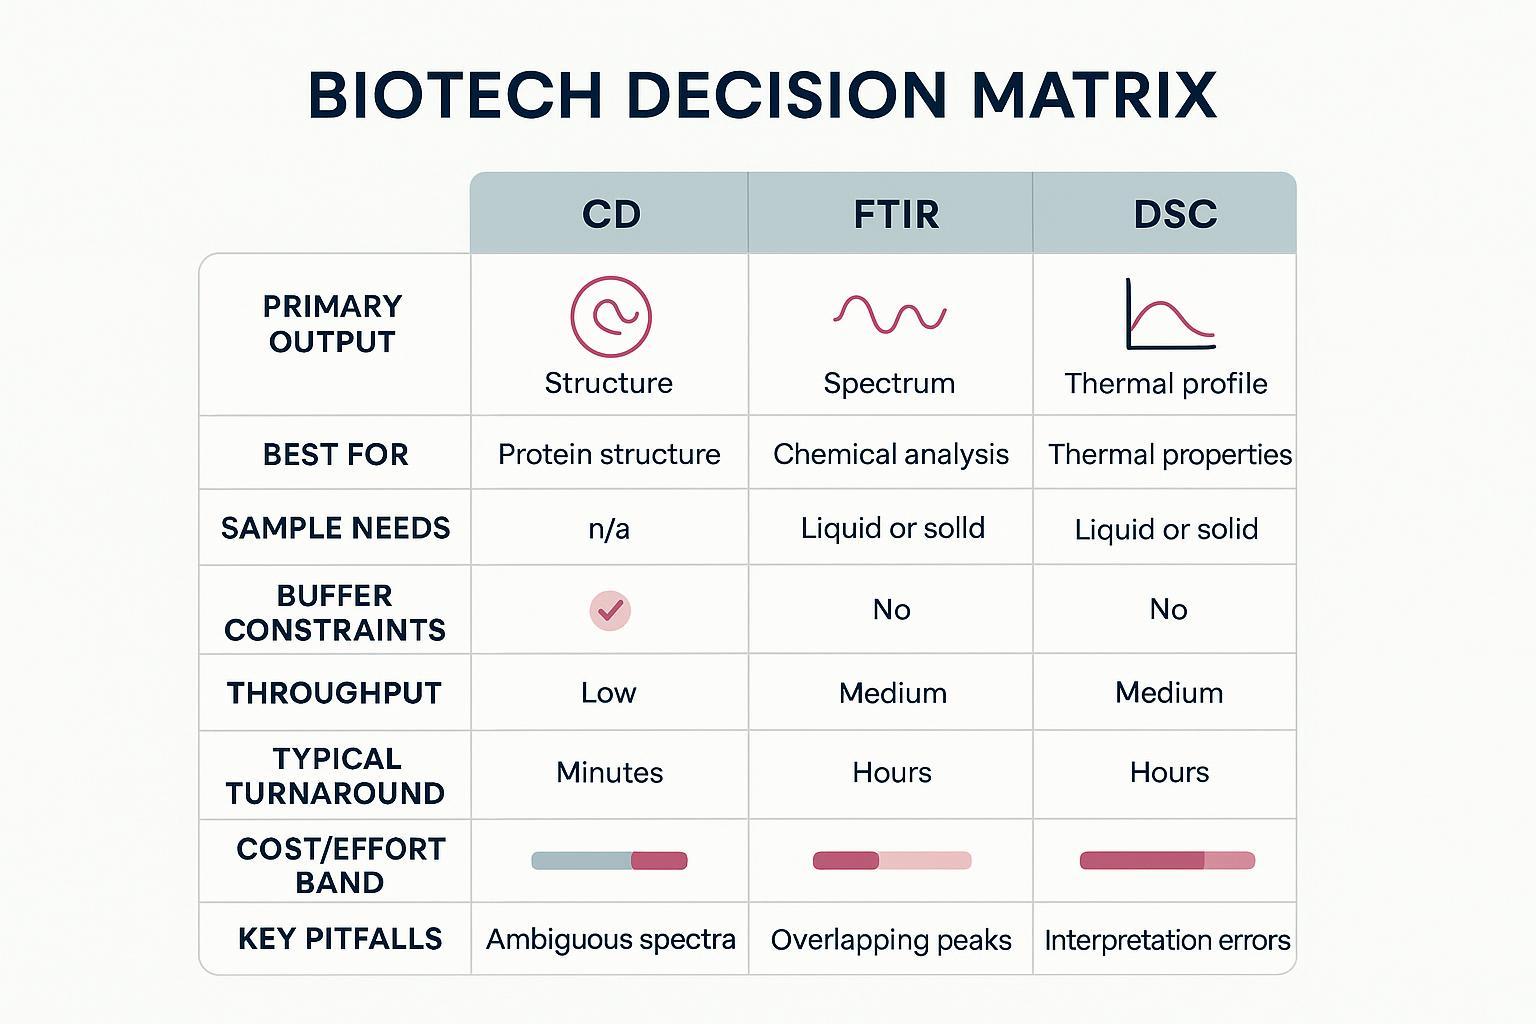
| Method | Primary outputs | Best for | Typical sample needs | Buffer constraints | Throughput | Typical turnaround | Cost/effort band | Key pitfalls |
| CD (far‑UV ± near‑UV) | Far‑UV spectra; optional deconvolution; near‑UV tertiary fingerprints | Rapid structural screening; comparability fingerprints | ≈200–400 µL; ≈0.1–1 mg/mL for 1 mm pathlength (instrument‑dependent) | Needs low‑UV‑absorbance buffers; far‑UV access ideally <200–205 nm | Medium (minutes per scan; autosamplers help) | Short lab time for scans; data review adds time | Low–Medium | Low‑λ cutoff from buffers; scattering from aggregates; deconvolution dependence |
| FTIR (amide I, ATR or transmission) | Amide I band profiles; second derivative + curve‑fit fractions; difference spectra | Structural screening under excipient‑heavy or UV‑blocking buffers | ATR: µL‑scale film; mg/mL‑range typical; transmission uses short pathlength cells | Water/background subtraction; excipients may mask amide I | Medium (fast acquisition; preprocessing drives time) | Short lab time; analysis requires careful preprocessing | Low–Medium | Over/under‑subtraction; overlapped bands; excipient/background interference |
| DSC (capillary or rapid‑screening) | Thermograms with Tm(s), ΔH, onset, cooperativity, profile shape | Stability ranking across finalists; unfolding domain mapping | Capillary: ≈300–330 µL per run at sub‑mg/mL common; RS‑DSC: ≈11 µL at high concentration | Requires matched sample/reference buffers; bubbles/aggregation impact baselines | Lower to medium (scan‑time limited) | Often hours to a day depending on scans/replicates | Medium–High | Baseline mismatches; aggregation during scan; composition artifacts |
Caption: Decision matrix comparing CD, FTIR, and DSC for secondary structure analysis and formulation screening.
Notes (as of 2026): Ranges are instrument‑ and provider‑dependent. For CD, fundamentals and guardrails are summarized in the JASCO CD primer and eBook; see the theory overview in the JASCO Learning Center and deconvolution updates in the 2025 BeStSel paper. For FTIR best practices on amide I analysis, see Waeytens (2023). For DSC, see capillary Nano DSC and rapid‑screening RS‑DSC vendor documentation.
- JASCO theory and eBook: see the overview in the JASCO Learning Center (accessed 2025) and the Circular Dichroism eBook (2025 update).
- BeStSel update: BeStSel 2025 NAR update enhances basis sets for CD deconvolution.
- FTIR methods: Waeytens 2023 FTIR review (PMC).
- DSC instruments: capillary TA Instruments Nano DSC and TA Instruments RS‑DSC; automated throughput examples in MicroCal PEAQ‑DSC automated distributor page.
What Each Method Actually Measures (and What It Doesn't)
- CD measures differential absorption of left‑ and right‑circularly polarized light. Far‑UV traces the peptide backbone, so you infer secondary structure; near‑UV probes tertiary environment around aromatics/disulfides. It can monitor thermal unfolding, but quantitative thermodynamics are not its core strength compared with DSC. CD cannot, by itself, pinpoint aggregation state or guarantee sameness across complex domains.
- FTIR measures vibrational transitions. The amide I band encodes α/β/turn/unordered content as overlapping peaks; with second‑derivative/self‑deconvolution and curve fitting, you generate secondary structure fractions. FTIR does not directly provide tertiary fingerprints and can be confounded by water and excipients without careful preprocessing.
- DSC measures heat capacity changes as proteins unfold. You obtain Tm(s), ΔH, onset, and cooperativity, which directly support stability ranking. DSC does not provide a structural fingerprint; a higher Tm alone does not prove that secondary/tertiary structure is preserved.
Typical Outputs You'll Use in Real Projects
- CD: Far‑UV spectra (190–260 nm) with condition‑to‑condition comparisons; optional deconvolution (e.g., BeStSel) to estimate % helix/sheet; near‑UV fingerprints for tertiary comparisons. Expect clean trend plots and caution around deconvolution claims when low‑λ access is limited.
- FTIR: Amide I component bands via second derivative and curve fitting; difference spectra for comparability; compact fingerprints that tolerate some excipients better than far‑UV CD.
- DSC: Thermograms with Tm(s), ΔH, and unfolding profile shape. You'll use these to rank stability across finalists and to interpret multi‑domain unfolding behavior.
Sample Requirements and Buffer Constraints (Where Projects Often Fail)
In formulation screening, you often can't change buffers. The practical goal is to work with what you have:
- Typical planning windows (illustrative): 50–200 µL per condition; 0.2–5 mg/mL; formulations with sucrose/trehalose, moderate–high salts, and polysorbate 20/80.
- Far‑UV CD is sensitive to UV cutoff and pathlength. If your buffer absorbs strongly below ~200–205 nm, far‑UV access shrinks and deconvolution confidence drops. For concrete guardrails on UV cutoffs, pathlength, and concentration, see the Pronalyse page on UV cutoffs, pathlength, concentration planning (as of 2026).
- FTIR (ATR) can sidestep UV cutoffs but requires rigorous water/background subtraction and careful fitting to avoid over/under‑subtraction artifacts.
- DSC needs matched sample/reference buffers and clean baselines. Degassing and careful filling reduce bubbles; composition can alter apparent transitions.
Quick sample‑budget formula: total volume ≈ conditions × (replicates + blanks + QC) × per‑run volume + 10%. Use CD/FTIR for the broad screen; cap DSC to top 2–4 conditions.
Throughput, Cost, and Time: How to Build an Efficient Screening Stack
- CD and ATR‑FTIR deliver medium throughput with minimal prep; minutes per spectrum and fast ATR measurements let you cover many conditions in a day. The time sink is usually data review (derivatives, fits, and side‑by‑side fingerprints), not acquisition.
- DSC is scan‑time limited; typical capillary scans run ~60–90 minutes plus loading/cleaning. Automated systems can push toward dozens of samples per day, but real‑world rates depend on replicates and method complexity. Plan DSC only for finalists or when stability uncertainty dominates your decision.
- Cost/effort: CD/FTIR typically sit Low–Medium per condition; DSC is Medium–High. Sequence methods to spend late and only where it changes the decision.
Scenario 1 — Formulation Screening: Which Condition Is Most Stable Without Burning Sample?
- Step 1: Screen structure with far‑UV CD if your buffer allows <200–205 nm access; otherwise use ATR‑FTIR for amide I fingerprints.
- Step 2: Flag structural drift via spectral trendlines or difference spectra; watch for scattering (CD) and background dominance (FTIR).
- Step 3: Send the top 2–4 conditions to DSC for Tm/ΔH ranking. If Tm ties occur, consider unfolding cooperativity and onset temperatures.
- Trigger orthogonal checks when: low‑λ access is limited; excipient backgrounds obscure FTIR; or the DSC ranking clashes with your structural fingerprints. Add near‑UV CD for tertiary context and a size/aggregation check (SEC/DLS) before concluding.
Scenario 2 — Comparability / Process Change: Did the Structure Drift?
- Use far‑UV CD fingerprints and consider near‑UV CD for tertiary changes between lots or after a process tweak; see Pronalyse's near‑UV CD tertiary fingerprints for method scope.
- FTIR amide I difference spectra complement CD for detecting subtle secondary structure shifts.
- Use DSC to contextualize any stability changes—helpful but not proof of structural sameness. For a deeper technique overview, see the biopharma context in the open‑access review Biopharmaceutical analysis — current analytical challenges (2025, PMC).
Scenario 3 — Stability Ranking: Tm Looks Great, But Structure Changed
It happens: a formulation raises Tm while secondary/tertiary structure indicators worsen. Here's the rule of thumb—when stability and structure disagree, add an orthogonal structure readout and a size/aggregation check (SEC/DLS) before making a call. For DSC instrumentation context, vendor pages such as TA Instruments RS‑DSC explain rapid‑screening options that can reduce per‑sample volume when you need to re‑rank finalists.
When You Must Do Orthogonal Verification (and What to Pair)
Add orthogonal confirmation when any of these are true:
- Far‑UV access is limited (>200–205 nm cutoff) or spectra show scattering/aggregation flags.
- FTIR amide I is dominated by water/excipient background or fits are unstable.
- DSC thermograms show Tm shifts that contradict CD/FTIR fingerprints, or baselines look noisy.
- Targets are multi‑domain or highly glycosylated, or claims are sensitivity‑critical (e.g., comparability narratives).
Recommended pairs (budget‑tiered): CD + DSC; FTIR + DSC; for high‑stakes calls, CD + FTIR + DSC.
A Neutral Recommendation: Choose the Cheapest Method That Answers Your Decision Question
- If your goal is to down‑select many conditions with limited sample, start with the structural fingerprint that best fits your matrix (CD if far‑UV is reachable, ATR‑FTIR otherwise). Confirm finalists with DSC.
- If your goal is comparability, combine a structural fingerprint (CD and/or FTIR) with DSC for context.
- If stability and structure disagree, add an orthogonal structure readout and a size method before deciding.
Method verification summary
- Key instruments & families: JASCO‑class far‑UV CD spectrometers (autosampler/1 mm flow cells), ATR/transmission FTIR (Agilent/Bruker/Specac ATR crystals), and capillary/microfluidic DSC (TA Nano‑DSC, RS‑DSC, MicroCal PEAQ‑DSC).
- Typical verification metrics: spectral similarity/WSD or correlation coefficients for CD/FTIR; Tm reproducibility (±0.2–0.5°C typical) and ΔH repeatability for DSC; aim RSDs <5% where applicable.
- Critical method parameters: pathlength (CD), resolution and derivative processing (FTIR), heating rate and cell volume (DSC).
- Date/version: verification notes current as of 2026‑01‑22. Retain raw spectra/thermograms and SOP references (Pronalyse internal SOPs and vendor manuals) for traceability.
Next Step: Get a Combined‑Methods Plan (Feasibility + Minimal Sample Strategy)
Disclosure: Pronalyse (Creative Proteomics) is our product.
If you want a minimal‑sample, minimal‑buffer‑change plan, share your buffer recipe, available volume, concentration, and decision goal. We'll suggest a sequencing strategy (e.g., CD/FTIR screen → DSC finalists) and call out orthogonality triggers tailored to your constraints. For reference, see Pronalyse's Far‑UV CD sample requirements and DSC service scope.
FAQ
Which is better for protein formulation screening: CD, FTIR, or DSC?
CD or ATR‑FTIR for fast structural fingerprints; DSC for stability ranking of finalists. This stack minimizes sample use and cost.
Can FTIR replace CD for secondary structure screening in excipient‑heavy formulations?
Sometimes. If far‑UV CD is blocked by buffer UV cutoff or excipients, ATR‑FTIR is a practical structural alternative. Confirm critical picks with an orthogonal readout.
How much sample do I need per condition if I want to avoid buffer exchange?
Plan around 50–200 µL and 0.2–5 mg/mL for CD/ATR‑FTIR screens (instrument‑dependent). Reserve DSC (≈300–330 µL capillary; or ≈11 µL at high concentration with RS‑DSC) for finalists.
Does a higher Tm always mean a better formulation?
No. Tm can increase while secondary/tertiary structure worsens. If stability and structure disagree, add an orthogonal structure readout plus SEC/DLS.
What are the most common artifacts that derail interpretations?
CD: low‑λ access and scattering. FTIR: water/excipient background and over/under‑subtraction. DSC: baseline mismatch and aggregation during the scan.
How quickly can a lab turn these around?
CD/FTIR data acquisition is fast (minutes per condition), but analysis takes thoughtful review. DSC is scan‑time limited; automation helps, but real‑world throughput is governed by method settings and replicates.
References
- CD deconvolution updates: BeStSel 2025 Nucleic Acids Research update.
- FTIR methods: Waeytens 2023 — Determination of Secondary Structure of Proteins by FTIR (PMC).
By Caimei Li — Senior Scientist, (Creative Proteomics). (Connect on LinkedIn: https://www.linkedin.com/in/caimei-li-42843b88/)