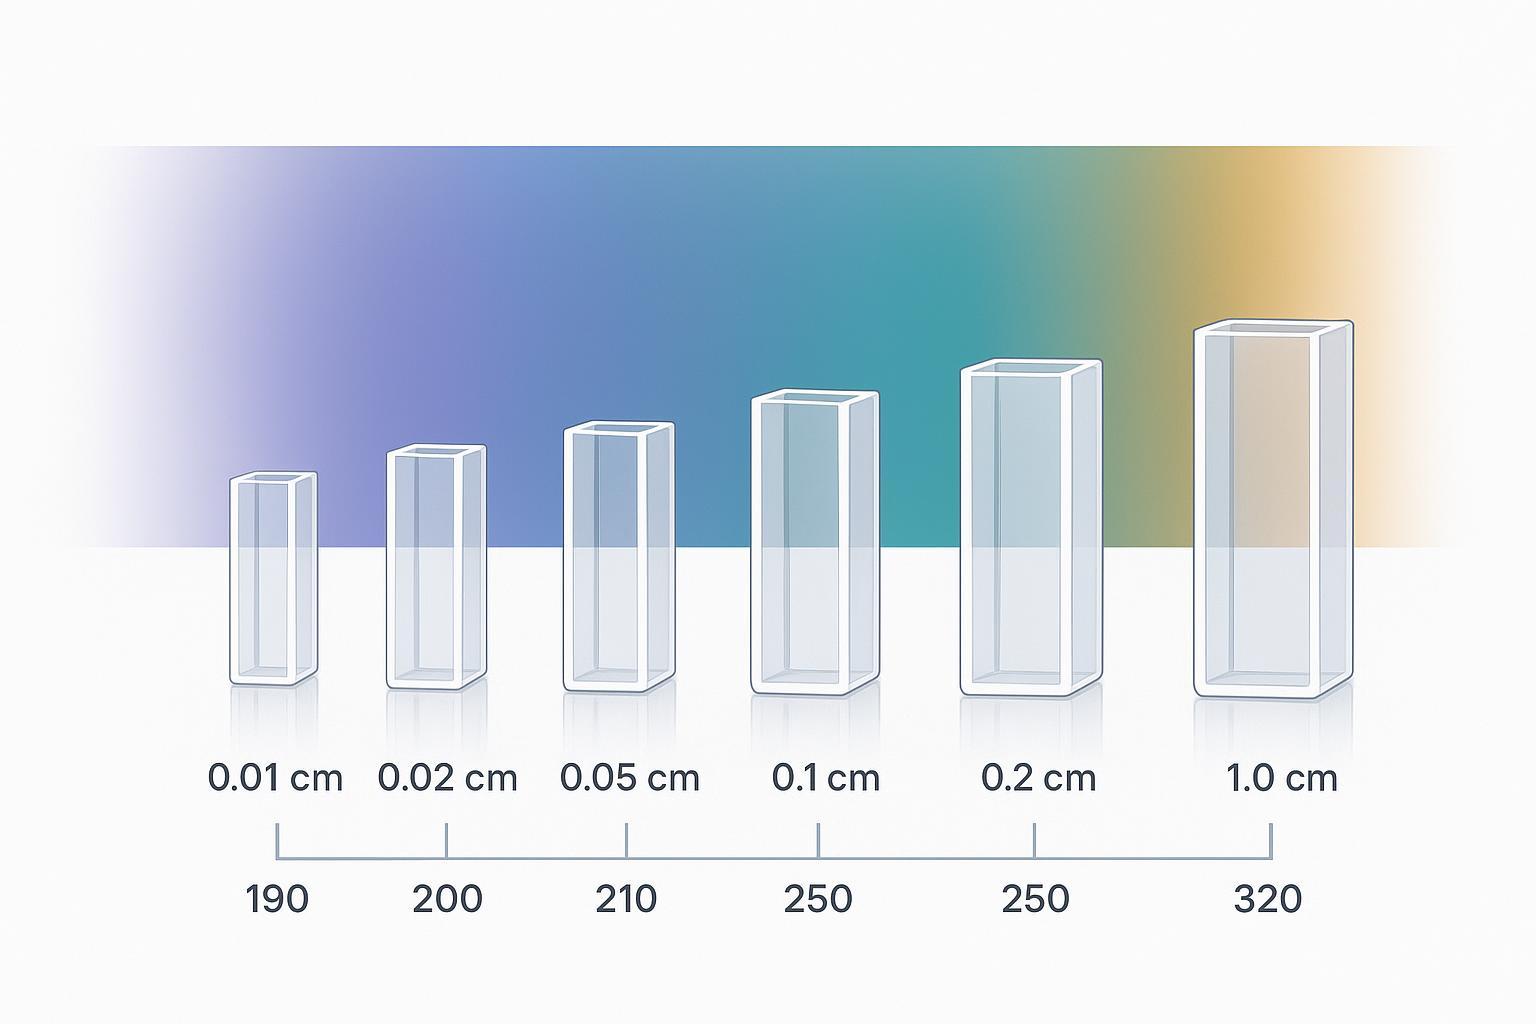
A visual overview of pathlength choices across Far‑UV to Near‑UV ranges.
Getting circular dichroism sample requirements right is the fastest way to avoid noisy spectra and re-runs. The two biggest levers are Far-UV CD buffer compatibility and the pathlength–concentration pairing you choose up front. This best-practice guide gives practical starting ranges, a simple planning framework, and ready-to-use checklists that work for most protein systems, with an example anchored on a Human IgG1 mAb.
Key takeaways
- Pick your lowest wavelength first, then choose pathlength, set concentration, and confirm the buffer UV cutoff with a matched blank. That sequence prevents "we can't get below 205 nm" surprises.
- Keep total absorbance near the wavelength of interest around ~1 AU; watch HT/PMT voltage as an early warning of saturation.
- Far-UV is far more sensitive to buffer absorbance than Near-UV; short pathlengths and simple, low-absorbance buffers preserve access to 190–205 nm.
- Near-UV usually needs higher concentration and a 1 cm cell; if the signal is flat, check folding and aromatic/disulfide content before pushing concentration higher.
- The blank must match the sample buffer exactly, including additives and reducing agents, and be run in the same cuvette.
What this guide covers and why sample specs matter
This guide focuses on practical setup for Far-UV (about 190–250 nm) and Near-UV (about 250–320 nm) CD measurements: how to select pathlength, concentration, and buffer so you reach your wavelength goals without saturating the detector. Correct up‑front choices improve signal-to-noise, simplify baseline subtraction, and reduce wasted instrument time.
Far-UV vs Near-UV CD: different wavelengths, different constraints
Far‑UV CD reports on peptide bonds and secondary structure; Near‑UV CD reports on the asymmetric environments of aromatic side chains and disulfide bonds. Because most buffers, salts, and excipients absorb strongly below ~210–220 nm, Far‑UV is much more sensitive to buffer composition and pathlength than Near‑UV. For a concise overview of protein CD practice and data quality expectations, see the tutorial review by Miles, Janes and Wallace in 2021, which summarizes collection and analysis guidance in an operationally useful way in the academic context: Tools and methods for circular dichroism spectroscopy of proteins: a tutorial review (2021). For vendor-side operational tips that highlight S/N and HT behavior, see JASCO's best‑practice notes for biological samples.
The four inputs you must define upfront: concentration, volume, pathlength, and UV cutoff
A planning sequence that prevents most failure modes: choose your lowest wavelength target, then select a cuvette pathlength that keeps absorbance manageable, set concentration to reach sufficient S/N, and finally verify buffer transparency with a matched blank. Aim to keep absorbance near the wavelength of interest around ~1.0 AU and maintain HT/PMT voltage below about 600 V during collection, as many core SOPs advise; see the Harvard Center for Macromolecular Interactions getting-started guidance.
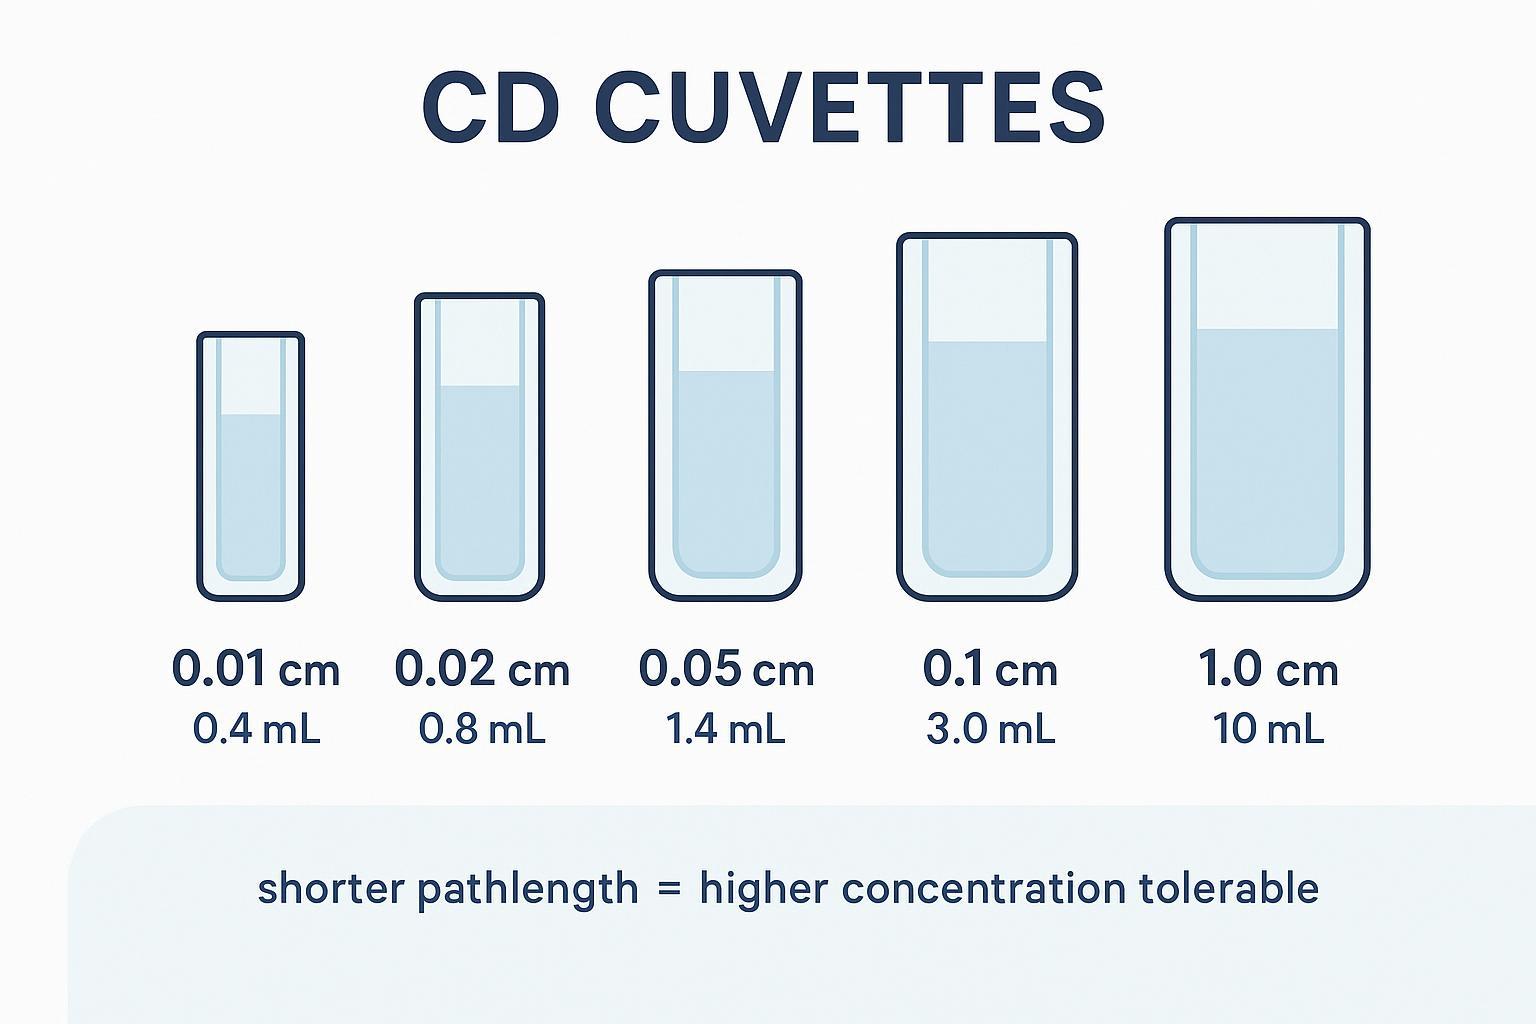 Pathlength and volume planning for circular dichroism (CD) measurements in Far‑UV and Near‑UV.
Below is a compact starting-point table for soluble proteins. Treat ranges as starting points, then adjust by observed absorbance or HT and by your buffer transparency.
| Pathlength (cm) | Typical fill volume | Far‑UV starting concentration (mg/mL) | Near‑UV starting concentration (mg/mL) |
| 0.01 | model‑dependent (≈5–100 µL) | 0.5–1.0 | n/a (signal too weak) |
| 0.02 | model‑dependent (≈20–150 µL) | 0.3–0.5 | n/a |
| 0.05 | model‑dependent (≈50–300 µL) | 0.15–0.3 | 0.5–1.0 |
| 0.10 (1 mm) | ≈300 µL (typical) | 0.1–0.2 (up to ~1.0 if buffer permits) | 0.5–1.0 |
| 1.00 | ≈3 mL (typical macro; microcells smaller) | rarely used for Far‑UV | 1.0–5.0 |
Notes: 1 mm and 1 cm fill volumes approximate Harvard CMI guidance; sub‑millimeter cells vary by model—check your cuvette datasheet. Keep total absorbance manageable at the lowest wavelength you need.
Methods provenance and validation examples
Published guidance and vendor notes consistently show the practical trade-offs summarized here. Example summaries (literature- and app-note–derived): an IgG1 mAb in 10–20 mM phosphate at 0.02 cm often remains usable to ~195–200 nm with HT/PMT <600 V**, whereas the same sample in **HEPES at higher ionic strength with a 0.1 cm cell** commonly shows a **cutoff near 210–220 nm and HT spikes >700 V. Concentration series with lysozyme illustrate that HT/PMT rises predictably with concentration and pathlength; reduce pathlength or dilute to regain S/N. These observations align with practical guidance from Miles et al., 2021 and vendor notes from Harvard CMI; original spectra and HT logs can be shared on request.
Far-UV CD sample requirements: practical starting ranges
Worked scenario used throughout: Human IgG1 mAb (~150 kDa) in 20 mM sodium phosphate, pH 7.2, plus 50 mM NaCl; no glycerol, sugars, or strong UV absorbers. Measurement goals: Far‑UV 200–250 nm as primary; try to extend to ~195 nm if HT allows. Recommended cuvettes: 0.01–0.02 cm quartz. Starting concentrations: 0.2–1.0 mg/mL depending on pathlength and buffer transparency. If you must reach 195–200 nm, simplify the buffer and consider reducing chloride or overall ionic strength.
Two quick rules help you avoid saturation and noisy baselines. First, target about ~1 AU absorbance at the wavelength of interest; if HT rises sharply or the high-tension trace clips, shorten the pathlength or lower concentration. Second, the "best" concentration depends on the combined absorbance of protein plus buffer, not the protein alone. Vendor and core-facility documents reach the same conclusion: short pathlengths plus low-absorbance buffers unlock deeper Far‑UV; see the OSU Jasco J‑815 operating notes and JASCO tips.
Near-UV CD sample requirements: when you need more protein
Near‑UV signals come from asymmetric environments around aromatic residues and disulfide bonds, so they are weaker and more sequence-dependent than Far‑UV signals. Plan for a 1 cm cell and about 1–5 mg/mL protein. If the trace looks flat, check folding with Far‑UV or DSC/fluorescence first, then increase concentration or accumulations as needed. The National Institute of Standards and Technology notes that Near‑UV commonly requires substantially higher concentrations than Far‑UV in standard cells; see the NIST Near‑UV protocol summary. To satisfy search intent, note the phrase many readers look for here: Near-UV CD concentration and pathlength are typically higher and longer, respectively, than Far‑UV.
If you still cannot see a structured Near‑UV signal after confirming folding, check aromatic content (Trp/Tyr/Phe) and disulfide presence; sequences with few aromatics may give minimal signal even at high concentration.
Buffer compatibility and UV cutoffs: how to avoid absorbance walls
UV cutoff is the lowest wavelength where the optical system still gets enough light through the solution and cuvette. A buffer that appears "transparent at 280 nm" can still wall off the Far‑UV. Practical rule: select the lowest wavelength you must reach, choose an appropriate pathlength, and then verify that your buffer and additives allow that wavelength by running a matched buffer blank in the same cuvette.
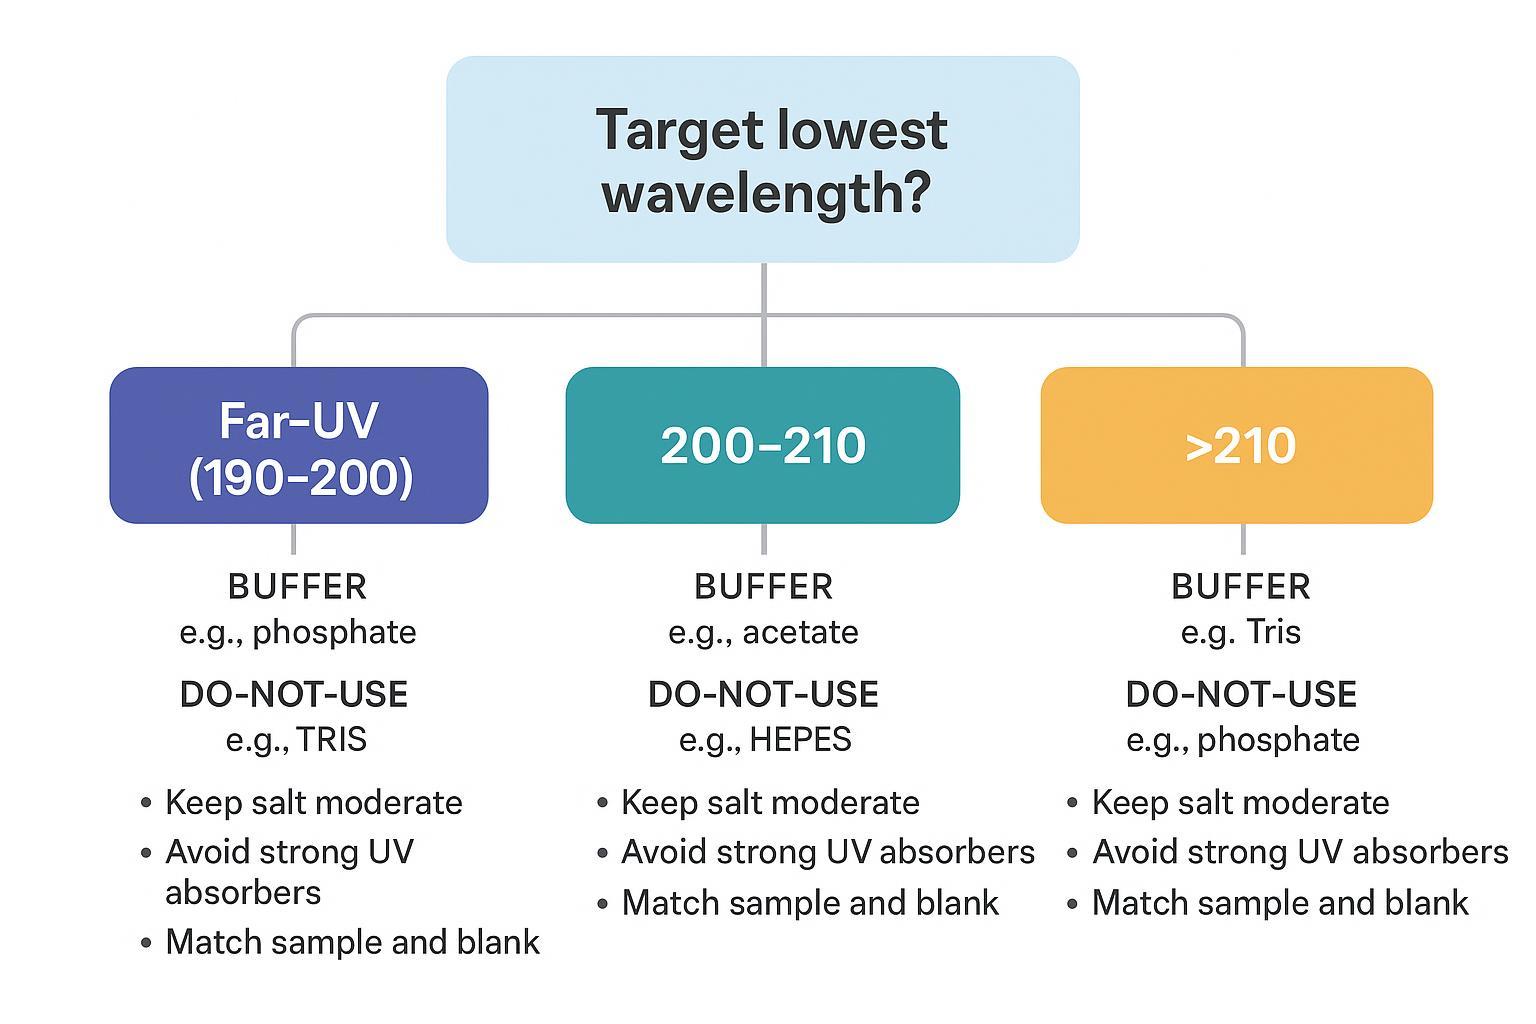 A practical buffer decision tree based on Far‑UV CD wavelength goals and UV cutoff limits.
Directionally useful guidance from CD‑oriented SOPs: low‑concentration inorganic buffers like phosphate or acetate tend to allow access to 200–210 nm, whereas HEPES/MOPS/PIPES and imidazole often restrict access below ~220–225 nm. Keep salts modest, avoid strong UV absorbers, and match sample and blank precisely. For buffer selection cautions (including chloride in Far‑UV and NaF as an alternative), see the UConn Structural Biology CD SOP. For practical operator tips on keeping light throughput high and HT reasonable, see JASCO's tips for biological samples.
Common buffer components that usually work and what commonly breaks Far-UV
Generally CD‑friendly in the Far‑UV at modest concentrations: phosphate (≈10–25 mM), acetate (≈10–25 mM), and borate at higher pH; keep ionic strength low when you need ≤200 nm access. Frequent troublemakers for low wavelengths: HEPES, MOPS, PIPES, Tris at higher concentrations or lower reagent grades, imidazole (e.g., post‑Ni‑NTA), and high chloride levels. If you must use any of these, raise the minimum wavelength (for example, to 205–210 nm), shorten pathlength, or perform buffer exchange to a low‑UV alternative before deep Far‑UV.
Salts, additives, detergents, glycerol, and reducing agents
High chloride can lift the UV floor below ~200–205 nm; consider lowering ionic strength or using NaF when deep Far‑UV is essential, as some SOPs recommend. Detergents and many additives (including DTT/TCEP) absorb in the Far‑UV; only include them when functionally necessary, and match their concentrations exactly in the blank. Viscosity modifiers like glycerol complicate baselines and can increase scattering; keep formulations simple for CD, especially for Far‑UV, and record exact compositions to support reproducibility.
Sample quality checklist before you book instrument time
Before you schedule time, do a quick pre‑flight check that directly ties to common failure modes: confirm clarity with no visible particles (prevents scattering noise), spin or filter if aggregation is suspected (stabilizes baselines), verify concentration by A280 or an orthogonal assay (avoids saturation or weak signals), prepare an identical matched buffer blank from the same stock and additives (enables clean baseline subtraction), select a pathlength consistent with your lowest wavelength target (guards against absorbance walls), and define the temperature plan and number of accumulations (improves S/N and reproducibility).
Baseline, blanks, and matched buffers—the most common avoidable mistake
Baseline subtraction only works when the blank matches the sample buffer exactly, including pH, salts, excipients, and reducing agents, and when both are run in the same cuvette. Acquire duplicate or triplicate accumulations of both blank and sample, average, and then subtract. Warning signs that your blank does not match include structured features in the subtracted spectrum that do not change with protein concentration, rising HT/PMT voltage despite reasonable protein levels, and inconsistent baselines across replicate scans. Facility guides emphasize these points and the value of enabling baseline subtraction in software; see the Harvard CMI CD resource for a succinct overview.
Pathlength selection by scenario—fast recommendations
Limited sample volume: use a short‑path cell (0.02–0.05 cm) to reduce fill volume, then raise concentration until HT is acceptable in your target region. High‑absorbance formulation buffer: prioritize shorter pathlength first and simplify the buffer if deep Far‑UV is required. Need lower wavelengths: step down to 0.02 or 0.01 cm and simplify the buffer; confirm feasibility with a blank before loading your protein. Near‑UV tertiary signal needed: move to a 1 cm cell and 1–5 mg/mL; if the signal remains flat after confirming folding, enrich concentration or increase accumulations.
Troubleshooting noisy spectra, saturation below 205 nm, and flat Near-UV signals
Noisy Far‑UV below ~205 nm is often caused by excessive buffer absorbance, dirty cuvettes, or insufficient nitrogen purge. Reduce pathlength or concentration to bring absorbance toward ~1 AU, switch to a low‑UV buffer (phosphate or acetate at modest molarity), clean the quartz with an appropriate acid wash per your facility SOP, and ensure purge is adequate. Saturation or clipping indicates that you have hit an absorbance wall: raise the minimum wavelength or change buffer/shorten pathlength. Flat Near‑UV can reflect unfolded protein or insufficient chromophores; verify folding (Far‑UV or DSC/fluorescence) and then increase concentration, use 1 cm pathlength, and run additional accumulations.
Submission template—what to send us for a fast feasibility check
If you want a rapid feasibility confirmation, send a concise, copy‑paste brief that includes your lowest wavelength target and full buffer recipe. Example template:
Protein type and size:
Target wavelength ranges: Far‑UV ____ to ____ nm; Near‑UV ____ to ____ nm
Cuvette options available on your side (if any): ____ cm
Desired pathlength on our side (if known): ____ cm
Concentration (current and acceptable range): ____ mg/mL (range ____–____)
Buffer recipe (exact): buffer name, pH, molarity; salts with molarity; excipients; additives; reducing agents
Sample volume available (per measurement): ____ µL
Temperature plan (°C) and nitrogen purge availability:
Replicate scans desired per region:
Special constraints (e.g., cannot remove HEPES or DTT):
Primary measurement goals (e.g., secondary structure estimate; tertiary environment comparison):
At Pronalyse, the team reviews the lowest wavelength requirement first, selects a pathlength that keeps HT reasonable, and then confirms whether the reported buffer allows the requested range; if not, they propose either a buffer exchange or a higher minimum wavelength and explain the trade‑offs.
Recommended deliverables—what you should receive from a professional CD run
Expect raw spectra, baseline‑subtracted spectra, HT or PMT logs, and any absorbance traces captured during the run; method notes that capture bandwidth, step size, scan speed, number of accumulations, nitrogen purge status, temperature, cuvette pathlength and brand/model; QC notes on any deviations; and for Far‑UV, secondary structure estimates with the method and reference basis set cited. For specific region capabilities and deliverable scope, you can also review the Far‑UV service description or the Near‑UV service description.
When CD isn't enough—complementary assays for aggregation and stability
CD can show you whether secondary or tertiary features change, but not which species are present or whether aggregates are forming. Consider DLS and Size Exclusion Chromatography (SEC) for size/aggregation, DSC for thermal stability, steady‑state fluorescence or intrinsic tryptophan for local environment changes, and LC–MS for identity checks and sequence‑level modifications. Think of CD as a fast structural fingerprint that pairs well with orthogonal biophysical methods when you need mechanism or species resolution.
References
- Miles AJ, Janes RW, Wallace BA. Tools and methods for circular dichroism spectroscopy of proteins: a tutorial review. Chem Soc Rev. 2021. https://pubs.rsc.org/en/content/articlehtml/2021/cs/d0cs00558d
- Harvard Center for Macromolecular Interactions (CMI). Circular dichroism resources and getting-started guidance (facility resource pages/SOP). (accessed 2026). https://cmi.hms.harvard.edu/circular-dichroism
- UConn Structural Biology. Using CD-1: Circular dichroism spectropolarimeter instructions (SOP). 2017. https://health.uconn.edu/structural-biology/wp-content/uploads/sites/177/2017/10/Using-CD-1.pdf
- National Institute of Standards and Technology (NIST). Near-UV CD spectroscopy protocol summary. 2024. https://www.nist.gov/document/near-uv-cd-protocol-0
- Ohio State University (OSU). Operating the Jasco J-815 circular dichroism spectrometer (operating notes / SOP). (accessed 2026). https://chemistry.osu.edu/sites/chemistry.osu.edu/files/Operating%20the%20Jasco%20CD_2_0.pdf
- Siligardi G., et al. Practical considerations for CD spectroscopy of proteins (methods review / application notes). 2018. https://pmc.ncbi.nlm.nih.gov/articles/PMC6299240/
- Creative Proteomics / Pronalyse. Circular dichroism spectroscopy service overview and troubleshooting resources (internal service pages). https://www.creative-proteomics.com/pronalyse/circular-dichroism-spectroscopy-analysis-service-protein-structure-elucidation.html
A quick wrap‑up
Plan your experiment in this order—lowest wavelength, pathlength, concentration, buffer—and verify with a matched blank before loading precious sample. Keep absorbance near ~1 AU where you care most, simplify buffers for Far‑UV, and reserve 1 cm and higher concentrations for Near‑UV. If you'd like a neutral feasibility check, you can share your buffer recipe and targets through our circular dichroism spectroscopy analysis service overview, and we'll confirm options without committing the sample.