Spatial PTM Profiling: Why Tissue Context Matters
Protein post-translational modifications are inherently dynamic and context-dependent. A kinase that is hyperactivated in the invasive front of a tumor may be quiescent in its core. A glycan epitope that decorates immune-cell-rich stroma may be absent from adjacent epithelial compartments. Standard bulk PTM analysis — which homogenizes the entire tissue — averages these spatially distinct modification states into a single measurement, obscuring the very heterogeneity that drives disease progression and drug response.
Spatial PTM profiling addresses this gap by combining tissue-scale molecular analysis with positional information. Our service integrates multiple technology platforms to detect and quantify modified proteins while preserving their original tissue coordinates. This enables you to overlay PTM data onto histology images, identify modification gradients across tissue structures, and discover region-specific PTM biomarkers that correlate with clinical features.
The approach is particularly powerful in oncology, where tumor heterogeneity is a major barrier to precision medicine, and in neuroscience, where brain region-specific modification patterns govern circuit function. It also serves drug development — revealing where a kinase inhibitor engages its target within a tissue and which compensatory pathways are activated in specific microenvironments.
Our spatial PTM platform is organized into three complementary technology tracks, each suited to different experimental questions and sample types. These services can be used independently or in combination for multi-modal spatial profiling.
Technology Modalities for Spatial PTM Detection
We offer three core technology tracks for spatial PTM analysis. Each modality is backed by dedicated service pages with detailed protocols and deliverables.
Laser Capture Microdissection + Ultrasensitive MS (LCM-MS)
LCM enables precise isolation of specific tissue regions, cell populations, or even single cells from archival FFPE or frozen sections under direct microscopic visualization. The captured material is processed through our ultrasensitive PTM enrichment and LC-MS/MS workflow, producing modification-level proteomic data from as little as 1–10 µg of protein. This approach is ideal for comparing PTM profiles between adjacent tissue compartments — tumor vs stroma, cortex vs medulla, treated vs untreated regions within the same biopsy. Our spatial phospho-signaling analysis service uses this approach for phosphorylation mapping.
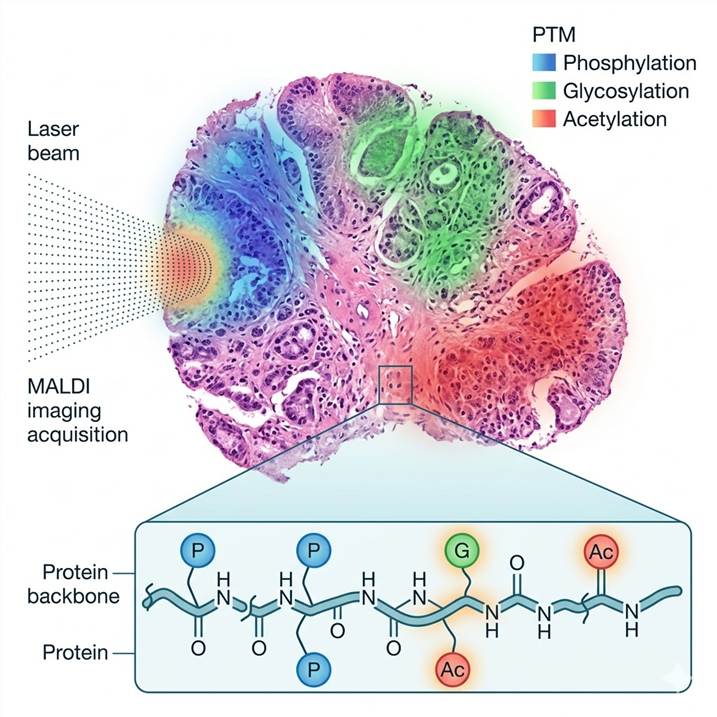
MALDI Mass Spectrometry Imaging (MALDI-MSI)
MALDI-MSI directly measures the spatial distribution of analytes across a tissue section by rastering a laser beam over the sample surface and acquiring a mass spectrum at each pixel. After on-tissue enzymatic digestion, peptides — including modified peptides — can be detected and mapped back to their tissue coordinates. This label-free approach provides unbiased spatial coverage and is particularly suited for discovery-phase mapping of multiple modification types simultaneously. Our spatial glycan profiling service leverages this technology for glycan imaging.
Multiplex Antibody-Based Spatial Detection
For targeted analysis of predefined modification sites, multiplex immunofluorescence (IF) or immunohistochemistry (IHC) using modification-specific antibodies provides single-cell resolution across entire tissue sections. Panels can be designed to detect 4–8 modification targets simultaneously (e.g., phospho-AKT, phospho-ERK, acetyl-histone H3) and co-registered with cell-type markers. Our spatial histone marks service and multiplex PTM immunoassays provide targeted options for hypothesis-driven spatial profiling.
These three modalities can be combined — for example, using MALDI-MSI for discovery mapping, LCM-MS for deep profiling of selected regions, and multiplex IF for validation — to build a comprehensive spatial PTM picture. For projects requiring enrichment of specific modified protein populations before spatial analysis, our antibody-based immunoaffinity precipitation service provides the necessary upstream sample preparation.
Applications: From Tissue Biomarkers to Drug Distribution
Tumor Microenvironment Phospho-Signaling Mapping
Kinase signaling is not uniform across a tumor. By combining LCM with phosphoproteomics, we can compare phosphorylation states of key signaling nodes (EGFR, AKT, ERK, STAT3) between tumor core, invasive margin, and adjacent stroma within the same biopsy. This reveals how signaling rewiring differs across microenvironments and which pathways are activated specifically at the tumor-host interface.
Spatial Glycan Biomarker Discovery
Glycosylation patterns vary dramatically across tissue regions and are often altered in disease. MALDI-MSI-based glycan imaging can identify glycan signatures that distinguish tumor subtypes, correlate with immune infiltration, or predict treatment response — all within the spatial context of the tissue architecture.
Target Engagement and Drug Distribution Studies
In preclinical drug development, knowing where a drug engages its intended signaling target within a tissue is critical. Spatial PTM profiling can map the phosphorylation state of the drug target and its downstream effectors across treated tissue sections, providing pharmacodynamic readouts with anatomical precision. For low-abundance modified proteins, our ultra-sensitive modified protein detection service provides the sensitivity needed for spatially resolved detection.
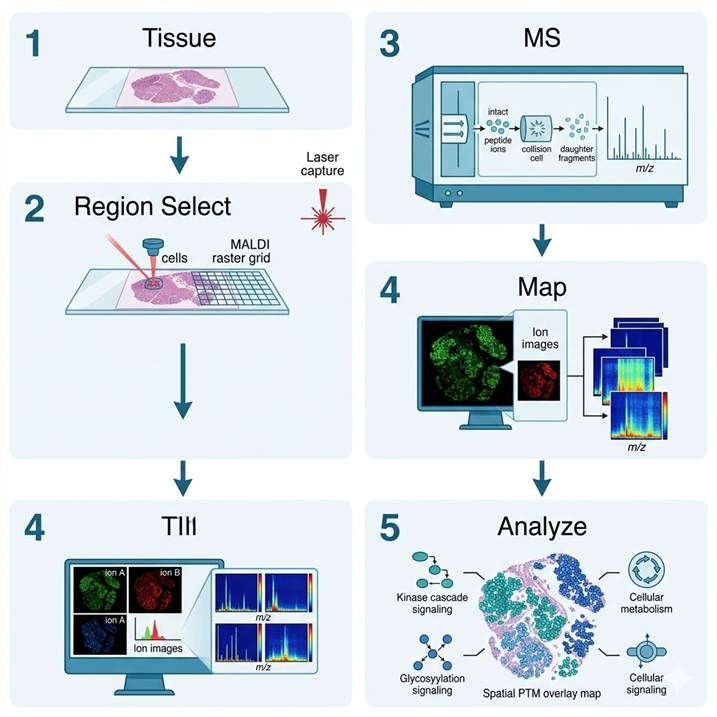
Workflow: From Tissue Section to Spatial PTM Map
The spatial PTM profiling workflow adapts to the chosen modality but follows a common framework. Typical project timelines range from 4–8 weeks depending on modality and sample number.
Step 1: Tissue Preparation & QC
- FFPE or frozen tissue sections mounted on conductive slides or membrane slides
- H&E staining for pathological annotation and region-of-interest marking
- Protein extraction QC for LCM-MS; matrix optimization for MALDI-MSI
- Antigen retrieval and antibody validation for multiplex IF/IHC
Step 2: Region Selection & Data Acquisition
- LCM: laser microdissection guided by histology annotation
- MALDI-MSI: raster acquisition at 10–100 µm spatial resolution
- Multiplex IF: multispectral imaging of stained tissue sections
- All coordinates recorded for downstream co-registration
Step 3: PTM Enrichment & MS Acquisition (LCM-MS)
- Protein digestion of isolated tissue regions
- PTM-specific enrichment (phospho, acetyl, glyco, etc.)
- nanoLC-MS/MS on Orbitrap or Q-TOF platforms
- DDA or DIA acquisition for deep coverage
Step 4: Data Processing & Spatial Reconstruction
- MALDI-MSI: spectral preprocessing, peak picking, ion image generation
- LCM-MS: database searching, PTM site localization, quantification
- Multiplex IF: image segmentation, cell classification, co-localization analysis
- Spatial map generation: PTM signal overlaid on histology image
Step 5: Bioinformatics & Interpretation
- Region-specific PTM quantification and differential analysis
- Cell-type deconvolution and spatial correlation
- Pathway enrichment by tissue region
- Publication-ready spatial maps, heatmaps, and statistical summaries
Sample Requirements for Spatial PTM Profiling
Sample preparation requirements vary by spatial profiling modality. Below are the recommended specifications for each approach.
| Modality |
Recommended Sample |
Minimum Tissue Area |
Fixation |
| LCM-MS |
FFPE or frozen sections |
1–10 mm² per region (≥ 10,000 cells) |
FFPE preferred for morphology; frozen for optimal PTM preservation |
| MALDI-MSI |
Frozen sections (preferred) or FFPE |
5–20 mm² per section |
Frozen sections recommended for PTM detection |
| Multiplex IF/IHC |
FFPE sections |
Standard slide (1–2 sections) |
FFPE with validated antibody protocols |
Note: For LCM-MS, a pilot H&E section is required for pathological annotation. Include matched control tissue for differential analysis. Ship all samples on dry ice with detailed metadata.
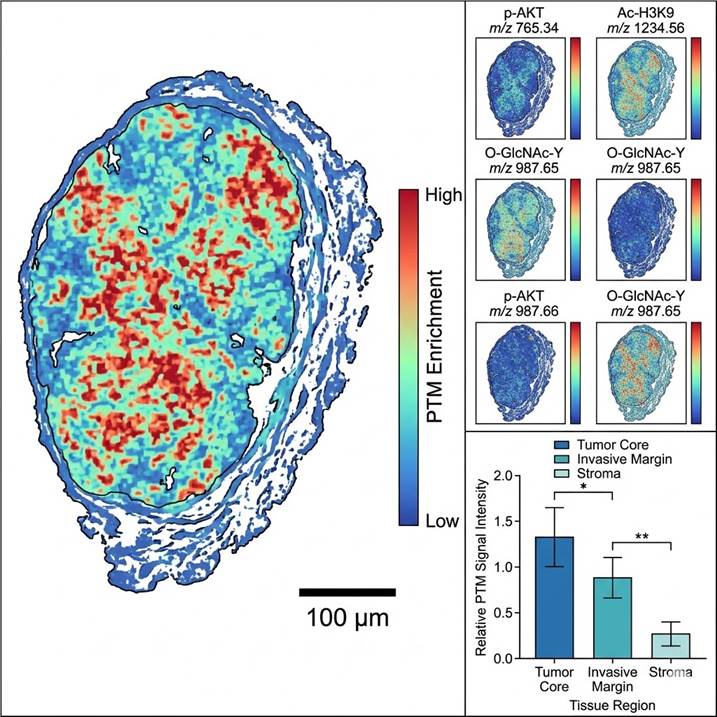
Demo: Example Spatial PTM Profiling Data
Below are representative results from spatial PTM profiling experiments. The workflow diagram illustrates the end-to-end pipeline from tissue section to spatial PTM map. The heatmap and bar chart show differential PTM enrichment across tumor core, invasive margin, and stromal regions within the same tissue section.
Case Study: Spatial Proteomics in Pancreatic Tumor Microenvironment
Background
Pancreatic ductal adenocarcinoma (PDAC) is characterized by extensive tumor heterogeneity and a complex microenvironment that drives therapy resistance. Understanding how protein expression and modification states vary across different tissue compartments within the same tumor is essential for identifying new therapeutic targets. In a 2024 study published in Nature Communications, Xu et al. developed the SCPro (Spatial and Cell-type Proteomics) platform to address this challenge at single-cell resolution.
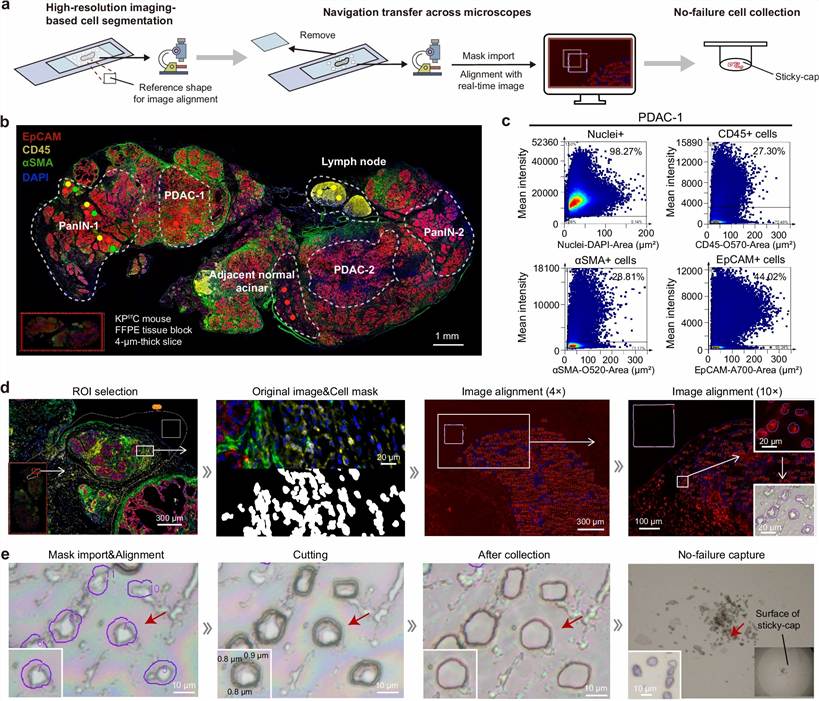
Methods
The SCPro platform integrates three complementary approaches: (1) multiplex immunofluorescence imaging for cell-type identification, (2) flow cytometry for cell sorting, and (3) laser capture microdissection coupled with ultrasensitive mass spectrometry using the i PAC (ion exchange-based protein aggregation capture) workflow. The i PAC method was specifically optimized to handle low-input samples from single tissue sections while effectively removing staining-induced contaminants. The team applied SCPro to a KPC mouse model of PDAC, analyzing tumor and adjacent normal tissue.
Results
The spatial proteomics analysis identified over 5,000 proteins across the PDAC tumor microenvironment, with clear spatial separation between tumor and stromal compartments. By integrating cell-type-specific proteomics from flow-sorted cells, the team enhanced spatial resolution and identified functionally distinct Treg cell subtypes — Klrg1+ and Tnfrsf18+ Tregs — that were spatially localized within the tumor microenvironment and associated with immunosuppressive functions. The spatial distribution of key signaling proteins and their modification states could be mapped directly onto tissue architecture (Xu et al., Nat. Commun., 2024).
Conclusion
This study demonstrates that spatial proteomics platforms can resolve cell-type-specific protein expression and modification patterns directly in tissue context — providing the type of spatially resolved data that is essential for understanding tumor biology and identifying region-specific biomarkers and therapeutic targets.
Source figure: Figure 3 from the original publication — Spatial proteomic landscape of the pancreatic tumor microenvironment. (View original article)
References
- Xu Y, Wang X, Li Y, et al. Multimodal single cell-resolved spatial proteomics reveal pancreatic tumor heterogeneity. Nat. Commun. 2024; 15:10100. DOI: 10.1038/s41467-024-54438-0
- Method of the Year 2024: spatial proteomics. Nat. Methods 2024; 21:2205. DOI: 10.1038/s41592-024-02565-3
- Lundberg E, Borner GHH. Spatial proteomics: a powerful discovery tool for cell biology. Nat. Rev. Mol. Cell Biol. 2019; 20:285–302. DOI: 10.1038/s41580-018-0094-y
Spatial PTM Profiling: Frequently Asked Questions
What is the difference between spatial PTM profiling and bulk PTM analysis?
Bulk PTM analysis homogenizes the entire sample, averaging modification signals across all cell types and tissue regions. Spatial PTM profiling preserves tissue architecture and maps modification states to specific anatomical locations. This allows you to detect region-specific modifications that would be diluted or lost in a bulk measurement — for example, a phosphorylation event confined to the tumor invasive margin or a glycosylation pattern specific to perivascular niches.
What types of PTMs can be mapped spatially?
All major PTM types are compatible with spatial profiling, provided an appropriate enrichment or detection strategy exists. Phosphorylation (phospho-Ser/Thr/Tyr), glycosylation (N-glycan, O-GlcNAc), acetylation (acetyl-Lys), methylation (methyl-Arg/Lys), and histone modifications have all been demonstrated in spatial workflows. The specific PTM coverage depends on the chosen modality: LCM-MS with antibody-based enrichment provides site-level resolution, MALDI-MSI offers broad discovery coverage, and multiplex IF provides targeted single-cell spatial data.
What sample types are compatible?
Both FFPE and frozen tissue sections are compatible. FFPE sections are preferred for morphology preservation and are suitable for multiplex IF/IHC and LCM-MS workflows. Frozen sections are recommended for MALDI-MSI and for PTM types that are sensitive to formalin fixation. Tissue microarrays, core biopsies, and surgical resections can all be accommodated.
What spatial resolution can be achieved?
Spatial resolution varies by modality. LCM-MS can isolate regions as small as 10–50 µm in diameter. MALDI-MSI typically operates at 10–100 µm pixel size. Multiplex IF provides sub-micron resolution at the single-cell level. The choice of resolution depends on the biological question.
How do you correlate PTM data with tissue morphology?
For all three modalities, a matched H&E-stained section is used for pathological annotation. LCM-MS uses the H&E to guide microdissection. MALDI-MSI data can be computationally co-registered with H&E images. Multiplex IF inherently provides morphological context. Our reports include overlay images showing PTM distribution on the corresponding histology.
Can I combine spatial PTM profiling with transcriptomics or other modalities?
Yes. Our spatial PTM platform is designed for multi-omic integration. LCM-captured material can be split for parallel proteomics and transcriptomics analysis. MALDI-MSI data can be registered with spatial transcriptomics datasets. Multiplex IF panels can include both PTM-specific and cell-type marker antibodies. We offer consultative project design to determine the best multi-modal strategy for your research question.