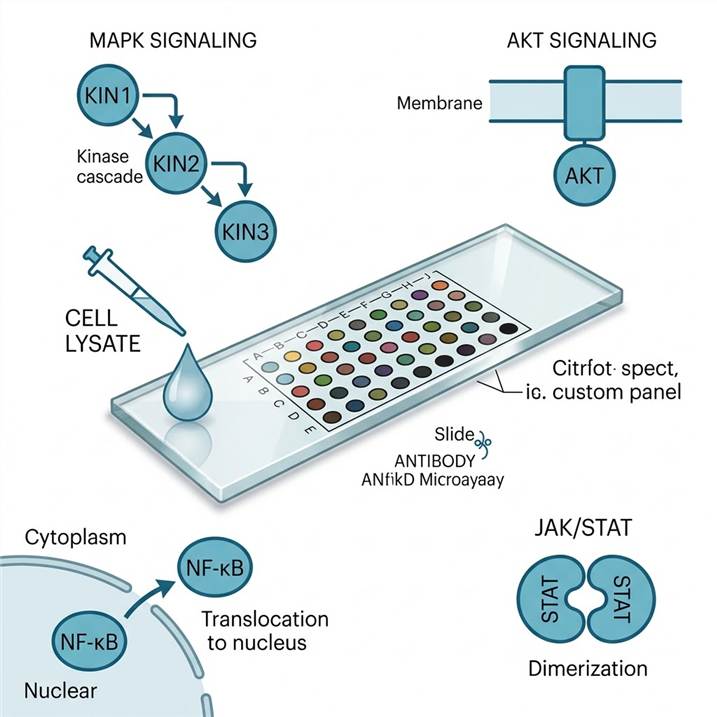
Pathway Coverage: What Targets Can We Profile?
Our phospho-signaling antibody arrays are built from carefully validated phospho-specific antibodies printed on glass slide or membrane supports. Each array uses a sandwich format: capture antibodies specific to a phosphorylated epitope are immobilized on the surface, and biotinylated detection antibodies enable chemiluminescent or fluorescent readout. The result is a quantitative profile of pathway activation states from a single lysate aliquot.
Below are the major pathway modules available. Arrays can be configured to cover one focused pathway or provide broad-spectrum coverage across multiple cascades.
MAPK / ERK Pathway
- ERK1/2 (T202/Y204), MEK1/2 (S217/S221), p38 (T180/Y182), JNK (T183/Y185)
- RSK1/2/3, MSK1/2, MNK1, c-Jun (S63), ATF-2 (T71), ELK-1 (S383)
PI3K / AKT / mTOR Pathway
- AKT1/2/3 (S473, T308), PTEN, GSK-3α/β (S21/S9), mTOR (S2448)
- p70S6K (T389), 4E-BP1 (T37/46), PRAS40, TSC2, PDK1 (S241)
JAK / STAT Pathway
- STAT1 (Y701), STAT3 (Y705, S727), STAT5 (Y694), STAT6 (Y641)
- JAK1 (Y1022/1023), JAK2 (Y1007/1008), TYK2 (Y1054/1055)
NF-κB Pathway
- NF-κB p65 (S536), IκBα (S32/36), IKKα/β (S176/180), NIK (T559)
RTK Signaling Nodes
- EGFR (Y1068, Y1173), ErbB2/HER2 (Y1248), IGF-1R (Y1135/Y1136), InsR (Y1158/Y1162/Y1163)
- PDGFRα (Y754), PDGFRβ (Y1021), VEGFR2 (Y1175), FGFR1 (Y653/Y654), c-Met/HGFR (Y1230/Y1234/Y1235)
Stress & Cell Cycle Regulators
- p53 (S15, S46, S392), Chk1 (S345), Chk2 (T68), HSP27 (S78/S82), c-Jun (S73)
- CREB (S133), β-Catenin (S33/S37/T41), Smad2 (S465/S467), Smad3 (S423/S425)
Custom array configurations are also available — select a target panel matching your specific pathway of interest. For deeper analysis of kinase-substrate connections, the data can be integrated with our kinase-substrate network analysis service.
Applications: Drug Response, Target Engagement & Pathway Activation
The phospho-signaling antibody array is designed for researchers who need a rapid, multiplexed readout of pathway activation states. Three application areas dominate its use.
Kinase Inhibitor Screening & Selectivity Profiling
When a kinase inhibitor enters your pipeline, the first question is not just whether it hits its target — but which off-target pathways it may activate or suppress. A broad-spectrum phospho-antibody array allows you to profile dozens of kinases and their downstream substrates simultaneously, generating a selectivity fingerprint in a single experiment. This is particularly valuable during lead optimization, where you need to compare compound series across multiple time points and concentrations.
Drug Target Engagement & Mechanism-of-Action
For both preclinical tool compounds and clinical candidates, confirming that a drug engages its intended pathway is a critical go/no-go gate. By comparing phospho-profiles between treated and untreated samples, you can immediately identify which nodes in a signaling cascade are modulated — at the intended target, along compensatory pathways, or at downstream effectors. This information directly supports mechanism-of-action claims in manuscripts and regulatory filings, and can be complemented with parallel kinase activity profiling for orthogonal validation.
Pathway Activation Mapping in Disease Models
In academic research, the most common question is: which pathway is activated in my model system? Whether you stimulate cells with cytokines, growth factors, or stress inducers — or compare patient-derived samples to healthy controls — the antibody array provides a systems-level view of phosphorylation changes without requiring deep bioinformatics expertise or expensive MS instrumentation.
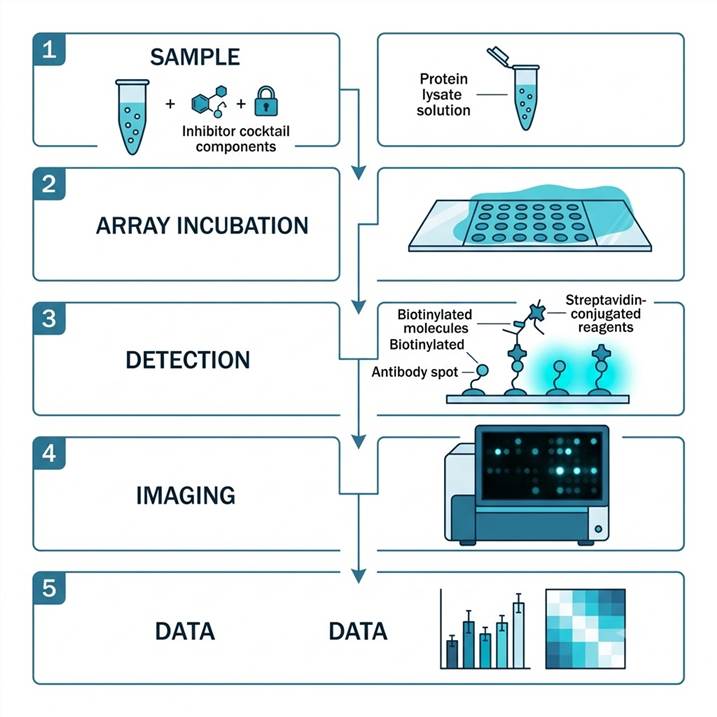
Workflow: From Sample to Multiplex Phosphorylation Data
Our service follows a streamlined five-step protocol. Total turnaround time is typically 10–15 business days from sample receipt to final report.
Step 1: Sample Submission
- Cell lysates, tissue homogenates, or biopsy lysates
- Minimum 100–500 µg total protein per array (varies by array format)
- Samples should be prepared with phosphatase and protease inhibitor cocktails
- Protein concentration confirmed by BCA assay before array loading
Step 2: Array Blocking & Incubation
- Glass slide or membrane arrays are blocked with proprietary buffer
- Sample lysates diluted to optimal protein concentration and incubated on arrays
- Capture antibodies on the array surface bind target phospho-proteins
- Incubation: 1–2 hours at room temperature or overnight at 4 °C
Step 3: Detection Antibody & Signal Amplification
- Arrays washed to remove unbound proteins
- Biotinylated detection antibody cocktail applied
- Streptavidin-conjugated fluorophore or HRP added for signal amplification
- Chemiluminescent or fluorescent signal developed
Step 4: Imaging & Quantification
- Arrays imaged using a chemiluminescence imager or fluorescence scanner
- Spot intensity quantified using dedicated array analysis software
- Background subtraction and normalization to internal controls
- Phospho-specific signal expressed as relative intensity or fold-change vs control
Step 5: Data Report & Pathway Interpretation
- Signal intensity table for all targets across all samples
- Fold-change heatmaps and pathway activation maps
- Differential phosphorylation analysis between experimental groups
- Publication-ready figures: bar charts, heatmaps, pathway diagrams
Sample Requirements for Phospho-Signaling Antibody Array
Sample preparation is critical for reliable phospho-array data. Below are the recommended amounts and handling conditions for common sample types.
| Sample Type |
Recommended Amount |
Buffer & Additives |
Special Considerations |
| Cell lysates (adherent or suspension) |
100–500 µg total protein per array |
RIPA or NP-40 lysis buffer + protease/phosphatase inhibitors |
Harvest at 70–80% confluency; include starved vs stimulated controls |
| Tissue homogenates |
200–500 µg total protein |
Tissue lysis buffer + inhibitor cocktails |
Homogenize immediately after collection; snap-freeze in liquid N₂ |
| Tumor biopsy lysates |
50–200 µg (minimum 5–10 mg tissue) |
As above; bead-beating may be needed |
Limited material qualifies for focused mini-arrays only |
Note: Include matched untreated controls (vehicle or untreated lysate) for all treatment experiments. Two or more biological replicates are recommended for statistical analysis. Ship samples on dry ice with full metadata.
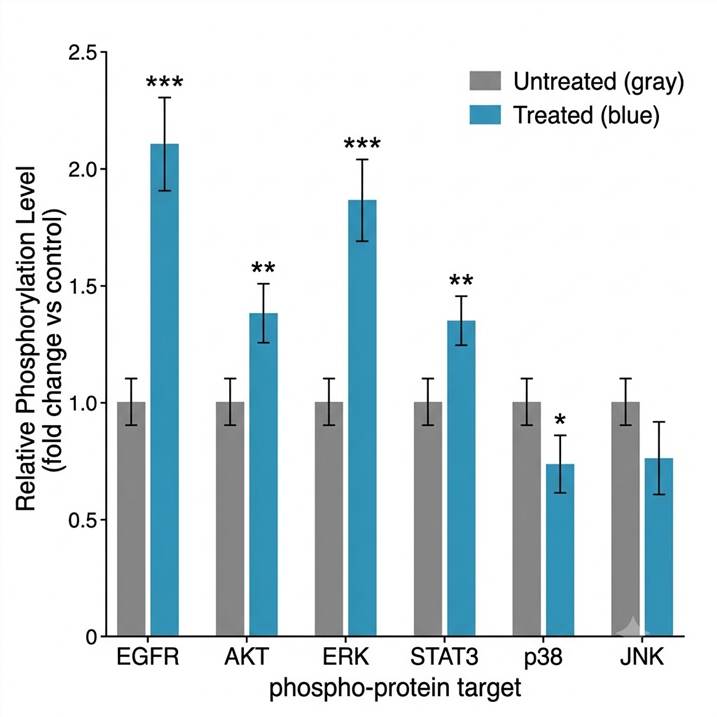
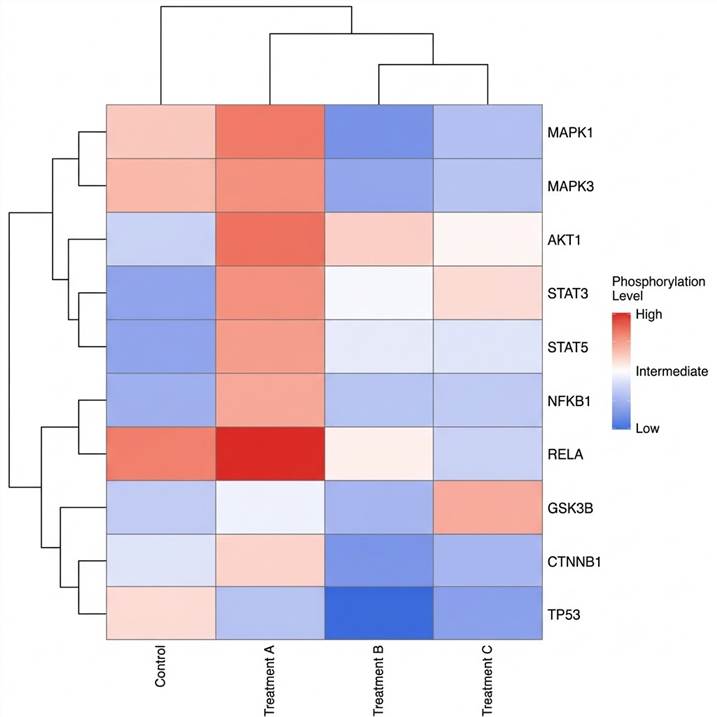
Demo: Example Phosphorylation Profiling Data
Below are representative data visualizations from a typical phospho-signaling antibody array experiment. The bar chart compares phosphorylation levels of key RTK targets between untreated and drug-treated cell lysates, while the heatmap provides a global view of phosphorylation changes across multiple pathways and conditions.
Antibody Array vs. Standard Phosphoproteomics: Choosing the Right Approach
Researchers often ask whether an antibody array or MS-based phosphoproteomics is the better choice. The answer depends on your experimental objective. The table below summarizes the key trade-offs.
| Dimension |
Phospho-Signaling Antibody Array |
MS-Based Phosphoproteomics |
| Discovery breadth |
Known targets only (50–300 predefined antibodies) |
Unbiased — thousands of phosphosites identified |
| Sample input |
100–500 µg total protein |
1–5 mg total protein (with enrichment) |
| Turnaround time |
1.5–2 weeks |
3–6 weeks |
| Phospho vs total ratio |
Built-in (phospho + total antibodies available) |
Requires spike-in or global normalization |
| Site-specific resolution |
Determined by antibody specificity (known epitopes) |
Single-amino-acid resolution for each identified site |
| Bioinformatics requirement |
Minimal (spot quantification software) |
Advanced (FDR control, localization scoring, pathway mapping) |
| Cost per sample |
Low to moderate |
Higher (enrichment + long MS gradients) |
| Best suited for |
Hypothesis generation, pathway screening, target engagement |
Deep discovery, novel site identification, global phospho-landscape |
Strategic recommendation: Use the antibody array as a rapid screening tool to identify which pathways are modulated in your system. The prioritized targets can then be validated and explored in depth using targeted MS or full-scale phosphoproteomics. For broader PTM screening beyond phosphorylation, our PTM antibody array profiling service extends this approach to other modification types, supported by our PTMs in drug discovery platform.
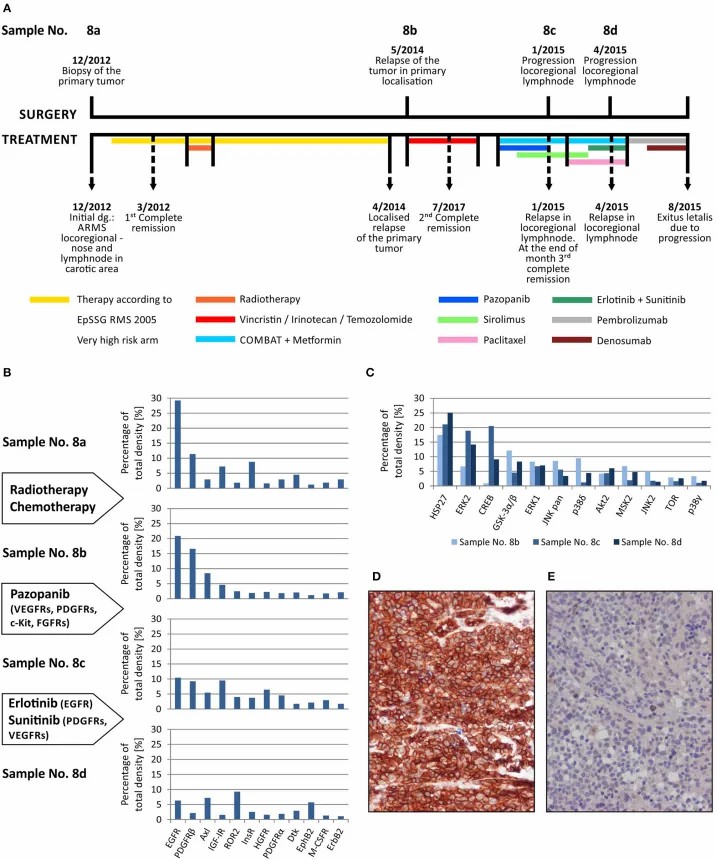
Case Study: Phospho-Array Guided Kinase Inhibitor Target Screening in Pediatric Solid Tumors
Background
Pediatric solid tumors often harbor aberrantly activated receptor tyrosine kinase (RTK) signaling, yet the specific pathways driving individual tumors are heterogeneous. In a 2019 study published in Frontiers in Oncology, Neradil et al. applied commercial phospho-protein antibody arrays to profile the phosphorylation landscape of 19 pediatric solid tumor samples, aiming to identify clinically actionable kinase targets for each patient.
Methods
The team used two complementary array formats: a human phospho-RTK array (covering 49 RTKs) and a human phospho-MAPK array (covering 24 MAPK pathway targets). Tumor lysates from surgical biopsies or resection specimens were incubated on membrane-based antibody arrays. Phosphorylation signals were detected by chemiluminescence and quantified by pixel density analysis. Selected findings were validated by immunohistochemistry (IHC) on parallel tissue sections.
Results
The arrays revealed distinct RTK and MAPK phosphorylation patterns across tumor types. A particularly illustrative case (Patient 8, alveolar rhabdomyosarcoma) was followed longitudinally across four consecutive biopsies: primary tumor, relapse, and two lymph node metastases over a 26-month clinical course. Phospho-array profiling demonstrated dynamic changes in RTK activation states under sequential treatment with pazopanib, erlotinib, and sunitinib. For example, phosphorylated PDGFRβ was elevated in the primary tumor and relapse samples but decreased in later metastases, while phosphorylated EGFR levels increased after erlotinib treatment, suggesting a compensatory activation mechanism. Across the patient cohort, cluster analysis based on RTK phosphorylation patterns clearly separated neuroblastoma from central nervous system tumors, indicating tumor-type-specific signaling signatures (Neradil et al., Front. Oncol., 2019).
Conclusion
This study demonstrates that phospho-antibody arrays can identify patient-specific kinase activation profiles and track signaling changes under therapy — precisely the type of data that supports kinase inhibitor selection and mechanism-of-action studies in both clinical and preclinical settings.
Source figure: Figure 4 from the original publication — Sequential phospho-RTK analysis of alveolar rhabdomyosarcoma across disease progression and treatment. (View original article)
References
- Neradil J, Kyr M, Polaskova K, et al. Phospho-Protein Arrays as Effective Tools for Screening Possible Targets for Kinase Inhibitors and Their Use in Precision Pediatric Oncology. Front. Oncol. 2019; 9:930. DOI: 10.3389/fonc.2019.00930
- Wang N, Zhang L, Ying Q, et al. A reverse phase protein array based phospho-antibody characterization approach and its applicability for clinical derived tissue specimens. Sci. Rep. 2022; 12:22149. DOI: 10.1038/s41598-022-26715-9
- "Kinase inhibition profiles as a tool to identify kinases for specific..." Nat. Commun. 2020; 11:1688. DOI: 10.1038/s41467-020-15428-0
Phospho-Signaling Antibody Array: Frequently Asked Questions
How many phosphorylation targets can be detected simultaneously?
Depending on the array format, between 50 and 300+ phospho-specific targets can be profiled from a single sample. Focused pathway arrays (e.g., MAPK-only or AKT-only) typically include 15–30 targets, while broad-spectrum arrays cover 5–10 interconnected signaling cascades simultaneously. The exact target list is provided before project initiation so you can confirm coverage of your pathways of interest.
How much protein sample is required?
Standard arrays require 100–500 µg total protein per array, depending on the array format and number of targets. Cell lysates at the lower end of this range (100–200 µg) are usually sufficient for arrays covering 50–100 targets. For broad-spectrum arrays with 250+ targets, we recommend 300–500 µg. If sample is limited, we offer focused mini-array formats requiring as little as 50 µg.
How do you distinguish phosphorylated from non-phosphorylated proteins?
Each target on the array is detected using a phospho-specific antibody that recognizes the protein only when a particular residue (e.g., AKT S473) is phosphorylated. Many arrays also include a matching total-protein antibody for the same target, allowing calculation of a phospho/total ratio. This ratio normalizes for protein abundance differences and provides a more accurate measure of pathway activation state than phospho-signal alone.
What is the turnaround time?
Standard turnaround is 10–15 business days from sample receipt to delivery of the final report. This includes array incubation, detection, imaging, quantification, and data interpretation. Urgent projects can be accommodated with expedited processing upon request.
Can I use the array for tissue samples or only cell lysates?
Both cell lysates and tissue homogenates are compatible. Tissue samples should be snap-frozen immediately after collection and homogenized in lysis buffer containing protease and phosphatase inhibitors. Tumor biopsies (needle or surgical) can also be used, though the minimum protein yield should be confirmed before committing to a specific array format. We recommend a pilot protein quantification step for limited tissue samples.
How does this service differ from MS-based phosphoproteomics?
The antibody array provides a targeted readout of predefined phosphorylation sites using validated antibodies, whereas MS-based phosphoproteomics discovers phosphosites without prior knowledge. The array is ideal for hypothesis generation, pathway screening, and target engagement studies where you know which pathways to monitor. MS phosphoproteomics is better suited for unbiased discovery, novel site identification, and comprehensive phospho-landscape mapping. The two approaches are complementary: we recommend starting with the array for rapid screening and following up with targeted MS validation using our phosphopeptide enrichment service for the most interesting hits.