Antibody Glycosylation: A Critical Quality Attribute in Therapeutic Antibody Development
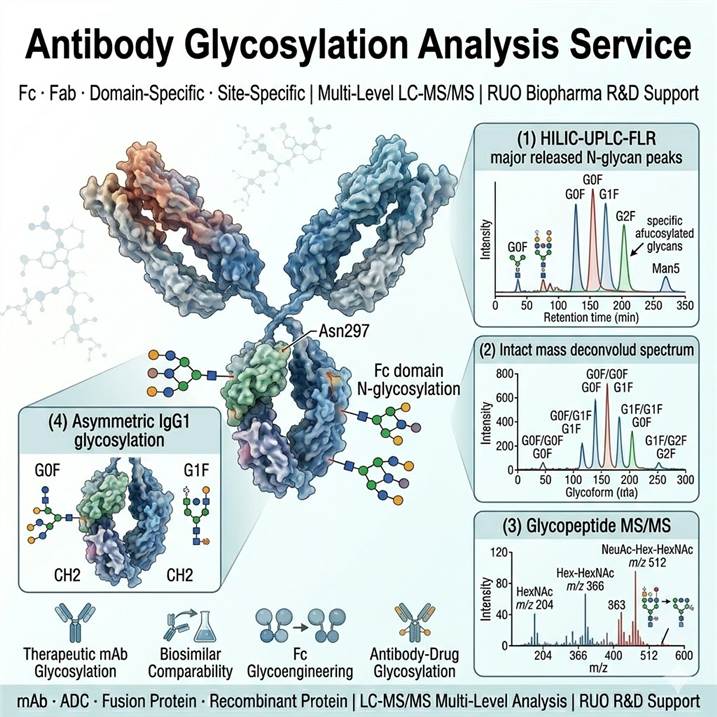
Therapeutic monoclonal antibodies (mAbs) and Fc-fusion proteins represent the largest class of biopharmaceuticals, and their glycosylation profiles are among the most consequential critical quality attributes (CQAs) governing clinical performance. The conserved N-glycosylation site at Asn297 in the IgG Fc domain hosts a defined repertoire of biantennary complex-type glycans whose composition — particularly the presence or absence of core fucose, terminal galactose, sialic acid, and high-mannose structures — directly modulates binding affinity to Fcγ receptors (FcγRIIIA, FcγRIIB), C1q complement protein, and the neonatal Fc receptor (FcRn). Afucosylated glycans enhance ADCC up to 50-fold; high-mannose species accelerate clearance; and asymmetric glycosylation — where the two Fc chains carry different glycans — has emerged as a universal feature of IgG1 antibodies with previously unrecognized functional consequences for immune complex signaling. For biosimilar developers, glycosylation comparability to the originator product is a regulatory expectation under ICH Q5E guidelines. Yet glycosylation analysis remains analytically challenging: glycan structural diversity exceeds 40 species per antibody, site-specific heterogeneity requires peptide-level resolution, and intact mass profiling demands high-resolution instrumentation to resolve the >100 Da differences between adjacent glycoforms. Our antibody glycosylation analysis service provides the multi-level LC-MS/MS platform to address these challenges across the entire biopharma R&D pipeline — from lead candidate glycan screening through clone selection, process development, and biosimilar comparability — all within RUO non-GMP workflows.
Antibody Glycosylation Analysis Service Portfolio
Our service portfolio covers the complete spectrum of antibody glycosylation characterization needs, from high-throughput intact mass screening to in-depth glycan structural elucidation. Each analytical module is available independently or as part of an integrated characterization package tailored to the product modality and development stage.
| Service Module |
Description |
Key Deliverables |
| Released N-Glycan Profiling |
Enzymatic N-glycan release (PNGase F), fluorescent labeling (2-AB / procainamide / Rapifluor), and HILIC-UPLC-FLR-MS analysis with glucose unit-based glycan identification and relative quantitation |
Glycan chromatogram with >30 annotated glycan species (G0F, G1F, G2F, Man5, Man6, afucosylated, sialylated), relative % peak areas, GU values, structural assignments based on exoglycosidase digestions where required |
| Glycopeptide-Based Site-Specific Glycosylation Analysis |
Tryptic or multi-protease digestion followed by nanoLC-MS/MS glycopeptide analysis (HCD/EThcD fragmentation) for site-specific glycan identification and occupancy quantitation at each individual N-glycosylation site |
Site-specific glycan profiles for each N-glycosylation site (Fc Asn297, Fab glycosylation sites), relative occupancy of each glycan composition per site, extracted ion chromatograms for targeted glycoforms |
| Intact Mass Glycoform Profiling |
Denaturing or native intact mass analysis on Orbitrap or Q-TOF MS with automated deconvolution (MaxEnt, BioConfirm) for global glycoform distribution and overall mass heterogeneity assessment |
Deconvoluted intact mass spectrum with annotated glycoform peaks, calculated average mass, glycoform distribution histogram, batch-to-batch overlay comparison |
| Subunit-Level Glycosylation Analysis (Middle-Up) |
IdeS/IdeZ limited digestion of IgG into F(ab')2 and Fc/2 fragments, followed by LC-HRMS analysis for domain-resolved glycosylation — resolving Fc from Fab glycan contributions |
Domain-specific (Fc vs Fab) glycoform spectra, relative quantitation of Fc and Fab glycosylation, detection of Fab glycans that are obscured in intact mass analysis |
| Glycan Structural Characterization |
Sequential exoglycosidase digestion array (sialidase, galactosidase, fucosidase, hexosaminidase, mannosidase) combined with LC-MS for linkage and branching assignment; MS/MS with HCD/EThcD for structural confirmation |
Exoglycosidase sequencing traces, linkage confirmation of key glycan species (core-fucosylated, afucosylated, hybrid, high-mannose), sialic acid linkage (α2-3 vs α2-6) determination |
| Biosimilar Glycosylation Comparability |
Side-by-side glycosylation profiling of biosimilar candidate vs originator product at released glycan, glycopeptide, and intact mass levels, with statistical assessment of glycan attribute differences |
Comparative glycan overlay plots, difference bar charts with ±SD, PCA score plot for multivariate comparison, CQA classification of glycan attributes, similarity assessment per ICH Q5E framework |
| Fc Glycoengineering Characterization |
Targeted glycosylation analysis for engineered antibodies with modified glycan profiles, including afucosylated (ADCC-enhanced), high-sialylated (anti-inflammatory), and homogeneous glycoform variants |
Quantitative assessment of target glycan enrichment (e.g., % afucosylation, % sialylation), host cell line glycoengineering impact, glycan profile consistency across production batches |
| Forced Degradation Glycosylation Monitoring |
Time-course glycosylation profiling under thermal (40°C), oxidative (H₂O₂), and photostress (ICH Q1B) conditions to assess glycan stability, deamidation kinetics, and glycation formation |
Glycan stability time-course plots, deamidation and oxidation occupancy at glycosylation-rich regions, glycation level assessment, degradation rate constants for stability modeling |
For ADC-specific glycosylation and drug-to-antibody ratio characterization, see our ADC / Fusion Protein PTM Analysis service. For comprehensive glycosylation characterization including O-glycan analysis and multi-isotype antibody profiling, our Glycoproteomics Analysis Services platform provides extended analytical capabilities.
Multi-Level LC-MS/MS Platform for Antibody Glycosylation Analysis
Our antibody glycosylation analysis platform operates at three complementary analytical levels — intact mass, subunit (middle-up/middle-down), and glycopeptide (bottom-up) — each providing distinct information across the glycosylation characterization hierarchy. The choice of analytical depth is guided by the specific questions at hand: rapid glycan profiling for early-stage screening vs comprehensive site-specific characterization for CQA assessment.
Level 1: Intact Mass Glycoform Profiling
Intact antibody mass analysis by high-resolution MS (Orbitrap Eclipse, Q-TOF) under denaturing or native conditions provides a global snapshot of the complete glycoform distribution in a single rapid measurement. Deconvolution of the raw mass spectrum resolves the major glycoform peaks, each separated by the mass differences of common glycan compositions (e.g., G0F → G1F = +162 Da for one galactose, G0F → G0 = -146 Da for core fucose loss). For reduced or deglycosylated heavy chain analysis, the mass resolution is sufficient to distinguish G0F from G1F/G0F+Man5, providing semi-quantitative glycan distribution data within hours of sample receipt. This approach is ideally suited for clone selection screening, process development monitoring, and batch-to-batch consistency assessment where throughput is prioritized over site-specific resolution.
Level 2: Subunit (Middle-Up) Domain-Specific Glycosylation Analysis
Limited digestion with immunoglobulin-degrading enzymes (IdeS, IdeZ, or alternative proteases for non-IgG formats) cleaves antibodies at defined sites below the hinge region, producing F(ab')2 and Fc/2 fragments for LC-HRMS analysis. This middle-up strategy resolves the complex Fc glycoform distribution from potential Fab glycosylation, which is increasingly recognized as prevalent in therapeutic antibodies (~15–25% of approved mAbs carry Fab N-glycosylation sites). Domain-specific analysis reveals whether observed glycan heterogeneity originates from the Fc or Fab regions, providing critical information for CQA attribution and product understanding. For asymmetric glycosylation analysis — where the two Fc heavy chains carry different glycans — the middle-up reduced mass approach preserves the paired glycan information that is lost in conventional peptide mapping, enabling direct detection of monofucosylated, monosialylated, and other asymmetric glycoforms as recently highlighted by WIgGWAM methodology. Our Middle-Down MS-Based PTM Analysis service provides extended capabilities for larger middle-down fragments with higher sequence coverage than standard middle-up approaches.
Level 3: Glycopeptide-Level Site-Specific Analysis
Tryptic or multi-protease digestion followed by nanoLC-MS/MS glycopeptide analysis delivers the highest-resolution information: individual glycan compositions at each specific N-glycosylation site, with relative quantitation of all detected glycoforms per site. Our glycopeptide workflow employs HCD fragmentation (stepped collision energy, 15–45% NCE) for detection of both glycan oxonium ions (m/z 204.09 HexNAc, m/z 366.14 Hex-HexNAc, m/z 512.20 NeuAc-Hex-HexNAc) and peptide backbone fragments for glycosylation site localization. EThcD (electron transfer higher-energy collision dissociation) is used where unambiguous assignment of the glycosylation site is required, particularly for Fab glycans or non-consensus motif glycosylation. For targeted high-throughput quantification of defined glycoforms at specific sites, we offer PRM-based PTM Verification with isotope-labeled glycopeptide internal standards, achieving CVs <10% across analytical replicates. Glycopeptide data are processed using Byonic, Protein Metrics (PMI-Byos), and GPMAW platforms for comprehensive glycan identification and quantitation.
Complementary: Released N-Glycan Analysis by HILIC-UPLC-FLR-MS
For detailed glycan structural characterization independent of peptide context, N-glycans are enzymatically released with PNGase F, fluorescently labeled (2-AB, procainamide, or Rapifluor-MS), and analyzed by HILIC-UPLC coupled with fluorescence detection and online MS. Glycan structures are assigned based on glucose unit (GU) values against a dextran ladder reference, complemented by exoglycosidase digestion arrays for linkage and branching confirmation. This approach is the established standard for pharmacopoeial glycan profiling (Ph. Eur. 2.2.44) and provides the quantitative glycan inventory required for biosimilar glycan comparability submissions. Our HILIC-based Glycan Analysis platform delivers >30 annotated glycan species per run with automated GU matching and structural library searching.
Antibody Glycosylation Analysis Workflow
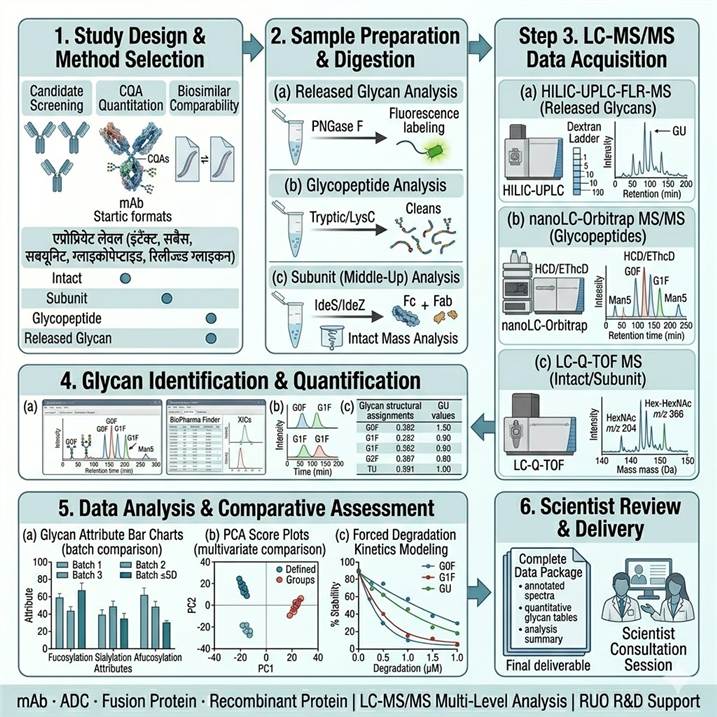
Step 1: Study Design and Method Selection
Define analytical objectives (discovery screening vs CQA quantitation), select appropriate analytical level(s) — intact mass profiling, subunit analysis, glycopeptide mapping, released glycan analysis, or integrated multi-level characterization. Determine sample requirements: ≥100 µg purified antibody per condition for comprehensive glycopeptide analysis; ≥10 µg for intact mass profiling. Confirm product modality (IgG1/2/4, Fc-fusion, bispecific) and assess for potential Fab glycosylation sites.
Step 2: Sample Preparation and Digestion
Protein quantification and buffer exchange. For released glycan analysis: denaturation, PNGase F digestion (37°C, 18 h), glycan purification by HILIC SPE, fluorescent labeling. For glycopeptide analysis: reduction, alkylation, trypsin or multi-protease digestion (37°C, 16 h). For subunit analysis: IdeS/IdeZ digestion (37°C, 30 min). For intact mass: desalting by C4 or C8 trap列.
Step 3: LC-MS/MS Data Acquisition
Intact/subunit: PLRP-S reversed-phase column (50°C), Orbitrap Eclipse or Q-TOF (120K resolution for intact, 60K for subunit). Glycopeptide: nanoLC (C18, 300 nL/min), Orbitrap (120K MS1, 30K MS2, HCD stepped NCE 20/30/40%). Released glycan: HILIC-UPLC (BEH Glycan column, 60°C), FLR (ex/em 330/420 nm), Q-TOF MS. All runs include system suitability standards and QC reference samples.
Step 4: Glycan Identification and Quantification
Intact mass deconvolution by MaxEnt or BioConfirm with automated glycoform assignment. Glycopeptide data processing: Byonic (PEG 0–50 ppm, glycan DB 309–500 compositions) with FDR <1% at peptide and glycan level. Released glycan: automated GU matching against dextran ladder + structural library. Site occupancy calculated from extracted ion chromatograms (XICs) of glycosylated vs non-glycosylated peptide pairs.
Step 5: Data Analysis and Comparative Assessment
Statistical analysis of glycan attribute differences across conditions (t-test, ANOVA, PCA for multivariate comparison). Biosimilar comparability: similarity factor calculation, equivalence margin testing for individual glycan species. Forced degradation: kinetic modeling of glycan stability (first-order rate constants, Arrhenius predictions). Automated report generation with annotated glycan profiles and attribute summary tables.
Step 6: Scientist Review and Delivery
Results interpretation session with senior analytical scientists. Comprehensive data package including raw spectra (XIC, MS1, MS2), annotated glycan tables with relative quantitation, comparative statistical analysis, and study report with methods, results, and interpretation in the context of the product development program.
Antibody Glycosylation Analysis Across the Biopharmaceutical Development Lifecycle
Glycosylation characterization requirements evolve across the therapeutic antibody development pipeline, from early discovery through preclinical development and biosimilar comparability. Our service adapts the analytical depth, throughput, and reporting format to the specific stage and decision-making needs of each program.
Early Discovery: Lead Candidate Glycan Screening
During lead selection and optimization, rapid glycosylation profiling provides critical developability information before investment in advanced characterization. Our early-stage screening workflow deploys intact mass profiling and subunit-level analysis across multiple candidates in parallel, delivering glycoform distribution data within 3–5 business days per candidate set. Key outputs include: afucosylation level (ADCC predictor), high-mannose content (clearance risk), galactosylation and sialylation levels (CDC potential), and Fab glycosylation detection (immunogenicity and binding risk). This information feeds directly into candidate selection decisions, helping teams prioritize molecules with favorable glycosylation profiles for development. For discovery-stage PTM assessment beyond glycosylation, our PTM Qualitative Analysis service provides broad PTM screening capabilities.
Process Development: Glycosylation Monitoring and Control
Cell culture conditions — media composition, feeding strategy, dissolved oxygen, temperature shift, harvest timing — all significantly impact antibody glycosylation. Our process development glycosylation characterization service provides the analytical bandwidth to support design-of-experiment (DoE) optimization studies and clone selection programs. The high-throughput released glycan workflow (96-well plate format, automated sample preparation) can process 50–100 samples per week for glycan profiling, with targeted glycopeptide-level follow-up on selected conditions. Process-relevant glycosylation attributes monitored include: N-glycan site occupancy under different culture conditions; nucleotide sugar precursor feeding effects on glycan branching and sialylation; temperature shift and harvest time effects on high-mannose and afucosylation levels; and media supplement (galactose, manganese, uridine) effects on galactosylation. For host cell glycosylation profiling across expression systems, see our Bacterial Glycosylation Analysis, Insect Cell Glycosylation Analysis, and Yeast Glycosylation Analysis services.
Biosimilar Development: Glycosylation Comparability
Glycosylation similarity to the originator product is a cornerstone of biosimilar development, directly impacting the demonstration of comparable pharmacokinetics, pharmacodynamics, and immunogenicity. Our biosimilar glycosylation comparability workflow follows the ICH Q5E framework, incorporating: side-by-side analysis at all three analytical levels (intact mass, subunit, glycopeptide/released glycan); statistical equivalence testing for each quantified glycan species with pre-defined similarity margins; forced degradation glycosylation stability comparison under thermal, photostress, and oxidative conditions; and comprehensive reporting formatted for regulatory submission support. Our statistical approach extends beyond simple mean comparison to multivariate similarity assessment (PCA, Minkowski distance) that captures the full glycan profile similarity rather than individual glycan species in isolation. For comprehensive biosimilar assessment including non-glycan PTMs, our Protein Drug PTM Mapping service adds deamidation, oxidation, and isomerization profiling to the comparability package.
Glycoengineering: Fc Function Optimization
For programs pursuing glycoengineered antibodies with enhanced or altered Fc function — afucosylated for ADCC enhancement (e.g., Potelligent, GlymaxX, FUT8 knockout CHO platforms), high-sialylated for anti-inflammatory activity, or homogeneous glycoform antibodies — specialized analytical workflows are required to confirm the intended glycan profile and monitor undesired glycan variants. Our glycoengineering characterization service provides: quantitative verification of target glycan enrichment (% afucosylation, % sialylation, % specific glycoform); detection and quantitation of non-target glycan variants down to 0.1% of total glycans; host cell line glycoengineering impact assessment on endogenous glycan processing pathways; and stability monitoring of engineered glycan profiles under formulation and stress conditions. For engineering programs involving novel expression hosts, our Site-Specific Glycosylation Analysis service provides the site-level resolution needed to confirm proper glycosylation at each engineered glycosylation site.
For broader applications in PTM-driven drug discovery and development, explore our PTMs in Drug Discovery and Development platform.
Case Study: WIgGWAM Intact LC/MS Reveals Asymmetric IgG1 Glycosylation Is Universal and Drives Dengue Disease Severity
A landmark 2025 study by Azzam et al. published in Nature Communications applied an innovative intact LC/MS method — WIgGWAM (Whole Immunoglobulin Glycoprofiling With Asymmetrical Monitoring) — to demonstrate that asymmetrically glycosylated IgG1 antibodies are universal across healthy individuals and disease cohorts, and that asymmetric monofucosylation, not symmetric afucosylation, drives FcγRIIIA binding and dengue disease severity.
Background: Antibody glycosylation at the conserved Fc Asn297 site has been studied for decades using released glycan analysis and glycopeptide LC-MS/MS, both of which average the glycan information across the two Fc heavy chains. This conventional approach implicitly assumes symmetric glycosylation — both Fc chains carrying identical glycans — and cannot distinguish between antibodies with one vs two copies of a given glycan. The question of asymmetric glycosylation — where the two Fc chains carry different glycans — remained unresolved due to the absence of analytical methods that preserve native Fc chain pairing information.
Approach: Azzam and colleagues developed the WIgGWAM method, which combines limited reduction of intact IgG1 under non-denaturing conditions with LC/MS analysis that preserves the spatial pairing of the two Asn297-linked glycans on the Fc homodimer. The method resolves IgG1 molecules into three populations: symmetrically glycosylated (both Fc chains carry identical glycans, ~40%), asymmetrically monoglycosylated (one chain glycosylated, one chain unoccupied, <2%), and asymmetrically biglycosylated (both Fc chains glycosylated but with different glycans, ~58%). The team applied WIgGWAM to IgG1 from healthy donors (n=40), COVID-19 patients, and a well-characterized dengue cohort (n=~300) with known disease severity outcomes.
Key Findings:
- Asymmetric glycosylation is a universal feature of human IgG1 — ~60% of all IgG1 antibodies carry different glycans on the two Fc chains, independent of donor age, sex, or health status
- The previously reported association between IgG afucosylation and severe dengue disease is driven by asymmetric monofucosylation (one Fc chain fucosylated, the other not) — not symmetric dfucosylation of both chains — redefining our understanding of a widely cited disease mechanism
- Engineered monofucosylated IgG1 antibodies are functionally indistinguishable from fully afucosylated IgG1 in FcγRIIIA binding affinity and ADCC activity, revealing that a single fucose-deficient Fc chain is sufficient for maximal effector function enhancement
- Asymmetric glycosylation is regulated by B-cell differentiation pathways: T-cell-dependent activation (CD40L signaling) increases asymmetric galactosylation and sialylation, linking adaptive immune responses to Fc glycan heterogeneity
- The WIgGWAM approach is compatible with high-throughput formats, enabling integration into clinical study workflows for glycosylation biomarker discovery
Significance: This study fundamentally revises our understanding of antibody glycosylation by demonstrating that asymmetry is the rule, not the exception, for IgG1 Fc glycans. The finding that monofucosylation — rather than full afucosylation — drives FcγRIIIA binding has direct implications for therapeutic antibody design: engineering monofucosylated antibodies may achieve ADCC enhancement comparable to fully afucosylated platforms without the production challenges of complete FUT8 knockout. For biopharmaceutical developers, this work underscores the importance of analytical methods that preserve paired glycan information — such as our subunit-level and intact mass middle-up approaches — and highlights that conventional released glycan or glycopeptide analysis alone may miss functionally critical asymmetric glycosylation states.
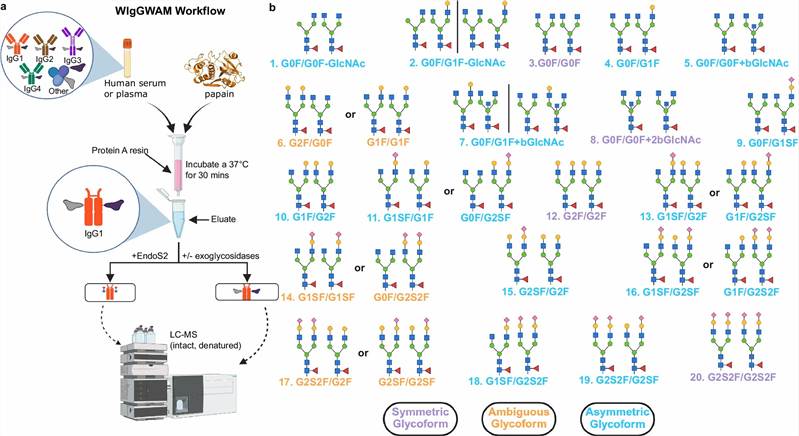
Figure from Azzam et al. (2025). WIgGWAM intact LC/MS glycoprofiling of human IgG1 reveals that asymmetric glycosylation is universal, with ~60% of antibodies carrying different glycans on the two Fc chains. Asymmetric monofucosylation, not symmetric afucosylation, drives FcγRIIIA binding and severe dengue disease. Reproduced under CC BY 4.0.
Representative Antibody Glycosylation Characterization Data Outputs
Our antibody glycosylation analysis service delivers multi-level data packages tailored to the specific analytical objectives. Below are representative data outputs from each analytical level, illustrating the types of information generated for therapeutic antibody characterization programs.
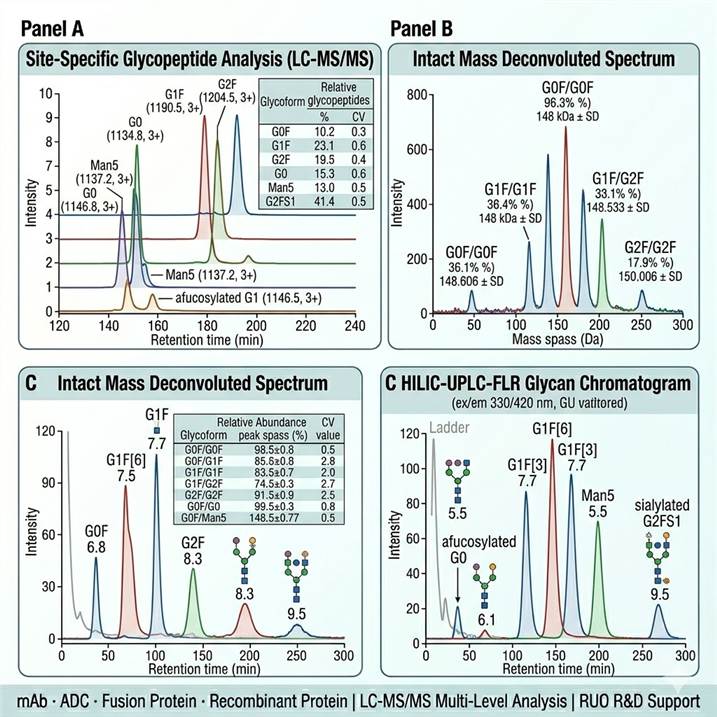
Panel A — Site-Specific Glycopeptide Analysis (LC-MS/MS): Extracted ion chromatograms for representative tryptic glycopeptides from the Fc Asn297 site of a human IgG1 monoclonal antibody. Each trace corresponds to a specific glycoform: G0F (m/z 1176.5, 3+), G1F (m/z 1190.5, 3+), G2F (m/z 1204.5, 3+), G0 (m/z 1134.8, 3+), Man5 (m/z 1137.2, 3+), and afucosylated G1 (m/z 1146.5, 3+). Relative quantitation based on XIC peak areas shows the distribution: G0F (42.3%), G1F (27.8%), G2F (8.1%), G0 (5.2%), Man5 (4.8%), G1F + NeuAc (sialylated, 3.6%), and minor species comprising the remainder. The inset table reports site-specific occupancy with CV <10% across triplicate analyses, demonstrating the precision required for batch-to-batch comparability assessment.
Panel B — Intact Mass Deconvoluted Spectrum: Deconvoluted mass spectrum of a full-length IgG1 mAb (150 kDa range) showing the resolved glycoform envelope. Each major peak corresponds to a distinct combination of glycans on the two Fc Asn297 sites: G0F/G0F (148,028 Da, 17.5%), G0F/G1F (148,190 Da, 29.2%), G1F/G1F (148,352 Da, 22.4%), G1F/G2F (148,514 Da, 10.1%), G2F/G2F (148,676 Da, 3.8%), G0F/G0F + Man5 (148,190 Da, overlapping), and minor afucosylated and hybrid glycoform species. The average mass of 148,210 ± 45 Da and the observed glycoform distribution provide a quantitative fingerprint of product heterogeneity that can be directly compared across batches and to the originator product in biosimilar programs.
Panel C — HILIC-UPLC-FLR Glycan Chromatogram: Fluorescence trace of 2-AB-labeled N-glycans released from a therapeutic IgG1 mAb, separated by HILIC-UPLC (BEH Glycan column, 60°C, 50 min gradient). Major glycan peaks are annotated with GU values and structural icons: G0F (GU 6.8, 38.5%), G1F[6] (GU 7.5, 20.2%), G1F[3] (GU 7.7, 8.5%), G2F (GU 8.3, 6.8%), Man5 (GU 5.5, 4.5%), Man6 (GU 6.2, 2.1%), afucosylated G0 (GU 6.1, 3.2%), and sialylated G2FS1 (GU 9.5, 2.8%). The glucose unit calibration (dextran ladder G1–G10) enables robust GU-based glycan identification across analytical runs and laboratories.
Why Choose Our Antibody Glycosylation Analysis Service
Multi-Level Analytical Depth
Our integrated platform deploys all four complementary analytical levels — intact mass profiling, subunit middle-up analysis, site-specific glycopeptide LC-MS/MS, and released N-glycan HILIC-UPLC-FLR-MS — ensuring that monoclonal antibody and Fc-fusion protein programs receive the appropriate depth of glycosylation characterization for each development stage, from early discovery screening to comprehensive CQA assessment.
Asymmetric Glycosylation Capable
Conventional released glycan and glycopeptide workflows average glycan information across the two Fc chains, discarding critical asymmetry information. Our intact mass and subunit-level middle-up platforms preserve paired Fc glycan data, enabling detection and quantitation of asymmetric glycosylation states — including monofucosylated, monosialylated, and hybrid glycoforms — that may have disproportionate functional impact on Fc effector function and clinical activity.
Biosimilar Comparability Expertise
Our glycosylation comparability workflow follows the ICH Q5E regulatory framework with statistical equivalence testing, multivariate similarity assessment, and forced degradation stability comparison. We have extensive experience supporting biosimilar development programs across multiple mAb formats and therapeutic areas, with data packages formatted for regulatory submission support.
Integrated PTM-Glycosylation Correlation
Understanding how glycosylation interacts with other PTMs — oxidation of nearby methionine residues affecting glycan processing, deamidation in CDR regions correlated with glycation levels — requires integrated multi-PTM analysis from the same analytical run. Our platform simultaneously captures glycosylation, deamidation, oxidation, glycation, and other PTM data from a single LC-MS/MS peptide mapping acquisition, enabling PTM-PTM correlation analysis.
Flexible Service Models
We offer engagement models from targeted single-module analysis (e.g., released glycan profiling alone) to comprehensive multi-level characterization packages with extended bioinformatics support. All services are delivered under RUO non-GMP research workflows explicitly designed for biopharmaceutical discovery and development — not clinical batch release or GMP quality control.
Publication-Ready Data Delivery
Our data packages include publication-quality figures (annotated mass spectra, glycan chromatograms, comparative bar charts, PCA plots) and comprehensive data tables with quantitative glycosylation attributes, statistical analysis results, and raw data files. All deliverables are designed to support research publications, regulatory filings, and internal decision-making.
Related Services
Our antibody glycosylation analysis service is part of an integrated biopharma PTM solutions platform. Related services available within the PTM2 sub-site include:
- Biopharma PTM Characterization Services — Comprehensive PTM characterization hub for monoclonal antibodies, ADCs, fusion proteins, and recombinant therapeutics
- Protein Drug Glycosylation Analysis — N-glycan and O-glycan profiling for non-antibody therapeutic glycoproteins and recombinant proteins
- ADC / Fusion Protein PTM Analysis — Drug-to-antibody ratio determination, payload distribution, conjugation site mapping, and PTM characterization for ADCs and fusion proteins
- Protein PEGylation Analysis — PEG attachment site identification, chain distribution, and free PEG quantification for PEGylated therapeutics
- Protein Drug PTM Mapping — Comprehensive deamidation, oxidation, isomerization, and glycation mapping by high-resolution peptide mapping for forced degradation and comparability studies
- Glycoproteomics Analysis Services — Extended glycoproteomics platform including O-glycan analysis, multi-isotype antibody glycosylation profiling, and glycopeptide enrichment technologies
- Site-Specific Glycosylation Analysis — Targeted site-level glycosylation profiling for engineered glycosylation sites and multi-glycosylated therapeutic proteins
- Glycopeptide Enrichment — Specialized enrichment technologies (HILIC, lectin affinity, chemical biology methods) for glycopeptide purification prior to LC-MS/MS analysis
- N-Glycosylation Profiling of Proteins — Comprehensive N-glycan analysis including site occupancy, glycan heterogeneity, and structural characterization for recombinant proteins
- Quantitative Glycoproteomics Analysis — Quantitative glycoproteomics using TMT, SILAC, and label-free approaches for differential glycosylation expression analysis
- MS-Based PTM Analysis Services — Full-service platform for bottom-up, middle-down, and top-down MS-based PTM characterization across all modification types
Frequently Asked Questions
What is the difference between released glycan analysis and glycopeptide analysis for antibody glycosylation characterization?
Released glycan analysis (PNGase F release + HILIC-UPLC-FLR-MS) provides detailed structural characterization of the complete N-glycan repertoire at the population level, including linkage isomers and branching patterns via exoglycosidase sequencing, but cannot assign glycans to specific glycosylation sites. Glycopeptide analysis (LC-MS/MS of proteolytic glycopeptides) provides site-specific information — which glycan is attached to which asparagine residue — with relative quantitation per site, but offers less detailed structural information than released glycan analysis. The two approaches are complementary: released glycan analysis delivers the best structural resolution, while glycopeptide analysis provides site-specific occupancy data. For comprehensive antibody glycosylation characterization, both approaches are recommended.
What sample amount is required for antibody glycosylation analysis?
Sample requirements depend on the analytical depth required. For intact mass profiling alone, ≥10 µg of purified antibody is sufficient. For comprehensive glycopeptide analysis, we recommend ≥100 µg per condition. For released N-glycan profiling (HILIC-UPLC-FLR-MS), ≥50 µg is sufficient. For integrated multi-level characterization (intact mass + subunit + glycopeptide + released glycan), ≥200 µg of purified antibody per condition is recommended. Samples should be provided in solution (PBS or compatible buffer) at ≥1 mg/mL concentration. Lower amounts may be possible for targeted analyses; please consult our scientists for specific project needs.
Can you detect and quantify Fab glycosylation on therapeutic antibodies?
Yes — our multi-level analytical platform is specifically designed to detect and quantify Fab glycosylation, which is present on approximately 15–25% of approved therapeutic antibodies. At the subunit level (IdeS digestion + LC-HRMS), Fab glycans are resolved from Fc glycans by domain separation, enabling independent glycoform profiling. At the glycopeptide level, Fab glycosylation sites are identified by their distinct tryptic peptide sequences and quantified using the same glycopeptide workflow as Fc glycans. Fab glycans often show different processing patterns (higher hybrid and high-mannose content, lower galactosylation) compared to Fc glycans, and our data reporting explicitly distinguishes Fab from Fc glycosylation attributes.
How do you quantify afucosylation levels for ADCC assessment?
Afucosylation is quantified at multiple analytical levels for cross-validation. At the glycopeptide level, extracted ion chromatograms of the fucosylated vs afucosylated forms of each glycan composition at each glycosylation site provide site-specific afucosylation percentages. At the intact mass level, the relative abundance of afucosylated glycoform peaks in the deconvoluted spectrum provides the global afucosylation level. At the subunit level, Fc/2 fragment glycoform analysis provides afucosylation data that is independent of Fab glycan interference. Our standard reporting includes afucosylation levels from at least two analytical levels, with CV <15% across methods. Total afucosylation (sum of all afucosylated species) and specific afucosylation (e.g., G0 + G1 + G2 afucosylated, excluding high-mannose) are reported separately.
What is the turnaround time for antibody glycosylation characterization?
Turnaround times vary by analytical scope. Intact mass profiling alone: 1 week from sample receipt. Subunit-level (IdeS/middle-up) glycosylation analysis: 1–2 weeks. Comprehensive glycopeptide analysis with >95% sequence coverage and site-specific glycan quantification: 2–3 weeks. Released N-glycan profiling with exoglycosidase sequencing: 2–3 weeks. Integrated multi-level characterization (intact + subunit + glycopeptide + released glycan): 3–4 weeks. Biosimilar comparability studies with forced degradation: 4–6 weeks. Expedited workflows are available for early-stage candidate screening with results in 3–5 business days for intact mass profiling.
Can you characterize glycosylation on bispecific antibodies and novel antibody formats?
Yes — our analytical platform is compatible with all antibody formats including monoclonal IgG (all subclasses), bispecific antibodies (BsAb, TCB, BiTE), Fc-fusion proteins, antibody-drug conjugates (ADCs), and novel engineered formats (scFv-Fc, VHH-Fc, Fc-only therapeutics). For bispecific antibodies with asymmetric chain architectures, our middle-up subunit analysis provides domain-level glycosylation resolution that is essential for distinguishing glycosylation on each unique chain. For novel formats, we develop customized LC-MS/MS methods based on the specific sequence and structure, including tailored digestion protocols (multi-protease strategies for non-standard fusion junctions) and customized glycopeptide databases that account for format-specific sequences.
References
- Azzam T, Bournazos S, Gunduz H, et al. Asymmetrically glycosylated IgG1 antibodies are universal and drive human disease. Nature Communications. 2025. DOI: 10.1038/s41467-025-67070-3. (CC BY 4.0)
- van Tol BDM, Wasynczuk AM, Gijze S, et al. Comprehensive Immunoglobulin G, A, and M Glycopeptide Profiling for Large-Scale Biomedical Research. Molecular & Cellular Proteomics. 2025;24(3):100928. DOI: 10.1016/j.mcpro.2025.100928. (CC BY 4.0)
- Mesonzhnik N, Belushenko A, Novikova P, Kukharenko A, Afonin M. Enhanced N-Glycan Profiling of Therapeutic Monoclonal Antibodies through the Application of Upper-Hinge Middle-Up Level LC-HRMS Analysis. Antibodies. 2024;13(3):66. DOI: 10.3390/antib13030066. (CC BY 4.0)
For research use only. Not for use in diagnostic procedures.