Why Protein Drug PTM Mapping Matters — From Candidate Selection to Regulatory Filing
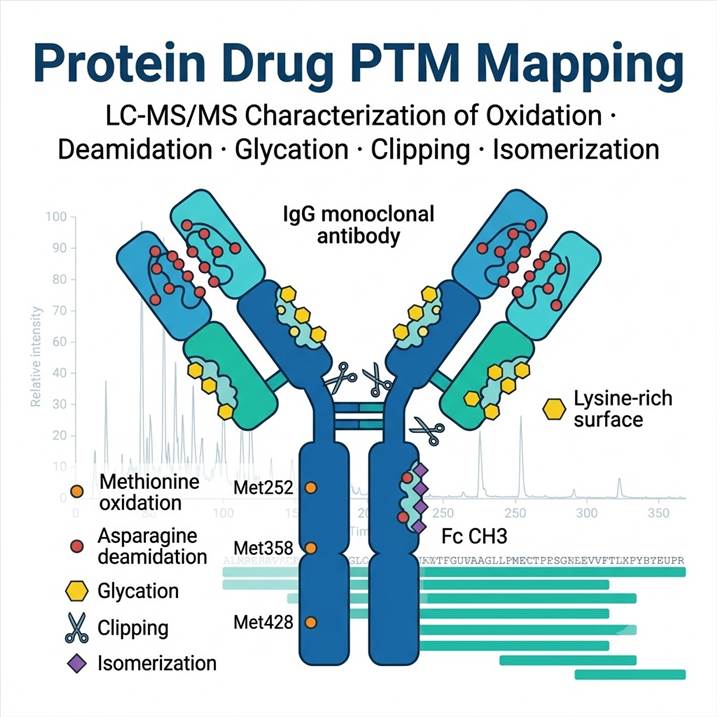
Post-translational modifications in protein therapeutics are not merely analytical observations — they are critical quality attributes (CQAs) that directly influence drug performance. Oxidized methionine residues can reduce FcRn binding and accelerate clearance. Deamidated asparagine residues in complementarity-determining regions (CDRs) can diminish target affinity. Glycation during manufacturing or storage can alter pharmacokinetics. Clipped species contribute to product heterogeneity, and isomerized aspartate residues may introduce immunogenic risk.
Regulatory agencies, including ICH guidelines for biotherapeutic characterization, explicitly require manufacturers to identify and monitor PTM profiles throughout development and manufacturing. For early-stage programs, comprehensive PTM mapping provides the data needed to rank-order candidates by their stability risk before committing to costly development timelines. For later-stage programs, PTM data supports formulation optimization, comparability assessments, and process change evaluations.
Our service addresses this need with a standardized LC-MS/MS peptide mapping workflow that quantifies modification percentages at single-residue resolution across the entire protein sequence, delivering the data that discovery teams and regulatory reviewers alike demand.
The Five Key PTMs We Map — Oxidation, Deamidation, Glycation, Clipping & Isomerization
Each PTM class requires distinct analytical considerations for accurate detection and quantification. Our panel covers all five in a single integrated workflow.
Oxidation
Methionine and tryptophan oxidation are among the most common degradation pathways in protein therapeutics. Methionine residues in the Fc region (particularly Met252, Met358, and Met428 in IgG1) are susceptible to oxidation during manufacturing, storage, and upon exposure to light or oxidative stress. Oxidation of CDR tryptophan residues can directly affect target binding. Our assay quantifies oxidation at each susceptible residue as a percentage of the total peptide, with limits of detection below 1% modification.
Deamidation
Asparagine deamidation — the non-enzymatic conversion of asparagine to aspartate and isoaspartate — is a critical stability concern, particularly when deamidation occurs in CDRs where it can abolish antigen binding. Deamidation rates depend on sequence context (NG and NS motifs are most susceptible), pH, temperature, and buffer composition. Our workflow resolves deamidated species from native peptides by chromatographic separation and quantifies each variant independently.
Glycation
Non-enzymatic glycation occurs when reducing sugars react with lysine residues and N-terminal amines during cell culture and formulation. Unlike enzymatic glycosylation, glycation is heterogeneous and can affect multiple lysine residues across the protein surface. Elevated glycation levels have been linked to reduced potency and increased immunogenicity risk. Our assay detects and quantifies glycated peptides using diagnostic neutral loss fragmentation and extracted ion chromatogram integration.
Clipping (Proteolytic Degradation)
Proteolytic clipping generates lower molecular weight species that contribute to product heterogeneity and may reduce potency. Clipping can occur in the hinge region (particularly in IgG antibodies), in exposed loops, or at sites of sequence instability. Our peptide mapping workflow identifies clipped peptides by their unique mass shifts and N-/C-terminal peptide signatures, providing site-specific clipping quantification.
Isomerization
Aspartate isomerization — the conversion of aspartate to isoaspartate via a succinimide intermediate — is a common degradation pathway in protein therapeutics that can alter local structure and affect binding. Like deamidation, isomerization rates depend on sequence context and solution conditions. Our workflow uses diagnostic fragment ions to distinguish aspartate from isoaspartate and reports isomerization as a percentage of total peptide. For related work on cysteine-specific modifications and redox PTMs, our Protein Oxidation Analysis service provides complementary depth on oxidation-sensitive residues.
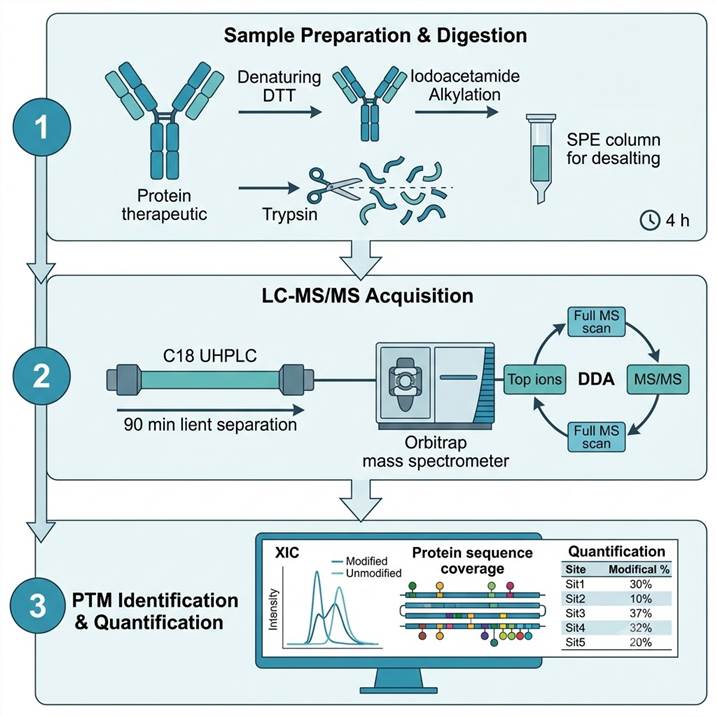
LC-MS/MS Peptide Mapping Workflow — From Intact Protein to Site-Level PTM Quantification
Our PTM mapping workflow follows a standardized bottom-up proteomics approach optimized for biotherapeutic proteins. Sample preparation is conducted under controlled conditions that minimize artifactual modifications, ensuring that measured PTM levels reflect the true sample state.
Step 1: Sample Preparation & Digestion
- Protein denatured, reduced (DTT), and alkylated (iodoacetamide) in chaotropic buffer
- Trypsin digestion at 37 °C for 4 h under optimized enzyme-to-substrate ratio
- Digestion quenched with formic acid; peptides desalted by SPE
- Control samples processed in parallel to distinguish genuine PTMs from artifacts
Step 2: LC-MS/MS Acquisition
- Reversed-phase C18 separation on UHPLC (2.1 × 150 mm, 1.7 μm column)
- 90-minute gradient for optimal peptide resolution
- Orbitrap or Q-TOF MS/MS in data-dependent acquisition mode
- Full MS scan at 60,000 resolution for precursor quantification
- Targeted MS/MS for PTM-containing peptides where needed
Step 3: PTM Identification & Quantification
- Protein sequence coverage >95% confirmed by database search
- PTM sites identified by mass shift + MS/MS fragmentation evidence
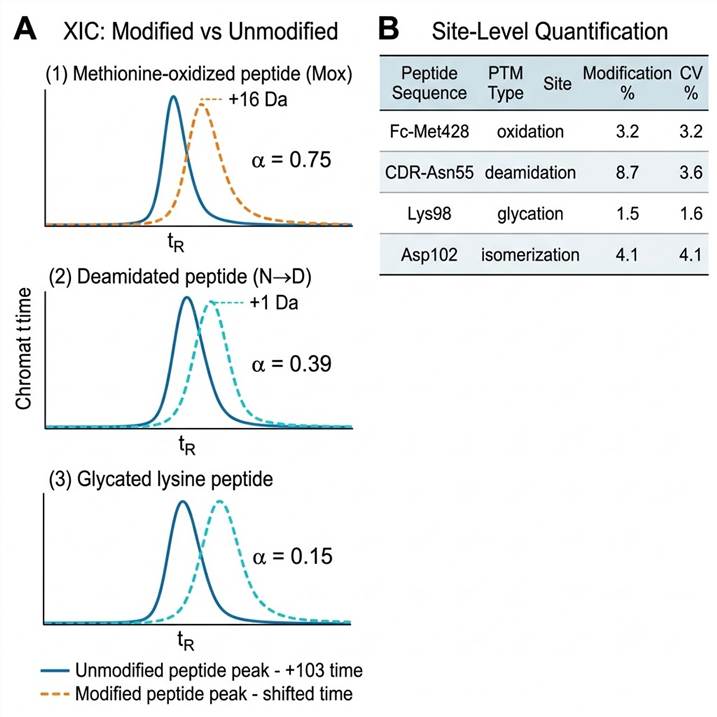
- Relative quantification by extracted ion chromatogram (XIC) peak area integration
- Modification % calculated as: modified peptide area ÷ (modified + unmodified) × 100
- Results reported with site-level localization scores and quantification CVs
For researchers requiring broader proteome-wide modification surveys, our Global PTMs Profiling service provides complementary coverage across diverse modification types in complex biological backgrounds.
Research Applications — Early Candidate Screening to Forced Degradation
Our PTM mapping service supports biologics programs at every stage of development, from discovery through regulatory filing. The same analytical workflow applied to different sample types addresses distinct questions at each phase.
Early Candidate Screening and Lead Selection
At the candidate selection stage, PTM profiling across 5–20 lead candidates identifies those with the lowest inherent modification risk. Candidates with CDR deamidation hotspots or solvent-exposed methionine residues can be deprioritized before advancing to in vivo studies. Our standardized workflow enables direct cross-candidate PTM comparison with batch-level QC.
Formulation Development and Stability Studies
For formulation scientists, PTM mapping across pH, buffer, and excipient conditions identifies the formulation composition that minimizes modification rates. Time-course studies at elevated temperatures (accelerated stability) reveal modification kinetics and guide shelf-life assignment. The assay detects PTM level changes of ±1–2% absolute with high confidence, enabling meaningful stability comparisons.
Forced Degradation and Stress Testing
ICH Q5C-compliant stress testing requires characterization of protein therapeutics under thermal, photolytic, and oxidative stress. Our workflow maps the full PTM landscape under each stress condition, identifying which residues are most susceptible and establishing degradation pathways that inform formulation and process development.
Biosimilar Comparability Studies
For biosimilar development programs, PTM profile comparison between the biosimilar candidate and the reference product is a core component of the analytical similarity assessment. Our service provides head-to-head PTM comparison with statistical evaluation of differences, supporting the totality-of-evidence approach required by regulators. For detailed cysteine redox PTM analysis in parallel, our Redox PTM Proteomics platform offers complementary cysteine modification profiling.
Sample Requirements for Biotherapeutic PTM Analysis
Our PTM mapping service is compatible with a wide range of protein therapeutics and sample matrices. The table below provides general guidelines for the most common project types. Contact our scientific team for a project-specific feasibility assessment.
| Sample Type |
Recommended Amount |
Storage & Shipping |
Critical Notes |
| Purified mAb / protein drug (≤ 5 mg/mL) |
50–200 µg per condition |
−80 °C, ship on dry ice |
Avoid freeze-thaw cycles. Provide formulation buffer composition for LC-MS compatibility assessment |
| Formulation buffer (blank) |
200 µL |
−80 °C, ship on dry ice |
Essential for background subtraction in excipient-containing formulations |
| Forced degradation samples (heat/light/pH) |
50–200 µg per timepoint |
Snap-freeze after stress exposure; −80 °C, ship on dry ice |
Include unstressed control sample from same batch. Document stress conditions (temperature, duration, light dose) |
| Biosimilar comparability sets |
200 µg per product |
−80 °C, ship on dry ice |
Reference product and biosimilar candidate should be shipped under identical conditions |
Deliverables — Publication-Ready PTM Reports with Site-Level Quantification
Every project delivers a comprehensive data package designed to support internal decision-making, regulatory submissions, and manuscript preparation. Our reports are structured to answer specific project questions, not merely to deliver raw data.
Standard Deliverables
- Protein sequence coverage map — annotated with identified peptides, sequence coverage percentage, and PTM sites highlighted
- PTM identification table — every modified residue with modification type, site localization score, MS/MS spectrum annotation, and retention time
- PTM quantification report — modification percentage for every site in every condition, with intra- and inter-run CVs
- Extracted ion chromatograms — overlaid traces for modified and unmodified peptide pairs, with integrated peak areas
- Comparative PTM heatmaps — cross-condition or cross-candidate modification level visualization for rapid pattern recognition
- Method appendix — detailed experimental parameters suitable for regulatory submission and manuscript methods sections
- Interpretive project summary — contextual narrative identifying modification hotspots, stability risks, and recommendations for follow-up
For comprehensive proteome-wide PTM characterization beyond individual protein drugs, our Pan PTM Proteomics platform provides broader multi-PTM coverage in complex samples.
Case Study: Quantitative PTM Mapping of a Therapeutic Monoclonal Antibody in Pharmacokinetic Studies
To demonstrate the application of LC-MS-based PTM mapping in biotherapeutic development, we highlight a published study by Xu et al. (PLOS ONE, 2019) that used affinity purification LC-MS to quantify post-translational modifications of a therapeutic monoclonal antibody (MAB1) in serum samples from cynomolgus monkeys following single- and multiple-dose administration. This study illustrates how site-level PTM quantification informs PK/PD understanding and product quality assessment.
Study Design
The study employed an affinity purification LC-MS workflow to extract MAB1 from monkey serum, followed by tryptic digestion and LC-MS/MS analysis. PTMs quantified included asparagine deamidation at three Fc-region sites (Asn in CH2 domain, Asn in CH3 domain at two positions) and N-terminal pyroglutamate formation. The study monitored PTM levels over 56 days in both single-dose and multiple-dose cohorts, enabling mathematical modeling of in vivo modification kinetics.
Key Results: Deamidation Kinetics and Exposure
Deamidation rates varied substantially across the three asparagine sites. Asn site 2 (Fc CH3 domain) showed the fastest deamidation rate at 0.539% per day, while Asn site 1 (Fc CH2 domain) was essentially stable at 0.0035% per day (Fig. 3, Xu et al.). In the single-dose study, the area under the curve (AUC) for MAB1 species carrying deamidation at Asn site 2 was 426.7 μg/mL·day, representing 9.9% of the total MAB1 exposure. For N-terminal pyroglutamate, the AUC was 191.5 μg/mL·day (4.5% of total exposure).
Modeling and Prediction
Using the measured deamidation rate constants, the study developed a mathematical model that accurately predicted PTM levels observed in the multiple-dose cohort. For example, the model predicted Asn site 2 deamidation at 14.2% pre-dose versus 15.0% measured; post-dose predicted 7.9% versus 7.9% measured (Fig. 5, Xu et al.). The close agreement between model and experiment demonstrates that in vitro-derived deamidation rates, when properly integrated with PK parameters, can predict in vivo PTM levels — a capability with direct implications for predicting circulating drug quality in clinical studies.
Conclusion
This study establishes that quantitative LC-MS PTM mapping, when combined with PK modeling, provides a powerful framework for understanding how post-translational modifications affect the exposure and disposition of therapeutic antibodies. The same analytical principles and workflows underpin our PTM mapping service, adapted for higher throughput and broader PTM panel coverage including oxidation, glycation, clipping, and isomerization.
Source
Xu, X.; Huang, Y.; Pan, H.; Molden, R.; Qiu, H.; Daly, T. J.; Li, N. PLOS ONE 2019, 14, e0223899. DOI: 10.1371/journal.pone.0223899. Figures 3 and 5 provide the primary PTM quantification and modeling data.
Protein Drug PTM Mapping: Frequently Asked Questions
What is the minimum sample amount required for a full PTM panel?
We recommend 50–200 µg of purified protein per condition. This amount supports >95% sequence coverage and robust quantification of all five PTM classes (oxidation, deamidation, glycation, clipping, isomerization). Lower amounts (10–50 µg) are possible for targeted PTM monitoring where only specific residues are of interest.
Which PTMs are most critical for monoclonal antibody stability?
Methionine oxidation in the Fc region (particularly Met252, Met358, Met428 in IgG1) is the most commonly monitored CQA for stability. CDR deamidation is the most critical for potency, as it can directly reduce target affinity. Glycation, clipping, and isomerization are context-dependent but must be assessed for each candidate. Our panel provides simultaneous coverage of all five, enabling identification of which PTMs are most relevant for your specific molecule.
What are the detection limits for low-abundance PTMs?
For well-resolved modified and unmodified peptide pairs, our routine detection limit is 0.5–1% modification level (relative abundance). For peptides where modified and unmodified forms co-elute partially, the limit is approximately 1–2%. These detection limits are sufficient to monitor PTMs at levels relevant to product quality.
How do you distinguish genuine PTMs from sample preparation artifacts?
Artifactual modifications during sample preparation — particularly oxidation (from air exposure during digestion) and deamidation (from elevated pH during prolonged digestion) — are well-documented sources of error. We control for these with three strategies: (1) parallel process blank controls processed identically to samples, (2) rapid digestion protocols (4 h or less) at neutral pH to minimize artificial deamidation, and (3) inclusion of antioxidant additives during digestion to limit artifactual oxidation. Only PTMs that exceed the background levels in process controls are reported as genuine.
What is the typical turnaround for multi-condition comparison studies?
Standard projects are completed within 3–5 weeks from sample receipt. For single-condition PTM profiling of up to 5 candidates, turnaround is 3 weeks. Multi-condition studies (e.g., 5 conditions × 3 replicates, 5 timepoints) typically require 4–5 weeks. Rush timelines are available for time-sensitive programs.
References
- Xu, X.; Huang, Y.; Pan, H.; Molden, R.; Qiu, H.; Daly, T. J.; Li, N. "Quantitation and Modeling of Post-Translational Modifications in a Therapeutic Monoclonal Antibody from Single- and Multiple-Dose Monkey Pharmacokinetic Studies Using Mass Spectrometry" PLOS ONE 2019, 14, e0223899.
- Millán-Martín, S.; Jakes, C.; Carillo, S.; Rogers, R.; Ren, D.; Bones, J. "Comprehensive Multi-Attribute Method Workflow for Biotherapeutic Characterization and Current Good Manufacturing Practices Testing" Nat. Protoc. 2023, 18, 1056–1089.
- Yan, Y.; Wei, H.; Fu, Y.; Jusuf, S.; Zeng, M.; Ludwig, R.; Krystek, S. R.; Chen, G.; Tao, L.; Das, T. K. "Simultaneous Monitoring of Oxidation, Deamidation, Isomerization, and Glycation of Monoclonal Antibodies by LC-MS" mAbs 2016, 8, 1081–1094.