Why PTM Connectivity Demands Proteoform Mapping
Every bottom-up proteomics experiment faces the same fundamental limitation: tryptic digestion severs the physical connection between distant modification sites. Consider histone H3. It carries well-characterized modifications at Lys-4, Lys-9, Lys-27, Lys-36, and Ser-10 — among others — but a bottom-up analysis that reports all five as "modified" leaves a critical ambiguity unresolved.
The analysis cannot distinguish between a scenario where each proteoform carries a single modification and one where a single proteoform carries all five simultaneously. These two possibilities imply profoundly different biological outcomes: independent, additive regulation in the first case, versus a coordinated, combinatorial code in the second. Without proteoform-level resolution, the functional meaning of the modification data remains unknown.
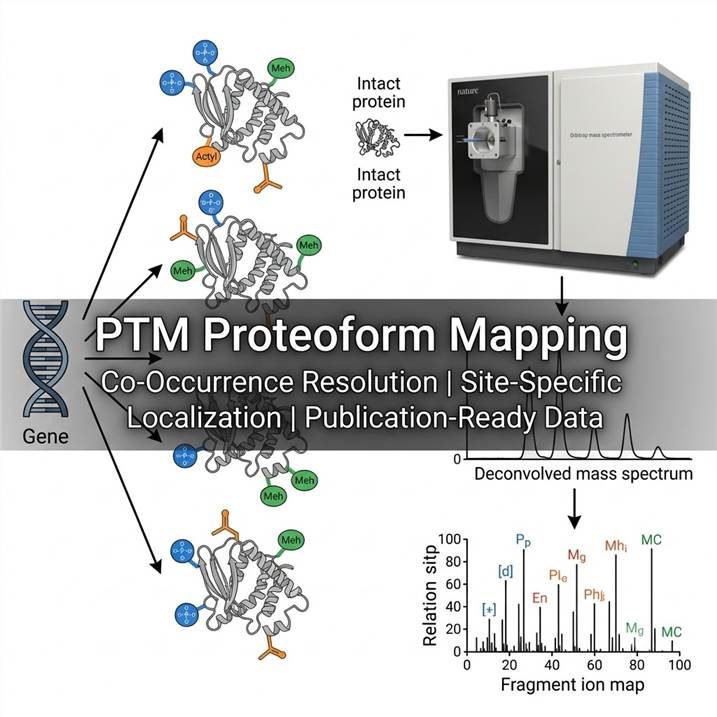
Proteoform-level PTM mapping addresses this directly. By analyzing intact proteins, we measure the mass of each molecular species as a whole, detecting the cumulative mass shift from all modifications present. Top-down MS/MS fragmentation then localizes individual modifications to specific residues, confirming which sites are modified on each proteoform. The result is a complete picture: for every detected proteoform, you know its exact modification composition and, where fragmentation coverage permits, the residue-level assignment of each PTM.
This connectivity information is not a luxury. It is the difference between knowing that a kinase is "phosphorylated" and knowing which phosphorylation state — active, inactive, or intermediate — dominates under your experimental conditions. For proteins with dense modification landscapes — histones, transcription factors, multi-site signaling proteins — proteoform-level data reveals functional states that peptide-level analysis masks entirely.
High-Resolution Intact Mass Profiling
The foundation of proteoform mapping is high-resolution intact mass analysis. We perform intact protein separation by reversed-phase liquid chromatography (RPLC) coupled to Orbitrap-based mass spectrometers operating at resolving powers exceeding 120,000 (at m/z 400). This resolution is essential for distinguishing closely related proteoforms — an acetylation (+42.011 Da) versus a trimethylation (+42.047 Da) on a histone tail, for instance, differ by only 0.036 Da and appear as overlapping peaks at lower resolution.
Our intact mass profiling workflow captures the full proteoform diversity present in a sample before any fragmentation is performed. Each detected intact mass corresponds to a distinct proteoform — a unique combination of amino acid sequence and modifications. The mass accuracy achieved (typically < 3 ppm with internal calibration) enables direct assignment of proteoform masses to candidate modification compositions, even for proteins above 30 kDa where resolving individual proteoforms becomes analytically demanding.
| Instrument Specification |
Performance Metric |
| Mass Analyzer |
Orbitrap (Thermo Scientific) |
| Resolving Power |
≥ 120,000 at m/z 400 |
| Mass Accuracy |
< 3 ppm (internal calibration) |
| Mass Range |
200–4,000 m/z (extendable with charge-state manipulation) |
| Fragmentation Modes |
HCD, ETD, EThcD |
| Typical Proteoform ID Depth |
Hundreds to thousands per sample (depending on fractionation) |
The depth of proteoform coverage depends on sample complexity and the fractionation strategy employed. For complex lysates, multidimensional separation — combining solution-phase fractionation (GELFrEE, SEC, or IEX) with RPLC — extends proteoform identification to several thousand unique species from a single sample type. This is not a theoretical limit; it reflects the analytical performance demonstrated by systematic top-down studies using comparable platforms.
Fragment-Based PTM Site Localization
Identifying that a proteoform carries a phosphorylation is different from knowing which residue is phosphorylated. Site-specific localization requires fragment ion spectra that unambiguously distinguish between candidate modification sites. We achieve this through top-down MS/MS using complementary fragmentation modes selected for the specific proteoform under analysis.
Electron transfer dissociation (ETD) and electron transfer/higher-energy collision dissociation (EThcD) are preferred for labile modifications such as phosphorylation and O-GlcNAcylation. These techniques preserve modification integrity during fragmentation while generating extensive backbone cleavage. Higher-energy collisional dissociation (HCD) provides complementary coverage for stable modifications including acetylation, methylation, and oxidation. Using multiple fragmentation modes together maximizes sequence coverage and modification site assignment confidence.
Every PTM site assignment in our reports is accompanied by a localization probability score. This score reflects the fragment ion evidence supporting that specific residue assignment over alternative candidate sites. We apply false discovery rate (FDR) control at both the proteoform identification level and the PTM site assignment level, typically reporting assignments that meet a 1% FDR threshold. When fragment ion coverage is insufficient to resolve two adjacent candidate sites, we flag the ambiguity explicitly and report the possible site range rather than forcing an uncertain assignment.
For researchers who require targeted validation of specific modification sites, our PTM Site Identification service provides complementary bottom-up approaches with orthogonal validation.
Comparative Proteoform Quantification
Understanding biological regulation requires more than identifying which proteoforms exist — it requires knowing how their abundance changes between conditions. We perform label-free quantification (LFQ) of intact proteoforms, extracting ion chromatograms for each detected proteoform and comparing signal intensities across experimental groups.
Our quantification workflow is built for reproducibility. Each biological condition is analyzed in triplicate, and we report proteoform-level coefficients of variation (CVs) alongside abundance ratios. Proteoforms detected in at least two of three replicates are carried forward for quantitative comparison, balancing coverage with statistical rigor. Differential abundance testing identifies proteoforms with statistically significant changes between groups, with multiple testing correction applied to control false discovery.
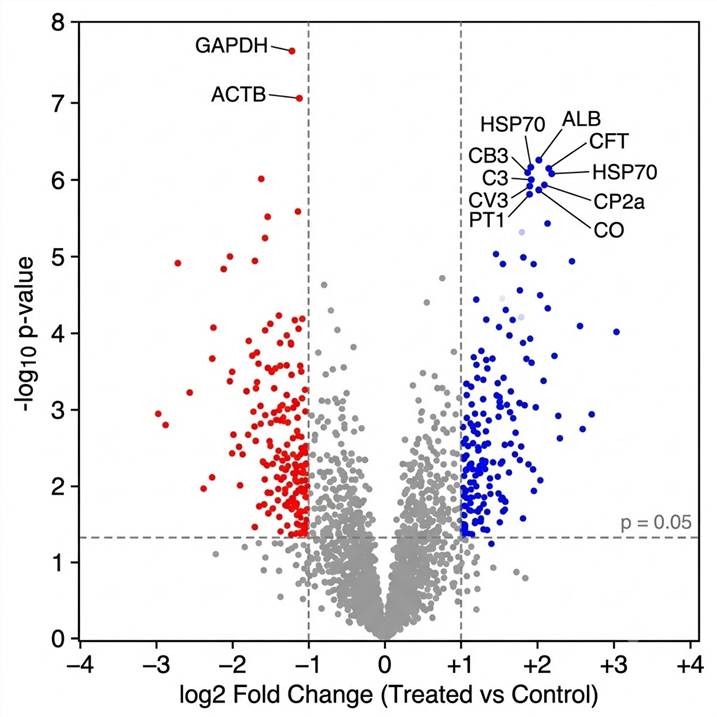
The quantitative output includes volcano plots showing fold-change versus statistical significance for every detected proteoform and heatmaps clustering proteoforms by abundance patterns across conditions. These visualizations enable rapid identification of condition-specific proteoform signatures — the molecular forms whose abundance shifts are most strongly associated with your experimental perturbation.
For projects requiring precise measurement of the proportion of a given protein that carries a specific modification, our PTM Site Occupancy Analysis service provides complementary absolute quantification of modification stoichiometry.
Bioinformatics Pipeline
Proteoform identification from top-down data requires specialized computational tools fundamentally different from those used in bottom-up proteomics. Our pipeline integrates multiple software platforms to maximize identification depth and confidence.
Intact mass spectra are first deconvolved to generate zero-charge mass lists, converting the complex charge-state envelopes of intact proteins into single monoisotopic or average masses. These deconvolved masses are searched against a proteome database using ProSightPD (or equivalent search engines optimized for top-down data), which matches observed fragment ion masses to theoretical fragment masses from candidate protein sequences carrying specified modification compositions.
Key bioinformatics deliverables include:
- Proteoform identification table: accession number, gene name, observed mass, theoretical mass, mass error (ppm), modification composition, and identification confidence score for each proteoform
- PTM site localization report: for each modification, the assigned residue position, localization probability score, and supporting fragment ion count
- Fragment ion maps: annotated spectra showing b- and y-type fragment ions with modification site assignments
- Quantitative comparison: fold-change values, p-values, and adjusted p-values for each proteoform across condition comparisons
- Interpretive summary: biological context annotations, pathway enrichment analysis, and publication-ready figure panels
The computational workflow is not a black box. We provide access to intermediate data files and analysis parameters so you can inspect and reproduce the identification pipeline. This transparency matters for publication, where reviewers increasingly expect detailed methods documentation for proteomics experiments.
Service Workflow
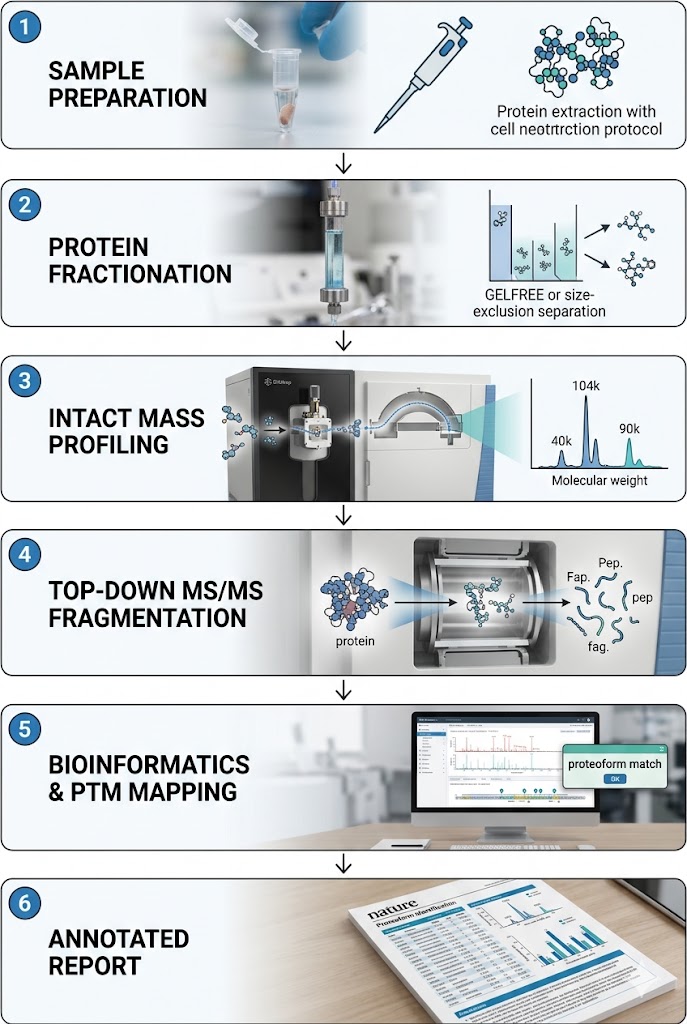
Our PTM Proteoform Mapping Service follows a structured workflow designed to maximize proteoform coverage while maintaining rigorous quality control at each stage.
Step 1: Sample Submission and Quality Assessment
You provide your biological samples following our preparation guidelines. Upon receipt, we assess protein integrity by SDS-PAGE or microfluidic electrophoresis and quantify total protein concentration. Samples that pass QC proceed to processing.
Step 2: Protein Extraction and Optional Fractionation
Proteins are extracted under conditions optimized for intact protein solubility and stability. For complex samples requiring deeper coverage, we apply solution-phase fractionation — size-based (GELFrEE), charge-based (IEX), or subcellular fractionation — to reduce sample complexity before LC-MS analysis.
Step 3: Intact Protein LC-MS Profiling
Fractionated or unfractionated samples are separated by RPLC and introduced into the mass spectrometer for intact mass analysis. Full-scan spectra are acquired at high resolution to capture the proteoform mass distribution across the entire elution profile.
Step 4: Top-Down MS/MS Fragmentation
Proteoforms selected for fragmentation analysis are isolated and subjected to complementary fragmentation modes (HCD, ETD, EThcD). Fragment ion spectra are acquired at sufficient resolution to resolve fragment isotope patterns and enable confident sequence and modification assignment.
Step 5: Data Analysis and Report Delivery
All raw data are processed through our bioinformatics pipeline. You receive a comprehensive report containing proteoform identification tables, PTM site localization maps, quantitative comparison results, and publication-ready figure panels, along with all raw and processed data files.
Sample Requirements
The table below summarizes sample types, quantities, and handling guidelines for PTM Proteoform Mapping. Samples should be snap-frozen and shipped on dry ice following the preparation steps in the Service Workflow section above.
| Sample Type |
Minimum Amount |
Recommended Amount |
Handling Notes |
| Cell Pellet (mammalian) |
1 × 10⁷ cells |
2 × 10⁷ cells |
Wash 3× with PBS, snap-freeze in liquid nitrogen, store at -80°C. Avoid freeze-thaw cycles. |
| Tissue |
50 mg wet weight |
100 mg wet weight |
Snap-freeze immediately after collection. Keep on dry ice during shipping. |
| Purified Protein |
50 µg |
100 µg |
Provide in volatile buffer (e.g., ammonium bicarbonate) where possible. Include buffer composition details. |
| Biofluid (serum/plasma) |
200 µL |
500 µL |
Depletion of high-abundance proteins (albumin, IgG) recommended for deeper proteoform coverage. |
| Subcellular Fraction |
50 µg total protein |
100 µg total protein |
Confirm fraction purity by western blot before submission. |
All samples must be shipped on dry ice with appropriate labeling and documentation. For specialized sample types not listed above, contact our scientific team to discuss feasibility and requirements.
Research Applications
Proteoform-level PTM mapping provides insights that span fundamental biology, disease mechanism research, and drug development.
Histone Code Deciphering
Combinatorial histone modifications — the "histone code" — regulate chromatin structure and gene expression. Each histone protein can carry multiple modifications simultaneously, and the functional outcome depends on the specific combination present. Bottom-up analysis identifies individual modification sites but cannot reconstruct the combinatorial patterns that define functional chromatin states. Proteoform mapping resolves intact histones, directly measuring which modification combinations exist on H3, H4, H2A, and H2B in your experimental system. Our Histone PTM Analysis service extends this capability with dedicated histone enrichment and analysis workflows.
Signaling Network Activation States
Multi-site phosphorylation of signaling kinases and transcription factors generates proteoform populations with distinct activities. The tumor suppressor p53 alone carries more than 30 documented phosphorylation and acetylation sites. Proteoform mapping reveals which activation states are present under specific stimuli, enabling correlation of modification patterns with functional outcomes such as transcriptional activation or apoptosis induction. Our Phosphoproteomics Analysis and Acetylomics Analysis services provide complementary deep coverage of these PTM classes.
Disease-Specific Proteoform Signatures
Many diseases are associated not with changes in total protein abundance but with shifts in proteoform distributions — the relative abundance of different modification states of the same protein. Cardiac troponin I proteoform patterns, for instance, differ between healthy and failing hearts. Proteoform mapping enables discovery of disease-associated proteoform signatures that conventional proteomics, which averages modification signals across all proteoforms, may miss entirely.
Biopharmaceutical Characterization
Therapeutic proteins — monoclonal antibodies, Fc-fusion proteins, and recombinant enzymes — exist as complex mixtures of proteoforms differing in glycosylation patterns, N-terminal processing, oxidation states, and other modifications. Intact mass analysis and top-down characterization provide a direct readout of product heterogeneity, supporting quality attribute assessment and biosimilar comparability studies. Our Glycoproteomics Analysis service provides complementary glycan-specific characterization.
Our Approach vs. Bottom-Up PTM Analysis
Choosing between proteoform-level mapping and conventional bottom-up PTM analysis depends on your research question. The table below compares the two approaches across dimensions that matter for experimental design and data interpretation.
| Capability |
PTM Proteoform Mapping (This Service) |
Bottom-Up PTM Enrichment |
| PTM Connectivity |
Preserved — co-occurring modifications on the same molecule are detected together |
Lost — peptides carry only one or two modification sites; connectivity across distant sites is destroyed |
| Proteoform/Isoform Resolution |
Direct — each detected intact mass is a distinct proteoform |
Indirect — inferred from peptide-level data; isoform-specific peptides required |
| PTM Site Localization |
Fragment-based with localization probability scoring; requires sufficient fragmentation coverage |
Peptide-level with high confidence for most sites; limited by peptide length |
| Quantitative Capability |
Label-free quantification of intact proteoforms; relative abundance between conditions |
Label-free or label-based quantification at peptide level; summed to protein |
| Coverage Depth |
Hundreds to thousands of proteoforms; favors lower-molecular-weight proteins |
Thousands of modification sites; broader protein coverage including large proteins |
| Modification Stoichiometry |
Direct — intact mass shift reveals modification occupancy on each proteoform |
Inferred — requires separate occupancy analysis workflows |
| Throughput |
Moderate — longer LC gradients and more instrument time per sample |
High — established high-throughput workflows available |
The two approaches are complementary, not mutually exclusive. Many research programs benefit from combining bottom-up discovery — to identify modification sites broadly — with proteoform-level mapping to determine which combinations of those sites exist on the same protein molecule. We support integrated experimental designs that leverage both approaches for maximal biological insight.
The mass spectrometry platform underlying this service is detailed in our technology-specific pages: Top-Down MS-Based PTM Analysis covers intact protein fragmentation strategies, while Middle-Down MS-Based PTM Analysis addresses limited-digestion approaches for larger proteins where full intact analysis is challenging.
Case Study: Caco-2 Proteoform Mapping
A systematic study by Kaulich, Jeong, Kohlbacher, and Tholey (2024, Nature Methods) demonstrates the power of proteoform-level characterization and the analytical depth achievable with optimized top-down workflows — capabilities that directly inform our service design.
Background
The researchers set out to determine how different sample preparation strategies influence proteoform identification depth and diversity in top-down proteomics. Using human Caco-2 intestinal epithelial cells as a model system, they systematically compared cell lysis conditions, reduction and alkylation protocols, proteoform enrichment and fractionation strategies, and multidimensional separation schemes across 257 LC-MS/MS runs — representing approximately 27 days of total instrument measurement time.
Methods
Proteins were extracted from Caco-2 cells under systematically varied lysis conditions and subjected to six distinct sample preparation workflows. Intact proteins were separated by RPLC and analyzed on an Orbitrap-based mass spectrometer with FAIMS (high-field asymmetric waveform ion mobility spectrometry) for gas-phase fractionation. Proteoform identification was performed using ProSightPD against the human proteome database, with FDR-controlled identification and PTM annotation.
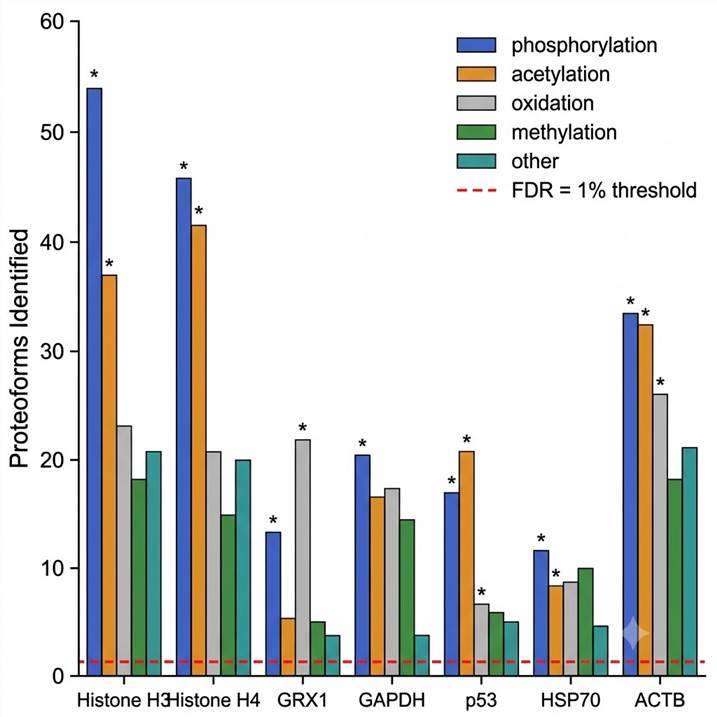
Key Results
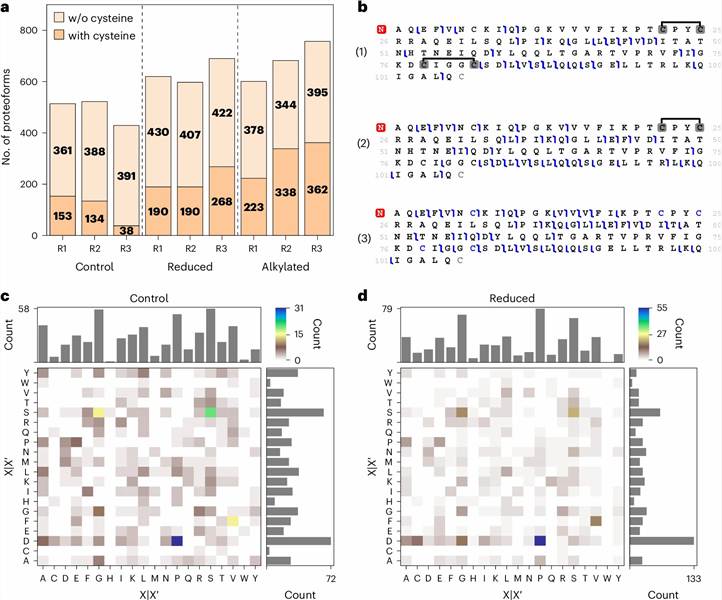
The study identified 13,975 unique proteoforms derived from 2,720 proteins, representing one of the deepest proteoform catalogs reported from a single cell type. Among these, 1,924 proteoforms (14%) were full-length proteins, while 12,051 (86%) were truncated forms — highlighting the prevalence of proteolytic processing that bottom-up analysis would not capture. Over 470 proteoforms exceeded 30 kDa in mass, demonstrating that intact protein analysis is not limited to small proteins when appropriate separation and ion manipulation strategies are employed.
The PTM types mapped across the proteoform population included acetylation, phosphorylation, oxidation, methylation, butyrylation, trimethylation, myristoylation, and geranylation — spanning both common and rare modification classes. Figure 3 of the study presents a fragment ion map of Glutaredoxin-1 (P35754), showing site-specific localization of disulfide bonds and carbamidomethylated cysteines on the intact proteoform. This illustrates the residue-level resolution achievable when top-down fragmentation is combined with systematic sample preparation optimization.
Conclusion
The study demonstrated that no single sample preparation strategy captures the full proteoform diversity of a biological sample. Different approaches reveal complementary subsets of the proteoform landscape, and combining multiple fractionation strategies increased proteoform coverage by 40–60% compared to any single approach. This framework for comprehensive proteoform mapping is integrated into our service design. All data from this study were deposited to ProteomeXchange (accession PXD049969), exemplifying the data transparency standards we uphold in every project.
Demo Data Gallery
The figures below illustrate the types of data outputs and visualizations delivered with every PTM Proteoform Mapping project. Each panel represents a core analytical deliverable — from intact mass deconvolution to modification network analysis — produced from experimental data comparable to what you can expect for your own samples.
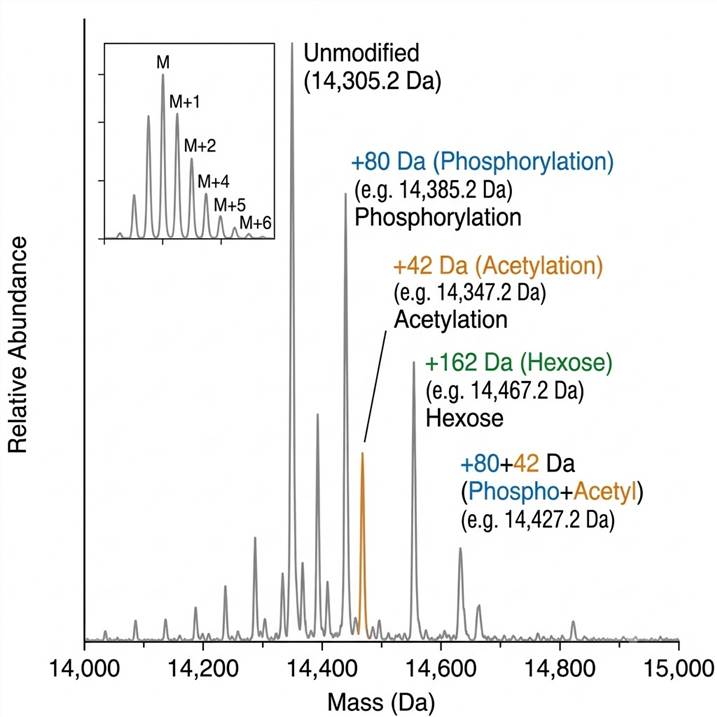
Figure A: Intact Mass Deconvolution. Deconvolved zero-charge mass spectrum of a ~15 kDa protein revealing distinct proteoform populations. Each peak represents a unique proteoform; mass shifts relative to the unmodified form identify modification composition directly.
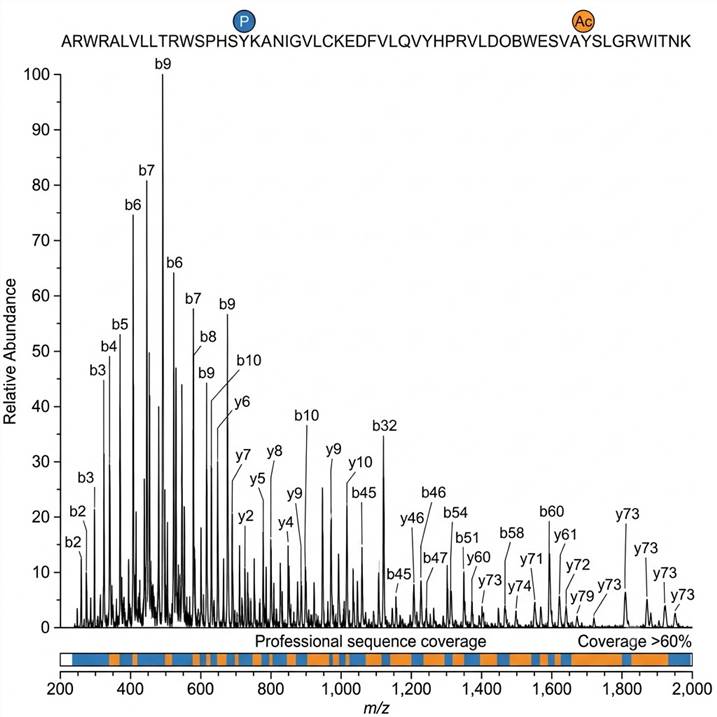
Figure B: Fragment Ion Map with PTM Site Localization. Annotated top-down MS/MS spectrum showing b- and y-ion fragment series that confirm the protein sequence and localize phosphorylation and acetylation sites to specific residues with >60% backbone coverage.
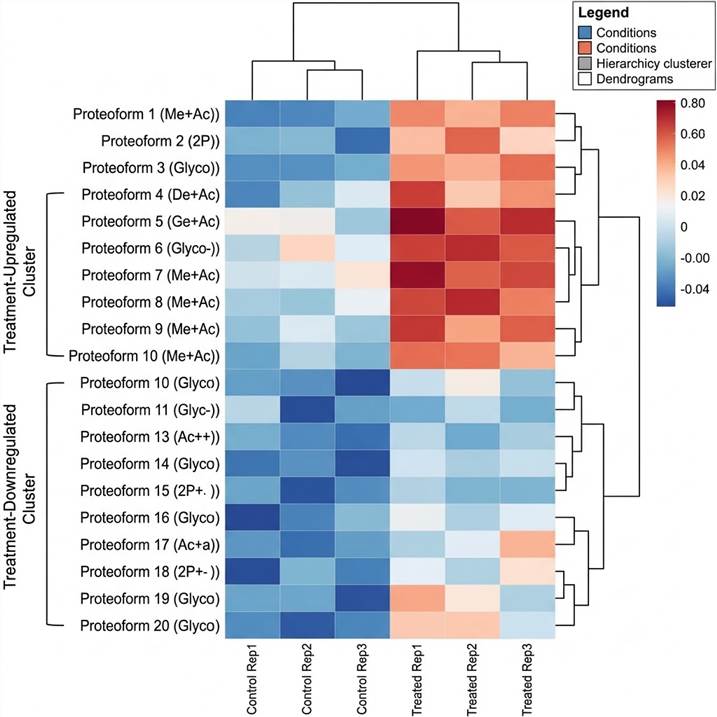
Figure C: Comparative Proteoform Abundance Heatmap. Hierarchically clustered heatmap of 20 proteoforms across control and treated conditions (3 replicates each). Upregulated and downregulated proteoform clusters are highlighted, revealing condition-specific proteoform signatures.
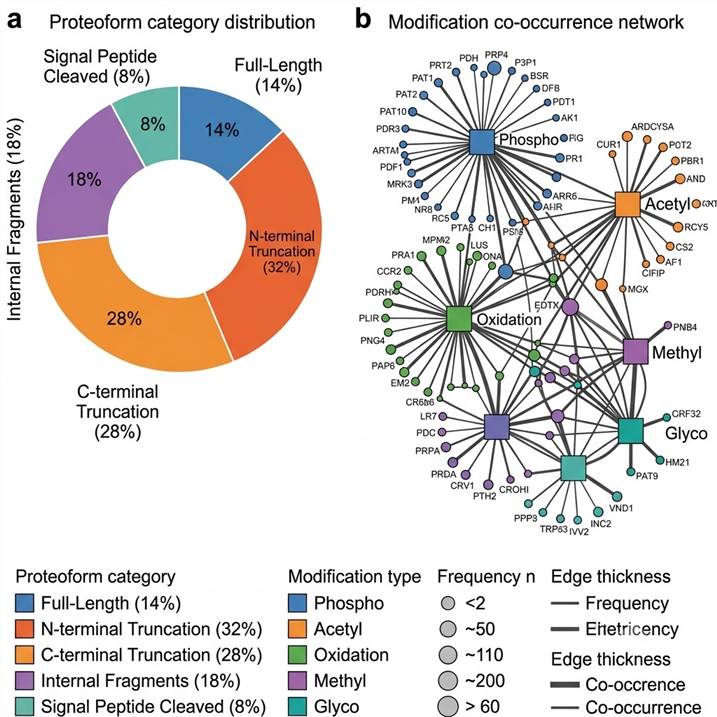
Figure D: Proteoform Distribution & Modification Co-Occurrence Network. Left: donut chart showing proteoform category breakdown (full-length vs. truncated forms). Right: modification co-occurrence network where edge thickness reflects co-occurrence frequency, revealing which PTM types travel together on the same proteoform.
Together, these outputs provide a multi-dimensional view of your proteoform landscape — from raw spectral evidence to systems-level modification networks — supporting direct use in manuscript figures, grant applications, and mechanism-of-action reports.
Frequently Asked Questions
What is the difference between proteoform mapping and standard PTM analysis?
Standard (bottom-up) PTM analysis digests proteins into peptides, identifies modification sites on individual peptides, and reports which sites are modified across the protein population. Because digestion destroys the physical connection between distant sites, it cannot determine which modifications coexist on the same protein molecule. Proteoform mapping analyzes intact proteins, preserving the complete modification landscape of each molecular species. You learn not just that Ser-10 and Lys-27 are both modified, but whether they are modified together on the same proteoform or on separate ones — a distinction with significant functional implications.
How many proteoforms can you identify from one sample?
Identification depth depends on sample complexity, protein abundance distribution, and the fractionation strategy employed. For unfractionated cell lysates, we typically identify several hundred proteoforms. With multidimensional fractionation, identification depth extends to a few thousand proteoforms, as demonstrated by published top-down studies using comparable platforms. We recommend discussing your specific sample type and coverage goals during project consultation so we can recommend the optimal fractionation strategy.
What level of confidence do you provide for PTM site assignments?
Every PTM site assignment in our reports includes a localization probability score that reflects the fragment ion evidence distinguishing the assigned site from alternative candidate sites. We apply FDR control at both the proteoform identification level and the PTM site level, typically reporting assignments meeting a 1% FDR threshold. For sites where fragment ion coverage is insufficient for unambiguous localization, we flag the ambiguity and report the possible residue range.
What sample types and how much material do you need?
We accept cell pellets (≥1 × 10⁷ cells), tissue (≥50 mg), purified proteins (≥50 µg), biofluids (≥200 µL), and subcellular fractions (≥50 µg total protein). All samples should be snap-frozen and shipped on dry ice. Detailed preparation guidelines are provided in the sample requirements section above. For sample types not listed, please contact us to discuss feasibility.
Can you compare proteoform abundance between experimental conditions?
Yes. We perform label-free quantification with replicate analysis (typically n=3 per condition) and provide statistical testing for differential proteoform abundance. The output includes fold-change values, p-values, and adjusted p-values, along with volcano plots and heatmaps for visualization.
Is the data publication-ready?
Yes. We deliver annotated proteoform tables, PTM site localization maps, fragment ion spectra, quantitative comparison results, and a comprehensive interpretive report formatted for direct use in manuscript preparation. All raw data files are provided alongside processed results, and our methods documentation is written to the level of detail expected by proteomics journals and reviewers.
How do you handle low-abundance proteins or precious samples with limited material?
For low-input samples, we optimize the entire workflow — from minimal-loss sample handling to extended LC gradients and sensitive MS acquisition — to maximize proteoform detection from limited material. Fractionation steps are selectively applied based on sample amount to avoid unnecessary dilution. We recommend discussing sample limitations during project consultation so we can design an optimized protocol.
References
- Proteoform: a single term describing protein complexity — Smith LM, Kelleher NL, et al. Nature Methods, 2013. The foundational publication that defined the term "proteoform" and established the conceptual framework for intact protein-level analysis.
- Influence of different sample preparation approaches on proteoform identification by top-down proteomics — Kaulich PT, Jeong K, Kohlbacher O, Tholey A. Nature Methods, 2024. A systematic investigation of how different sample preparation strategies affect proteoform identification depth, demonstrating the framework underlying our service design.
- Top-down proteomics: challenges, innovations, and applications in basic and clinical research — Brown KA, Melby JA, Roberts DS, Ge Y. Expert Review of Proteomics, 2020, 17(10):719-733. A comprehensive review of technological advances in top-down proteomics and their application to biomedical research questions.
- Identification and quantification of proteoforms by mass spectrometry — Schaffer LV, Millikin RJ, Miller RM, et al. Proteomics, 2019, 19(10):e1800361. A detailed review of computational and experimental methods for proteoform identification and quantification in top-down proteomics.