Oxidative Damage Markers We Quantify — DNA, RNA, and Repair Products
Most commercial oxidative damage services measure only one or two markers — typically 8-oxo-dG alone. This narrow panel misses the full scope of oxidative damage occurring at the nucleic acid level. Our assay quantifies 9+ oxidative lesions in a single run, covering guanine oxidation, adenine oxidation, pyrimidine oxidation, and ring-opened purine products across both DNA and RNA.
Guanine Oxidation Markers
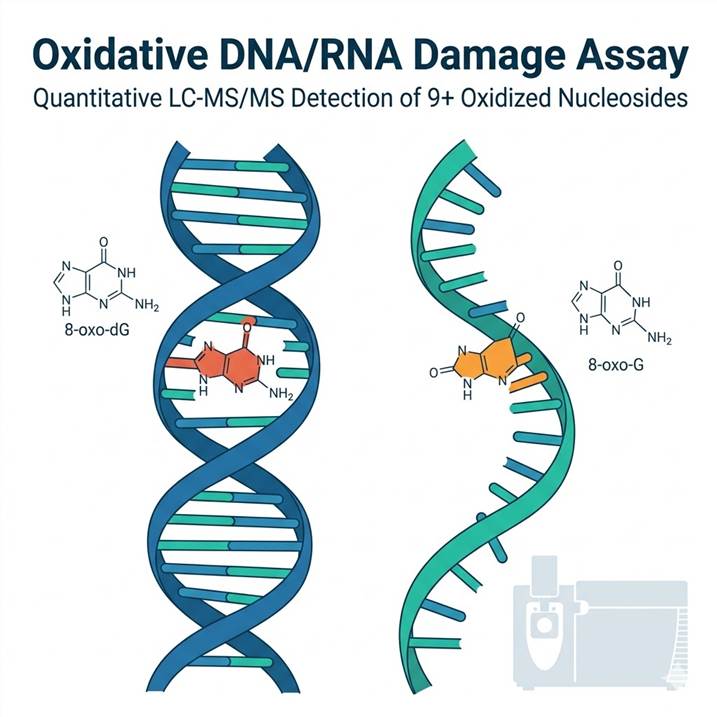
- 8-oxo-7,8-dihydro-2-deoxyguanosine (8-oxo-dG) — the most established DNA oxidation biomarker, formed when hydroxyl radicals attack the C8 position of guanine in DNA
- 8-oxo-7,8-dihydroguanosine (8-oxo-G) — the corresponding RNA oxidation marker, increasingly recognized as a biomarker of translational stress and RNA damage
- 8-oxo-7,8-dihydroguanine (8-oxo-Gua) — the free base form, excreted in urine as a repair product, enabling non-invasive oxidative stress monitoring
Adenine Oxidation Markers
- 8-oxo-7,8-dihydro-2-deoxyadenosine (8-oxo-dA) — DNA purine oxidation product, less abundant than 8-oxo-dG but provides complementary information on oxidative damage specificity
- 8-oxo-7,8-dihydroadenosine (8-oxo-A) — RNA purine oxidation product, indicative of oxidative stress effects on the transcriptome
Pyrimidine Oxidation Products
- 5-hydroxymethyl-2-deoxyuridine (5-HMdU) — formed by oxidative attack on thymine in DNA, correlated with hydroxyl radical exposure
- 5-hydroxymethyluracil (5-HMU) — RNA pyrimidine oxidation product, increasingly studied in neurodegenerative disease contexts
Ring-Opened Purine Lesions
- 2,6-diamino-4-hydroxy-5-formamidopyrimidine (FapyG) — ring-opened guanine lesion that persists longer than 8-oxo-dG and contributes to mutagenesis through a different mechanism
- 4,6-diamino-5-formamidopyrimidine (FapyA) — ring-opened adenine lesion, mechanistically distinct from 8-oxo-dA
Custom marker panels can be configured for specific research questions. Our DNA/RNA modification LC-MS platform extends this capability to broader modification profiling including methylation, hydroxymethylation, and other epigenetic marks. For studies requiring lesion localization at base resolution, the DNA base modification quantification service provides complementary nucleotide-resolution analysis.
Research Applications: Where Our Oxidative Damage Data Makes the Difference
Drug-Induced Oxidative Stress Assessment in Preclinical Safety
Chemotherapeutic agents, antiretroviral drugs, kinase inhibitors, and many other drug classes induce oxidative stress as either an on-target mechanism or an off-target toxicity. Quantifying DNA and RNA oxidation levels in treated versus untreated tissues provides a direct, quantitative readout of drug-induced oxidative damage that integrates across exposure duration and tissue distribution. Our stable isotope dilution approach corrects for matrix effects that vary between treatment groups, ensuring that observed differences reflect genuine biological effects rather than analytical artifacts. For research programs that need to correlate nucleic acid damage with protein-level oxidative modifications, we offer a protein oxidation analysis service that extends the assessment to the proteome.
Aging and Neurodegeneration Biomarker Studies
Oxidative damage accumulation in mitochondrial and nuclear DNA is one of the most reproducible hallmarks of aging. In neurodegenerative diseases — particularly Alzheimer's disease, Parkinson's disease, and amyotrophic lateral sclerosis — elevated 8-oxo-dG and 8-oxo-G levels are consistently observed in affected brain regions and in cerebrospinal fluid. Longitudinal studies that track these biomarkers over the course of disease progression or in response to antioxidant interventions require analytical precision that ELISA methods cannot reliably deliver. Our LC-MS/MS assay provides the intra- and inter-assay reproducibility needed for multi-timepoint biomarker studies. Researchers mapping oxidative damage across different genomic regions or cell types can combine this assay with our DNA/RNA adductomics service for comprehensive lesion profiling.
Environmental Exposure and Population Health Monitoring
Urinary 8-oxo-dG and 8-oxo-Gua are established non-invasive biomarkers for population-level oxidative stress monitoring in environmental health studies. Exposure to air pollution, heavy metals, pesticides, and ionizing radiation consistently elevates these markers. Our assay supports large-scale epidemiological studies with standardized sample preparation protocols, creatinine-normalized reporting, and batch-level quality control that maintains data comparability across hundreds or thousands of samples. For studies investigating redox signaling cascades triggered by oxidative damage, our redox PTM proteomics platform provides complementary cysteine oxidation and S-nitrosylation profiling at the protein level.
Assay Workflow: Antioxidant-Protected Sample Processing to Absolute Quantification
Artifactual oxidation during sample preparation is the single largest source of error in oxidative damage measurement. DNA and RNA continue to oxidize ex vivo unless protected by chelating agents and radical scavengers from the moment of extraction. Our workflow integrates antioxidant protection at every stage, and stable isotope internal standards added at the earliest step correct for any residual oxidation that occurs during processing. Typical turnaround from sample receipt to final report is 10–15 business days.
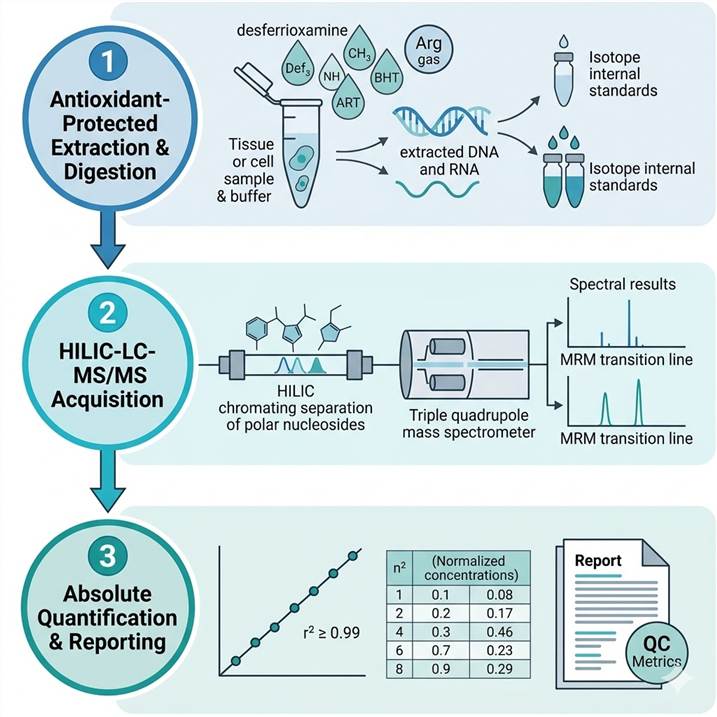
Step 1: Antioxidant-Protected Extraction and Digestion
- DNA/RNA extracted in buffers containing desferrioxamine (0.1 mM) and butylated hydroxytoluene (0.1 mM) to chelate transition metals and scavenge free radicals
- Processing under argon atmosphere where possible to minimize oxygen exposure
- Enzymatic digestion to nucleosides using DNase I, nuclease P1, and alkaline phosphatase under nitrogen
- Stable isotope internal standards added immediately post-digestion: 15N5-8-oxo-dG, 13C-8-oxo-G, and 15N5-8-oxo-dA
- Solid-phase extraction cleanup on mixed-mode sorbent
Step 2: HILIC-LC-MS/MS Acquisition
- Hydrophilic interaction liquid chromatography (HILIC) separation on a 2.1 × 100 mm amide column for optimal retention of polar nucleosides
- Triple quadrupole mass spectrometer operating in scheduled SRM/MRM mode
- Two transitions per analyte (quantifier + qualifier) for unambiguous identification
- Positive and negative electrospray ionization modes selected per analyte class
- Quality control samples at three concentration levels (low, medium, high) run every 20 samples
Step 3: Absolute Quantification, QC, and Reporting
- 8-point calibration curve constructed from authentic standards (r² ≥ 0.99 for all analytes)
- Absolute quantification reported as fmol/µg DNA or RNA (tissue/cells), nM (biofluids), or fmol/mg creatinine (urine)
- Limits of detection: 0.1–1 fmol on-column, corresponding to approximately 1 lesion per 106 normal nucleosides
- Final report includes raw chromatograms, calibration data, QC metrics, normalized concentrations, and a data interpretation summary
Sample Types and Submission Guidelines
Each sample type has specific handling requirements to preserve the true in vivo oxidation state. The table below summarizes requirements for the most commonly submitted matrices. For sample types not listed or for custom collection protocols, contact our scientific team before shipment.
| Sample Type |
Recommended Amount |
Storage & Shipping |
Critical Notes |
| Genomic DNA (tissue/cells) |
1–10 µg |
−80 °C, TE buffer with 0.1 mM desferrioxamine + 0.1 mM BHT; ship on dry ice |
Include antioxidants in the extraction buffer — DNA oxidation continues ex vivo without chelators |
| Total RNA (tissue/cells) |
1–5 µg |
−80 °C, RNase-free water, argon-purged tube headspace; ship on dry ice |
RNA oxidizes approximately 10× faster than DNA — process within 30 minutes of extraction |
| Plasma / Serum |
100–500 µL |
−80 °C, single-use aliquots (no refreezing); ship on dry ice |
Each freeze-thaw cycle increases measured 8-oxo-dG by 15–30%. Prepare multiple aliquots upfront |
| Urine |
0.5–2 mL |
−80 °C; ship on dry ice |
Collect mid-stream; creatinine normalization recommended for inter-individual comparisons |
| Cerebrospinal fluid |
100–500 µL |
−80 °C, low-retention tubes; ship on dry ice |
Oxidation biomarkers in CSF are typically 10–100× lower than in urine — larger volumes preferred |
LC-MS/MS vs. ELISA: Why Method Choice Determines Data Reliability
The choice between LC-MS/MS and ELISA for oxidative damage measurement is not a tradeoff between accuracy and convenience — it is a decision about whether your data will withstand peer review. ELISA-based methods for 8-oxo-dG and 8-oxo-G are susceptible to two fundamental sources of error: antibody cross-reactivity with structurally similar unmodified nucleosides that are present at 106-fold higher concentrations, and the inability to correct for artifactual oxidation that occurs during sample handling. The table below compares the two approaches across the dimensions that matter most for publication-quality data.
| Dimension |
LC-MS/MS (Our Assay) |
ELISA / Commercial Kits |
| Structural specificity |
Unambiguous — each analyte identified by retention time + two MRM transitions (quantifier/qualifier ion ratio) |
Antibody-dependent — cross-reactivity with unmodified dG (106-fold excess) inflates readings |
| Multiplexing capacity |
9+ oxidative lesions quantified simultaneously from one injection |
1–2 markers per plate; separate kits needed for each target |
| Limit of detection |
0.1–1 fmol on-column; 1 lesion per 106 normal nucleosides |
0.5–5 fmol per well; higher background noise from non-specific binding |
| Internal standard correction |
Stable isotope internal standards correct for recovery losses and matrix effects at every step |
No internal standard available — recovery losses and matrix effects go uncorrected |
| Artifactual oxidation control |
Antioxidant-protected extraction; isotope standard corrects for residual oxidation |
No protection — samples oxidize during preparation, inflating readings 10–100× |
| Publication acceptance |
Gold standard for oxidative damage quantification; required by leading journals for biomarker claims |
Increasingly rejected by reviewers without MS-based orthogonal validation |
ELISA kits remain useful for rapid pilot screening where approximate fold-changes between treatment groups are sufficient. However, when absolute concentrations, publication-quality data, or regulatory-grade quantification is required, LC-MS/MS with stable isotope internal standards is the only method that meets the analytical rigor expected by reviewers and funding agencies.
What You Receive: From Raw Data to Interpretation-Ready Reports
Every project includes a complete data package designed to move directly into your manuscript figures, supplementary materials, or regulatory documentation. We deliver raw data, processed results, and quality metrics — not just a spreadsheet of numbers.
Standard Deliverables
- Raw LC-MS/MS data files — instrument-native format (.raw, .wiff, or .d) for independent reanalysis if needed
- Processed SRM chromatograms — overlaid traces for each analyte and its isotope-labeled internal standard, annotated with retention times and ion ratios
- Calibration curves — 8-point standard curves for each analyte with equation, r², and residuals plot
- Quantification results table — absolute concentrations for every analyte in every sample, reported in project-relevant units (fmol/µg DNA, nM, fmol/mg creatinine)
- Quality control report — QC sample performance metrics, extraction recovery rates, inter-batch CV values, and blank contamination checks
- Interpretive project summary — a paragraph-level narrative contextualizing your results within known oxidative stress biology and suggesting relevant pathway-level implications
For projects requiring integration with other omics datasets, we provide data in tab-delimited or Excel formats with standardized sample identifiers that facilitate cross-platform merging with proteomics, metabolomics, or transcriptomics results.
Representative Data & Assay Performance
Every oxidative DNA/RNA damage project generates a complete analytical record from raw acquisition through final quantification. The figure below shows exemplar data from a representative urine sample analysis, demonstrating the sensitivity and specificity achieved across the full marker panel.
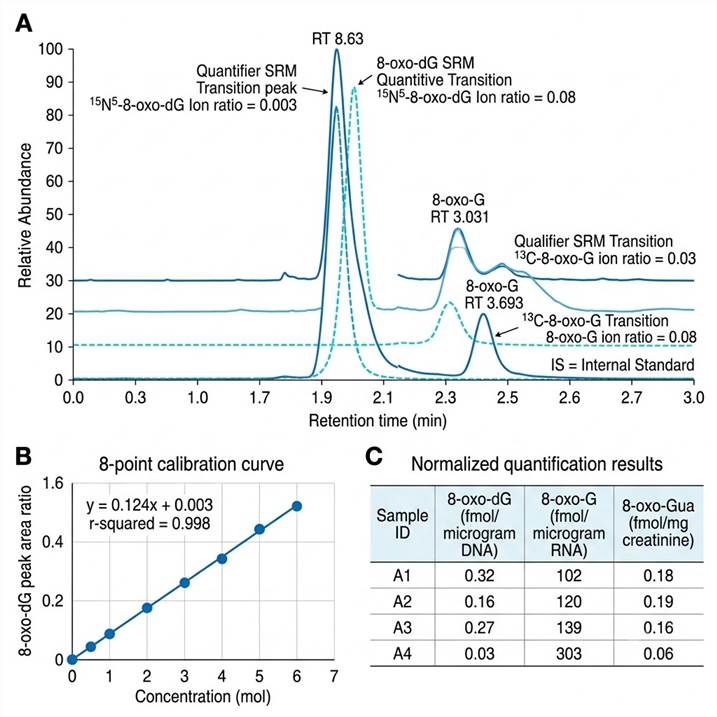
The SRM trace overlay confirms chromatographic resolution of 8-oxo-dG and its corresponding 15N5-labeled internal standard, enabling unambiguous peak assignment. The inset calibration curve demonstrates linear quantification across three orders of magnitude (r² ≥ 0.998), and the results table shows the absolute concentrations, intra-run CVs, and recovery rates for each oxidative lesion. These data examples are drawn from actual project QC runs, de-identified and aggregated to illustrate the data quality delivered with every service project.
Related Oxidative Stress & Modification Services
Our Oxidative DNA/RNA Damage Assay is part of a broader multi-omics platform for studying redox biology, nucleic acid modifications, and protein oxidation. The following services provide complementary or parallel analytical capabilities that can be integrated into a single project design.
- Global PTMs Profiling Service — pan-PTM discovery covering phosphorylation, glycosylation, acetylation, ubiquitination, and other modification types in a single workflow
- Pan PTM Proteomics — simultaneous detection of multiple PTM types from the same sample for integrated multi-layer modification analysis
- Glycoproteomics Analysis Services — site-specific glycosylation profiling including N-glycan and O-glycan mapping on intact glycopeptides
- m6A Modification LC-MS Analysis — quantitative profiling of RNA methylation modifications using validated LC-MS/MS methods for epitranscriptomics research
- GlycoRNA Sequencing — integrated RNA glycosylation analysis combining glycan detection with RNA sequencing for glycobiology studies
Combining oxidative DNA/RNA damage quantification with protein oxidation or adductomics in a single project design provides a systems-level view of how oxidative stress propagates across molecular pools — from nucleic acids to the proteome. Our scientific team can help design integrated workflows that maximize biological insight while minimizing total sample consumption.
Oxidative DNA/RNA Damage Assay: Frequently Asked Questions
How do you prevent artifactual oxidation during sample preparation?
We include metal-chelating antioxidants (desferrioxamine at 0.1 mM and butylated hydroxytoluene at 0.1 mM) in all extraction and digestion buffers from the moment of sample processing. Samples are handled under argon where possible, and we use rapid protocols that minimize ex vivo oxidation time. Stable isotope-labeled internal standards are added at the earliest possible step — immediately after enzymatic digestion — and correct for any residual oxidation that occurs during the remaining workflow. This three-layer protection (chelators + oxygen exclusion + isotope correction) ensures that reported concentrations reflect the true in vivo oxidative damage state, not processing artifacts.
What is the difference between 8-oxo-dG and 8-oxo-G?
8-oxo-dG (8-oxo-7,8-dihydro-2-deoxyguanosine) is the oxidized form of deoxyguanosine found in DNA. 8-oxo-G (8-oxo-7,8-dihydroguanosine) is the oxidized form of guanosine found in RNA. Both are formed by the same chemical mechanism — hydroxyl radical attack at the C8 position of guanine — but their biological implications differ. 8-oxo-dG is a mutagenic lesion that can cause G:C → T:A transversion mutations if not repaired. 8-oxo-G in mRNA can stall ribosomes and alter translational fidelity. Our assay measures both independently in the same analytical run, allowing you to distinguish DNA from RNA oxidative damage without splitting samples.
Can I measure DNA and RNA oxidation from the same tissue sample?
Yes. If sufficient tissue or cell material is provided, we extract DNA and total RNA from the same sample using sequential extraction protocols that preserve the oxidation state of both nucleic acid fractions. The DNA and RNA fractions are then digested and analyzed in parallel on the same LC-MS/MS system, providing paired DNA/RNA oxidation profiles from a single biological specimen. This paired analysis is particularly valuable for studies investigating whether oxidative stress preferentially damages one nucleic acid pool over the other, or whether DNA repair pathways successfully clear lesions that persist in the transcriptome.
What detection limits can I expect?
Our limits of detection range from 0.1 to 1 femtomole on-column, depending on the specific analyte. For genomic DNA, this corresponds to approximately 1 oxidative lesion per 106 normal nucleosides when analyzing 1 µg of DNA — which is at or below the basal level of oxidative damage observed in most tissues. For urine and plasma, detection limits are approximately 0.05–0.2 nM for 8-oxo-dG and 8-oxo-G. Actual sensitivity for your samples depends on matrix complexity, available sample volume, and which specific markers are in your panel. We provide a pre-project feasibility assessment at no cost before you commit samples.
How should I ship my samples to minimize artifactual oxidation during transit?
All samples should be shipped on dry ice in sealed, labeled containers. For DNA and RNA samples, we strongly recommend adding antioxidant additives (0.1 mM desferrioxamine + 0.1 mM BHT) to the storage buffer before the first freeze. Use single-use aliquots — never refreeze a thawed aliquot, as each freeze-thaw cycle increases measured 8-oxo-dG by 15–30%. For tissue samples, snap-freeze in liquid nitrogen immediately after collection and store at −80 °C. We provide detailed, matrix-specific shipping guidelines with every project confirmation, including a pre-labeled shipping checklist and a sample metadata template.
What normalization methods do you use for different sample types?
Normalization strategy depends on sample type: (1) For DNA extracted from tissues or cells, results are normalized to total DNA input (fmol/µg DNA), which corrects for differences in extraction yield. (2) For RNA, results are normalized to total RNA input (fmol/µg RNA). (3) For urine, we provide both absolute concentration (nM) and creatinine-normalized values (fmol/mg creatinine) to account for inter-individual differences in urine dilution. (4) For plasma and serum, results are reported as nM concentration. For all sample types, we also provide the raw unnormalized data so you can apply alternative normalization strategies during analysis.
References
- Chiorcea-Paquim, A.-M. "8-Oxoguanine and 8-Oxodeoxyguanosine Biomarkers of Oxidative DNA Damage: A Review on HPLC–ECD Determination" Molecules 2022, 27, 1620.
- Zou, Y.; Ma, X.; Tang, Y.; Lin, L.; Yu, J.; Zhong, J.; Wang, D.; Cheng, X.; Gao, J.; Yu, S.; Qiu, L. "A Robust LC-MS/MS Method to Measure 8-oxoGuo, 8-oxodG, and NMN in Human Serum and Urine" Anal. Biochem. 2023, 660, 114970.
- Chatgilialoglu, C.; Krokidis, M. G.; Terzidis, M. A. "Protocol for the Simultaneous Quantification of Oxidative Purine Lesions in DNA Using LC-MS/MS Analysis" STAR Protoc. 2024, 5, 103191.