Meeting the Analytical Challenge of DNA Base Modification Quantification by LC-MS
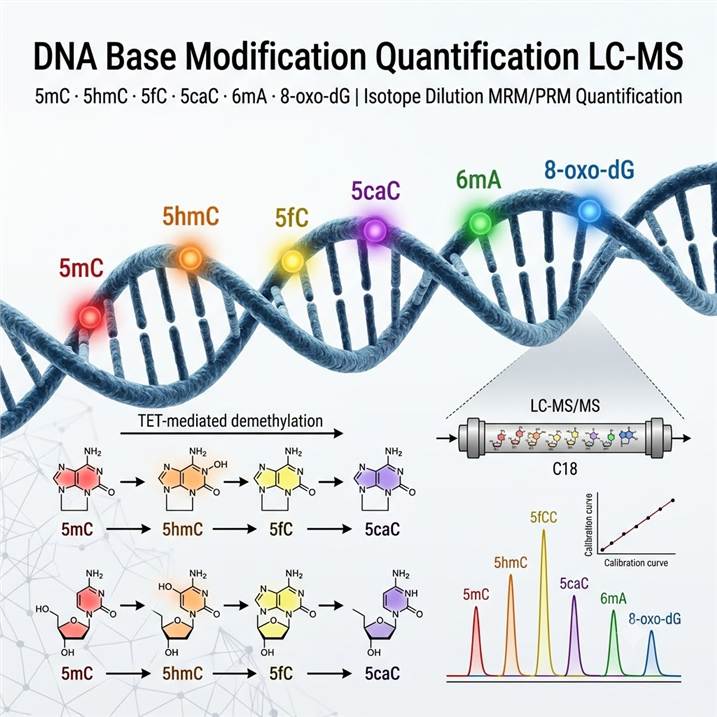
Chemical modifications of DNA bases encode information that extends far beyond the primary genetic sequence. In mammalian genomes, 5mC constitutes approximately 4–6% of all cytosines and serves as the canonical epigenetic mark regulating gene silencing, genomic imprinting, X-chromosome inactivation, and transposon repression. The TET family of dioxygenases (TET1/2/3) iteratively oxidize 5mC to 5hmC, 5fC, and 5caC, which not only serve as intermediates in active DNA demethylation but also function as distinct epigenetic marks with unique protein reader interactions and genomic distributions. 5hmC, in particular, is enriched in gene bodies and enhancers of actively transcribed genes in embryonic stem cells and neurons, with its levels dramatically reduced in cancer — making it a promising diagnostic and prognostic biomarker. 5fC and 5caC, though present at much lower abundance (typically 0.001–0.01% of C), recruit specific DNA repair and transcription factors and participate in poised RNA polymerase II regulation at promoter regions with important implications for cancer epigenetics and neurodevelopment.
Beyond cytosine modifications, 6mA has been detected as a DNA modification in diverse eukaryotic species including algae, fungi, insects, and mammals, where it functions in transcriptional regulation, transposon silencing, and stress response. Although present at much lower levels in mammalian DNA (typically 0.001–0.1% of A) compared to prokaryotes, emerging evidence links 6mA dysregulation to cancer and neurological disorders, driving demand for sensitive LC-MS quantification methods capable of distinguishing genuine 6mA signals from potential artifacts. In parallel, 8-oxo-dG — the most abundant oxidative DNA lesion, generated by reactive oxygen species (ROS) at an estimated 104 lesions per cell per day — serves as the primary biomarker for oxidative stress and is elevated in aging, inflammation, cancer, cardiovascular disease, and neurodegeneration. Our Oxidative DNA/RNA Damage Assay service provides complementary dedicated workflows for comprehensive oxidative lesion profiling.
Why LC-MS is the Method of Choice for DNA Base Modification Quantification
LC-MS/MS quantification of DNA base modifications offers several decisive advantages over antibody-based (ELISA, dot-blot) and sequencing-based approaches. First, LC-MS provides direct chemical measurement of modified nucleosides at the molecular level, eliminating the cross-reactivity and epitope accessibility issues that can confound antibody-based modification detection. Second, LC-MS delivers absolute quantification with isotope dilution internal standards — providing modification stoichiometry (e.g., % 5mC = 5mC/(5mC+C) × 100) rather than relative enrichment signals — enabling accurate cross-study comparison and longitudinal cohort analysis. Third, LC-MS simultaneously quantifies multiple modifications in a single analytical run, including all four cytosine derivatives in the TET demethylation pathway, allowing researchers to track the complete 5mC → 5hmC → 5fC → 5caC oxidative cascade and calculate the epigenetic "clock" rate from modification ratios. Fourth, LC-MS quantification is independent of DNA sequence context, GC bias, and PCR amplification — common confounders in sequencing-based epigenomic profiling. For these reasons, LC-MS has been established as the reference method for global DNA modification quantification in epigenomic research standardization initiatives.
DNA Base Modification Detection Capabilities and Performance Characteristics
Our DNA base modification quantification platform is specifically configured to detect and quantify the six most biologically significant DNA base modifications with validated sensitivity, specificity, and reproducibility across diverse sample types. The table below summarizes the detection parameters for each modification routinely quantified by our service.
| Modification |
Biological Significance |
Mass Shift (Da) |
Detection Mode |
Typical LOD |
| 5-Methylcytosine (5mC) |
Canonical DNA methylation mark; gene silencing, imprinting, X-inactivation, transposon repression |
+14.016 |
MRM (QQQ) / HRAM (Orbitrap) |
0.01% of C (100 fmol on-column) |
| 5-Hydroxymethylcytosine (5hmC) |
TET-mediated oxidation product; gene body enrichment, enhancer regulation, cancer biomarker |
+30.011 |
MRM (QQQ) / HRAM (Orbitrap) |
0.001% of C (10 fmol on-column) |
| 5-Formylcytosine (5fC) |
TET-mediated oxidation intermediate; transcription factor recruitment, RNAP II pausing regulation |
+28.006 |
HRAM (Orbitrap) / MRM |
0.0001% of C (1 fmol on-column) |
| 5-Carboxylcytosine (5caC) |
Final TET oxidation product; TDG-mediated base excision repair substrate, active demethylation |
+44.001 |
HRAM (Orbitrap) |
0.0001% of C (1 fmol on-column) |
| N6-Methyladenine (6mA) |
Conserved eukaryotic DNA methylation mark; transcriptional regulation, transposon silencing, stress response |
+14.016 |
MRM (QQQ) / HRAM |
0.0001% of A (0.5 fmol on-column) |
| 8-Oxo-7,8-dihydro-2'-deoxyguanosine (8-oxo-dG) |
Primary oxidative DNA lesion; biomarker of oxidative stress, aging, inflammation, carcinogenesis |
+15.995 |
MRM (QQQ) with enrichment |
0.5 fmol on-column (with SPE enrichment) |
Quantification Method: Isotope Dilution Absolute Quantification
Absolute quantification for each modification is performed using stable isotope dilution (SID) LC-MS/MS. Stable isotope-labeled internal standards — including 13C- or 15N-labeled versions of 5mC, 5hmC, 5fC, 5caC, 6mA, 8-oxo-dG, and their corresponding unmodified nucleosides (dC, dA, dG) — are spiked into each genomic DNA sample at the earliest possible step (prior to enzymatic hydrolysis). This approach corrects for recovery losses during sample processing, matrix-induced ion suppression, and inter-run signal variability, ensuring accurate absolute quantification across diverse sample matrices (cells, tissues, FFPE, biofluids). Calibration curves spanning 3–4 orders of dynamic range are prepared in matrix-matched solutions with authentic modification standards, and each analytical batch includes independent QC samples at low, medium, and high modification concentrations. For studies requiring parallel epigenetic and oxidative damage analysis from the same genomic DNA sample, our platform provides integrated multi-modification quantification workflows without the need for sample splitting or separate analyses.
Integrated Technical Platform for DNA Base Modification LC-MS Quantification
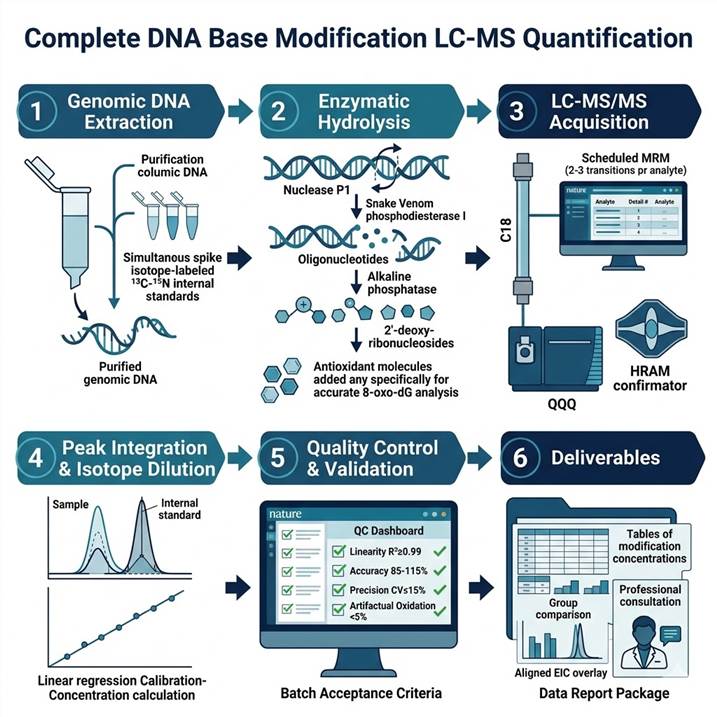
Reliable quantification of DNA base modifications by LC-MS demands rigorous optimization across every stage of the analytical pipeline — from genomic DNA extraction and enzymatic hydrolysis through high-resolution LC separation and tandem mass spectrometry acquisition to data processing and stoichiometry calculation. Our platform integrates validated protocols optimized for each modification class and sample matrix.
Genomic DNA Extraction and Quality Assessment
Genomic DNA is extracted using phenol-chloroform or column-based methods optimized to preserve labile modifications (particularly 5fC, 5caC, and 8-oxo-dG, which are susceptible to oxidation and degradation during extraction). RNase treatment ensures removal of RNA that would contribute ribonucleoside signals. DNA quantity is assessed by UV spectrophotometry (A260/A280 ≥ 1.8), and DNA integrity is verified by agarose gel electrophoresis or capillary electrophoresis. For low-input samples (e.g., cfDNA from liquid biopsies, laser-capture microdissected tissue), optimized microscale extraction protocols with reduced tube-to-tube variability are employed. 13C- or 15N-labeled internal standards are spiked into each sample immediately after DNA quantification to control for subsequent processing losses.
Enzymatic Hydrolysis to 2'-Deoxyribonucleosides
Purified genomic DNA is enzymatically hydrolyzed to individual 2'-deoxyribonucleosides using a validated sequential digestion protocol: DNA denaturation (95°C, 5 min) followed by digestion with nuclease P1 (single-strand-specific nuclease, 37°C, 16 h), snake venom phosphodiesterase I (3'→5' exonuclease, 37°C, 6 h), and alkaline phosphatase (dephosphorylation, 37°C, 2 h). Complete hydrolysis is verified by the absence of oligonucleotide peaks in LC-MS total ion chromatograms and confirmed by UV absorbance at 260 nm. For 8-oxo-dG analysis, antioxidants (e.g., desferrioxamine, butylated hydroxytoluene) are included in all digestion buffers to prevent artificial oxidation of dG to 8-oxo-dG during sample processing — a critical quality control measure that distinguishes genuine oxidative damage from experimental artifact.
LC-MS/MS Acquisition and Data Processing
Hydrolyzed 2'-deoxyribonucleosides are separated by reversed-phase liquid chromatography using C18 columns (2.1 × 150 mm, 1.7 µm) with a gradient of water/acetonitrile containing 0.1% formic acid. Targeted quantification is performed on triple quadrupole (QQQ) mass spectrometers operating in positive ion multiple reaction monitoring (MRM) mode, with 2–3 characteristic mass transitions per analyte for unambiguous identification. For 5fC and 5caC quantification at trace levels (sub-0.001% of C), Orbitrap HRAM detection at 60,000–120,000 resolution is deployed for accurate mass confirmation. 8-oxo-dG quantification incorporates offline solid-phase extraction (SPE) enrichment prior to LC-MS/MS to achieve sub-fmol detection limits. Data processing includes automated peak integration, isotope dilution-based concentration calculation, modification stoichiometry computation (% modification = labeled IS-normalized modified dN / total dN × 100), and correction for artifactual oxidation during sample processing (for 8-oxo-dG).
Quality Control and Validation
Each analytical batch includes: system suitability standards (retention time reproducibility ±0.1 min, signal intensity CV ≤ 10%), blank injections (carryover < 0.1% of LLOQ), calibration standards at 8 concentration levels across 3–4 orders of dynamic range, independent QC samples at low, medium, and high modification levels (accuracy 85–115%, precision CV ≤ 15%), and a digestion efficiency control (UV-based). Inter-batch reproducibility is monitored through repeated analysis of a pooled reference DNA sample. For 8-oxo-dG, the artifactual oxidation rate is quantified and reported by parallel processing of isotope-labeled dG-spiked control samples.
DNA Base Modification LC-MS Quantification Workflow: From Sample to Publication-Ready Data
Step 1: Genomic DNA Extraction and Quality Control
Genomic DNA is extracted using modification-preserving protocols optimized for each sample type (fresh-frozen tissue, cultured cells, FFPE, biofluids, plasma cfDNA). DNA quantity, purity, and integrity are assessed by UV spectrophotometry and gel/capillary electrophoresis. 13C- or 15N-labeled internal standards for all target modifications and unmodified nucleosides are spiked into each sample immediately after DNA quantification.
Step 2: Enzymatic Hydrolysis to Deoxyribonucleosides
Purified genomic DNA is sequentially digested with nuclease P1, snake venom phosphodiesterase I, and alkaline phosphatase under controlled conditions (pH, temperature, incubation time). For 8-oxo-dG analysis, antioxidants are included in all digestion buffers. Hydrolysis completion is verified by UV profile and LC-MS chromatogram quality assessment.
Step 3: LC-MS/MS Data Acquisition
Hydrolyzed deoxyribonucleosides are separated by C18 reversed-phase LC with optimized gradient elution providing baseline resolution of all modified and unmodified nucleosides. Targeted quantification uses QQQ MRM (2–3 transitions per analyte). For trace-level 5fC/5caC, Orbitrap HRAM full-scan acquisition provides accurate mass confirmation. For 8-oxo-dG, offline SPE enrichment is applied.
Step 4: Peak Integration, Identification, and Isotope Dilution Quantification
Chromatographic peaks are integrated and identified by retention time (±0.05 min), accurate mass (±5 ppm), and MRM transition ratio matching against authentic standards. Absolute concentrations are calculated from isotope dilution-normalized calibration curves. Modification stoichiometry (% modification) is computed as the ratio of modified to total (modified + unmodified) nucleoside, corrected for internal standard recovery.
Step 5: Quality Control and Data Validation
Each batch is validated against pre-established QC acceptance criteria including calibration linearity (R² ≥ 0.99), accuracy (spike recovery 85–115%), precision (intra- and inter-batch CV ≤ 15%), and LOD/LOQ verification. For 8-oxo-dG, artifactual oxidation rate is quantified and reported. Data are reviewed by a senior mass spectrometry scientist before release.
Step 6: Deliverables and Data Interpretation
Complete dataset including: modification concentration table (fmol/µg DNA or modification %) for each analyte per sample, group statistics with significance testing, individual and overlaid extracted ion chromatograms, calibration curves with regression parameters, batch QC performance report, and a consultation session with a senior scientist for biological interpretation of modification changes.
DNA Base Modification Quantification in Biomedical Research
Quantitative LC-MS analysis of DNA base modifications supports a broad spectrum of research applications spanning epigenetics, DNA damage and repair, cancer biology, neuroepigenomics, aging research, and environmental health. Our platform is configured to deliver the analytical sensitivity and quantitative precision required for each application domain.
Cancer Epigenetics and DNA Modification Biomarkers
Global DNA hypomethylation (reduced 5mC) and gene-specific hypermethylation are hallmarks of virtually all cancer types, while 5hmC levels are consistently and dramatically reduced in tumor tissues compared to matched normal controls — making 5hmC one of the most promising pan-cancer epigenetic biomarkers. Our LC-MS platform provides absolute quantification of 5mC, 5hmC, 5fC, and 5caC levels in tumor genomic DNA, plasma cell-free DNA, and urine samples, enabling researchers to track global epigenetic changes during tumorigenesis, monitor TET activity through the complete demethylation pathway, and evaluate candidate epigenetic biomarkers in clinical cohorts. For comprehensive nucleic acid damage assessment in cancer research, our DNA/RNA Adductomics and Damage Analysis service provides parallel quantification of DNA adducts and oxidative lesions from the same sample set.
Neuroepigenomics and Brain Disorders
5hmC is particularly enriched in the brain — accounting for up to 40% of all modified cytosines in neuronal genomes — and plays critical roles in neurodevelopment, synaptic plasticity, learning, and memory. 5hmC levels change dynamically during neuronal differentiation and aging, and 5hmC dysregulation has been linked to Alzheimer's disease, Parkinson's disease, Huntington's disease, autism spectrum disorders, and major depressive disorder. LC-MS quantification of 5mC/5hmC/5fC/5caC levels in postmortem brain tissue, neuronal cultures, and brain-region-specific samples provides the absolute modification stoichiometry data needed to characterize epigenetic changes in neurological disease models and identify novel therapeutic targets.
Aging, Oxidative Stress, and DNA Damage Research
Accumulation of oxidative DNA damage — measured as 8-oxo-dG — is a hallmark of aging and is elevated in age-related diseases including cardiovascular disease, type 2 diabetes, and neurodegenerative disorders. Our ultra-sensitive LC-MS/MS quantification of 8-oxo-dG (with artifactual oxidation correction) provides the analytical rigor needed for aging research, caloric restriction studies, and evaluation of antioxidant interventions. In parallel, 6mA levels in mammalian DNA have been reported to increase with age and oxidative stress, suggesting a potential role for 6mA as an aging-associated epigenetic mark. Our multi-modality quantification platform enables researchers to simultaneously measure oxidative damage (8-oxo-dG) and epigenetic modifications (5mC, 5hmC, 6mA) from the same genomic DNA sample, providing an integrated view of the aging epigenome and oxidative stress landscape. For dedicated oxidative damage analysis beyond 8-oxo-dG, our Oxidative DNA/RNA Damage Assay service provides expanded lesion coverage.
Environmental Epigenetics and Toxicology
Environmental exposures — including air pollution, heavy metals, endocrine-disrupting chemicals, and dietary factors — can alter DNA methylation patterns and induce oxidative DNA damage, with consequences for disease susceptibility across the lifespan. LC-MS quantification of global DNA modifications provides a mechanistically direct readout of environmentally induced epigenetic and genotoxic effects, complementing locus-specific methylation analysis and transcriptomic profiling in environmental health studies. Our platform supports multi-modification analysis from limited sample quantities, enabling longitudinal cohort studies and developmental exposure models.
Case Study: 2D-UPLC-MS/MS Reveals Altered 5mC and 5hmC Levels in Leukocyte DNA from Breast Cancer Patients
A 2024 study by Linowiecka et al. published in Scientific Reports applied two-dimensional ultra-performance liquid chromatography-tandem mass spectrometry (2D-UPLC-MS/MS) to quantify 5-methyl-2'-deoxycytidine (5mdC) and 5-hydroxymethyl-2'-deoxycytidine (5hmdC) levels in genomic DNA from blood leukocytes and urine samples of breast cancer patients and healthy controls. This work demonstrates the clinical utility of LC-MS-based DNA modification quantification for epigenetic biomarker discovery and validation.
Background: Global DNA methylation (5mC) and hydroxymethylation (5hmC) levels are known to be altered in breast cancer tissues, but whether these epigenetic changes are detectable in peripheral blood leukocyte DNA — and thus suitable as minimally invasive biomarkers — remained unclear. Previous studies using ELISA-based approaches had reported conflicting results, highlighting the need for quantitative LC-MS methods with direct chemical measurement and absolute quantification capability.
Approach: The study enrolled 74 breast cancer patients and 71 age-matched healthy controls. Genomic DNA was extracted from peripheral blood leukocytes and urine sediment cells, enzymatically hydrolyzed to 2'-deoxyribonucleosides, and analyzed by 2D-UPLC-MS/MS with stable isotope dilution. 5mdC and 5hmdC levels were expressed as percentages relative to the total dC (2'-deoxycytidine) pool. Parallel measurements included plasma ascorbate levels (by HPLC) and TET3 expression (by RT-qPCR) to explore mechanistic links between vitamin C status, TET activity, and DNA hydroxymethylation in breast cancer.
Key Findings:
- Leukocyte DNA from breast cancer patients showed significantly lower 5mdC levels compared to healthy controls (3.43 ± 0.45% vs 3.62 ± 0.31% of dC; p = 0.028), consistent with the globally hypomethylated genome characteristic of malignancy
- 5hmdC levels in leukocyte DNA were also reduced in breast cancer patients (0.016 ± 0.007% vs 0.020 ± 0.007% of dC; p = 0.006), providing the first LC-MS-based evidence of global 5hmC reduction in peripheral blood DNA from breast cancer patients
- TET3 mRNA expression was significantly elevated in breast cancer patient leukocytes (p = 0.005), suggesting a compensatory transcriptional response to reduced 5hmC levels or altered TET activity regulation in the cancer context
- Plasma ascorbate levels were lower in breast cancer patients (p = 0.0002), and positive correlations between ascorbate and 5hmdC levels were observed, consistent with ascorbate's known role as a TET enzyme cofactor
- Urinary 5mdC and 5hmdC levels showed distinct patterns that differed from leukocyte DNA, suggesting differential modification turnover and excretion dynamics
- Receiver operating characteristic (ROC) analysis demonstrated that the combination of leukocyte 5hmdC with TET3 expression and ascorbate levels achieved an AUC of 0.79 for breast cancer discrimination
Significance: This study establishes that global 5mC and 5hmC levels in peripheral blood leukocyte DNA — quantified by 2D-UPLC-MS/MS with isotope dilution — are significantly reduced in breast cancer patients and may serve as components of multi-marker epigenetic biomarker panels for cancer detection and monitoring. The work further highlights the mechanistic link between vitamin C status, TET activity, and DNA hydroxymethylation in the cancer context, and demonstrates the analytical sensitivity of LC-MS for detecting subtle (10–20%) modification changes in clinical cohort studies. For researchers investigating DNA modification dynamics in cancer epigenetics or evaluating candidate epigenetic biomarkers in clinical cohorts, LC-MS-based absolute quantification provides the analytical foundation for rigorous, reproducible, and translatable results.
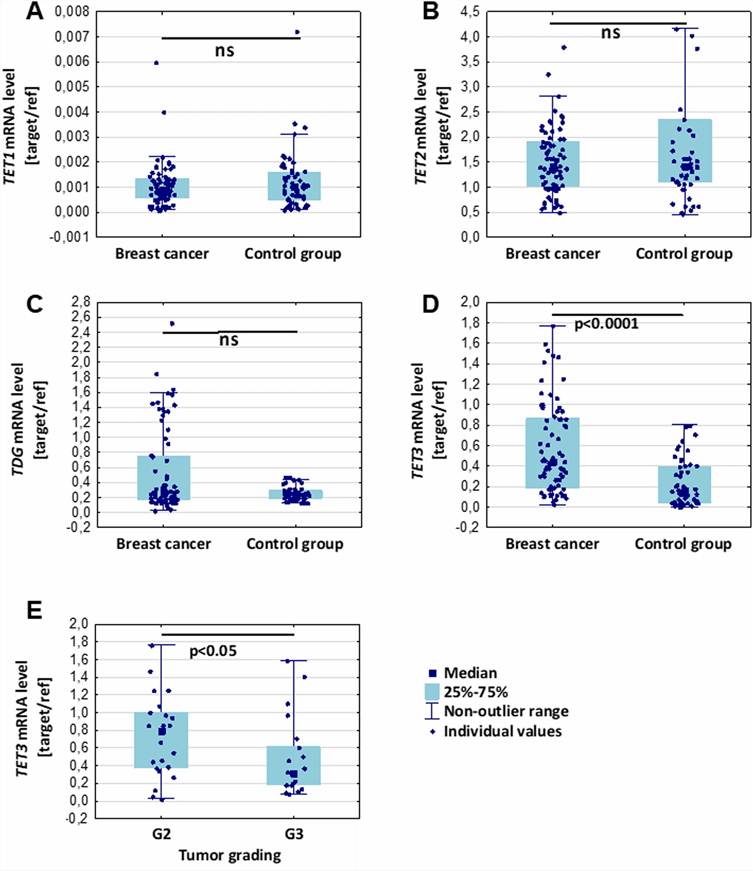
Figure 1 from Linowiecka et al. (2024). Leukocyte DNA 5mdC and 5hmdC levels quantified by 2D-UPLC-MS/MS in breast cancer patients and controls. (a) 5mdC levels (% of dC) — significantly lower in breast cancer patients. (b) 5hmdC levels (% of dC) — significantly reduced in patients. (c) TET3 mRNA expression in leukocytes — elevated in patients. (d) Plasma ascorbate levels — lower in patients, positive correlation with 5hmdC. (e) Multi-marker ROC curve combining 5hmdC, TET3, and ascorbate (AUC = 0.79). (CC BY 4.0)
Representative DNA Base Modification LC-MS Data Outputs
Our DNA base modification quantification pipeline delivers comprehensive data outputs that provide a complete quantitative picture of modification levels and stoichiometry across experimental conditions. Below are representative examples of the key data types included in every project deliverable.
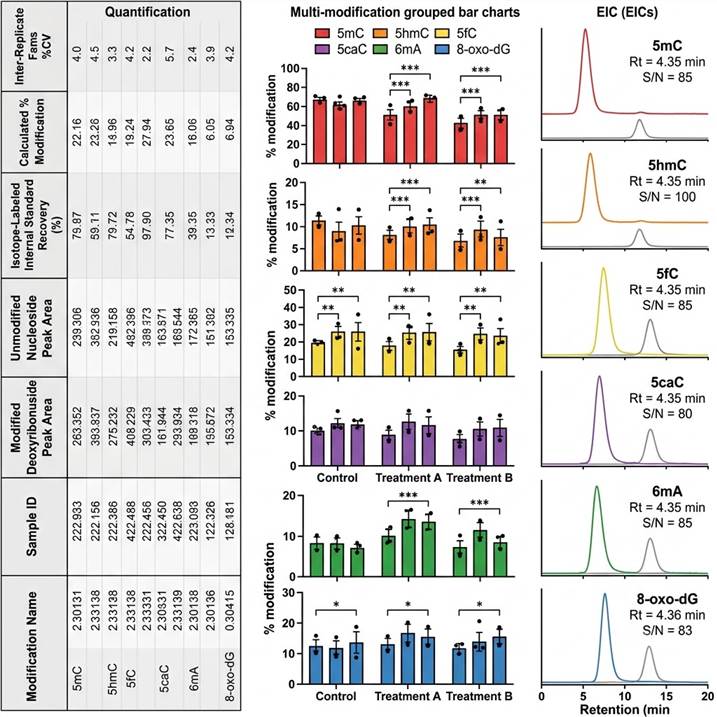
Representative DNA base modification LC-MS data outputs. (Left) Quantification table with modification name, sample identifier, modified and unmodified deoxyribonucleoside integrated peak areas, isotope-labeled internal standard recovery (%), calculated % modification (e.g., %5mC, %5hmC), and inter-replicate %CV. (Center) Multi-modification quantitative comparison across experimental groups — stacked or grouped bar charts showing absolute modification levels for all six analytes with individual data points and statistical significance indicators. (Right) Overlaid extracted ion chromatograms (EICs) for modified deoxyribonucleosides and their corresponding isotope-labeled internal standards demonstrating baseline-resolved chromatographic separation and signal-to-noise ratios.
Every data deliverable includes raw chromatograms for all MRM transitions, calibration curves with linear regression parameters and weighting, batch QC performance report (accuracy, precision, LOD, LOQ, carryover, external standard recovery), and a dedicated scientist consultation session for biological interpretation of modification changes. For longitudinal studies or multi-cohort projects, data are provided with cross-batch normalization and batch effect assessment to ensure data integrity across the entire study. Custom reporting formats, integrated analysis with transcriptomic or proteomic datasets, and publication-ready figure generation are available on request.
Why Choose Our DNA Base Modification Quantification LC-MS Service
Isotope Dilution Absolute Quantification Across All Six Modifications
Our platform employs stable isotope-labeled internal standards for 5mC, 5hmC, 5fC, 5caC, 6mA, 8-oxo-dG, and their corresponding unmodified nucleosides (dC, 5mdC, dA, dG), spiked at the earliest possible step to correct for recovery, matrix effects, and ion suppression. This provides the highest accuracy for absolute modification stoichiometry measurements — essential for detecting the subtle modification changes typical of clinical cohorts and biological models.
Tailored Analytical Conditions for Each Modification Class
Each modification class demands optimized sample processing and analytical conditions. Our protocols incorporate modification-specific adjustments — including antioxidants for 8-oxo-dG quantification (preventing artifactual oxidation), dual-platform MRM/HRAM acquisition for 5fC/5caC detection at trace levels (<0.001% of C), and dedicated 6mA confirmation workflows to exclude potential bacterial DNA contamination artifacts — ensuring data quality for each analyte.
Rigorous Artifact Control for Oxidative Damage Quantification
8-oxo-dG quantification is particularly susceptible to artifactual oxidation of dG during DNA extraction and enzymatic hydrolysis. Our platform implements comprehensive artifact control measures — including antioxidants in all digestion buffers, nitrogen atmosphere for oxygen-sensitive steps, parallel dG-spiked controls to quantify artificial oxidation rates, and correction factors applied to final 8-oxo-dG levels — ensuring that reported values reflect genuine oxidative DNA damage rather than processing artifacts.
End-to-End Service with Expert Epigenetic Consultation
From experimental design consultation through sample processing, LC-MS acquisition, data analysis, and biological interpretation, our team of epigenetics and mass spectrometry experts provides comprehensive support. Every project includes a dedicated scientist consultation session to ensure that DNA modification quantification data are interpreted in the correct epigenetic, DNA damage, and biological context, with integration with other omics datasets available on request.
Related Services
Our DNA base modification quantification service is part of a broader DNA/RNA modification analysis and PTM characterization platform offering complementary analytical capabilities across modification types and research applications.
Frequently Asked Questions
Which DNA base modifications can you quantify by LC-MS?
We routinely quantify six DNA base modifications using validated LC-MS/MS methods: 5-methylcytosine (5mC), 5-hydroxymethylcytosine (5hmC), 5-formylcytosine (5fC), 5-carboxylcytosine (5caC), N6-methyladenine (6mA), and 8-oxo-7,8-dihydro-2'-deoxyguanosine (8-oxo-dG). Custom method development is available for additional DNA modifications, including N4-methylcytosine (4mC), N6-methyldeoxyadenosine (6mdA) in specific sample types, and other oxidative lesions beyond 8-oxo-dG.
What is the difference between LC-MS and sequencing-based methods for DNA modification analysis?
LC-MS provides direct, absolute quantification of modified 2'-deoxyribonucleosides at their native abundance levels, expressed as % modification relative to the unmodified base. Sequencing-based methods (e.g., whole-genome bisulfite sequencing, oxidative bisulfite sequencing, hMe-Seal) provide base-resolution distribution maps across the genome but report relative enrichment signals rather than absolute modification levels. LC-MS is not subject to bisulfite conversion bias, PCR amplification artifacts, antibody cross-reactivity, or GC content-dependent coverage variation that can confound sequencing-based quantification. The two approaches are complementary — LC-MS provides the accurate global modification stoichiometry essential for validating sequencing results and for cross-study comparison, while sequencing provides the genomic distribution context that LC-MS cannot directly provide.
What sample types and amounts are required for DNA base modification LC-MS analysis?
For comprehensive six-modification quantification, we recommend ≥1 µg of purified genomic DNA. For targeted quantification of abundant modifications (5mC, 5hmC), ≥500 ng is typically sufficient. For trace-level modifications (5fC, 5caC, 6mA) in limited samples, we recommend ≥2 µg to ensure detection above LOD. Our platform is compatible with genomic DNA extracted from cultured cells, fresh-frozen and FFPE tissues, laser-capture microdissected specimens, blood leukocytes, plasma cell-free DNA (cfDNA), and urine samples. For cfDNA from liquid biopsies, specialized microscale protocols with reduced sample loss are available.
How do you ensure that 8-oxo-dG measurements reflect genuine oxidative damage and not artifactual oxidation?
Artifactual oxidation of dG to 8-oxo-dG during sample processing is a well-recognized challenge in oxidative DNA damage quantification. Our platform implements multiple control measures: antioxidants (desferrioxamine, butylated hydroxytoluene) in all hydrolysis buffers, nitrogen blanket during incubation steps, minimized handling time, and parallel processing of isotope-labeled dG-spiked control samples to quantify the artifactual oxidation rate for each batch. The measured 8-oxo-dG level is corrected by the artifactual contribution, and both raw and corrected values are reported with the artifactual oxidation rate. Batch acceptance requires artifactual oxidation < 5% of the measured 8-oxo-dG level.
Can you distinguish 5mC from 5hmC, 5fC, and 5caC in a single LC-MS run?
Yes — our optimized C18 reversed-phase LC gradient provides baseline chromatographic resolution of all four cytosine derivatives (5mC, 5hmC, 5fC, 5caC) from each other and from the unmodified dC peak, enabling simultaneous quantification of the complete TET demethylation pathway in a single analytical run. Each modification is identified by its unique retention time, accurate mass, and diagnostic MRM transitions, with 13C- or 15N-labeled internal standards for absolute quantification. This multi-modality approach allows researchers to track the full 5mC → 5hmC → 5fC → 5caC oxidative cascade and compute pathway-level metrics such as the ratio of oxidized to methylated cytosines as a surrogate for TET activity.
How do you ensure 6mA quantification is not confounded by bacterial DNA contamination?
6mA is abundant in bacterial genomes (0.5–2% of A) but present at much lower levels in mammalian DNA (typically 0.001–0.1% of A), making bacterial DNA contamination a critical confounder for 6mA quantification in eukaryotic samples. Our workflow includes multiple measures: parallel processing of no-template controls and DNA extraction blanks to monitor bacterial DNA carryover, 16S rRNA gene qPCR to assess bacterial DNA burden in samples, optional DNase pretreatment for samples from bacteria-rich sources (gut, skin, environmental), and confirmatory analysis using orthogonal MRM transitions specific to 6mdA vs 6mA (distinguishing deoxyribonucleoside from ribonucleoside forms) to exclude RNA contamination artifacts.
Can you quantify DNA base modifications from plasma cell-free DNA?
Yes — we offer specialized protocols for DNA base modification quantification from plasma cell-free DNA (cfDNA). cfDNA is extracted from 1–4 mL of plasma using magnetic bead-based or column-based extraction methods optimized for short DNA fragments (typical cfDNA size ~166 bp). Following extraction and quantification, cfDNA undergoes the same enzymatic hydrolysis and LC-MS/MS analysis pipeline as genomic DNA, with modifications for the lower input mass (typically 1–50 ng cfDNA per mL plasma). For cfDNA analysis, detection sensitivity is prioritized for abundant modifications (5mC, 5hmC), with 5hmC in cfDNA emerging as a promising liquid biopsy biomarker for cancer detection and monitoring.
References
- Linowiecka K, Guz J, Dziaman T, et al. The level of active DNA demethylation compounds in leukocytes and urine samples as potential epigenetic biomarkers in breast cancer patients. Sci Rep. 2024;14:6481.
- Skalska-Bugala A, Siomek-Gorecka A, Banaszkiewicz Z, Olinski R, Rozalski R. Urinary measurement of epigenetic DNA modifications and 8-oxodG as possible noninvasive markers of colon cancer evolution. Int J Mol Sci. 2022;23(22):13826.
- Starczak M, Gawronski M, Wasilow A, Mijewski P, Olinski R, Gackowski D. Dynamic changes in genomic 5-hydroxymethyluracil and N6-methyladenine levels in the Drosophila melanogaster life cycle and in response to different temperature conditions. Sci Rep. 2022;12:17552.
For research use only. Not for use in diagnostic procedures.