Why Single-PTM Analysis Misses the Crosstalk Story
Consider a standard phosphoproteomics experiment on TNFα-stimulated cells. The data reveals 12 phosphorylation sites on the NF-κB pathway protein RelA — an impressive dataset by any measure. In a separate experiment, acetylomics identifies 4 acetylation sites, including Lys-310, a well-characterized acetylation mark that regulates RelA transcriptional activity. The investigator has two rich datasets but a fundamental question remains unanswered: does acetylation at Lys-310 facilitate or block phosphorylation at nearby Ser-311? Does phosphorylation at Ser-276 promote acetylation at Lys-310, or are the two marks mutually exclusive — representing distinct activation states of the transcription factor?
The root cause is technical. Bottom-up proteomics digests proteins into peptides before analysis. A tryptic peptide typically spans 8 to 25 amino acids, carrying at most one or two modification sites. The physical connection between a phosphorylation site on one peptide and an acetylation site on a separate peptide is destroyed during digestion. The mass spectrometer sees two independent pieces of evidence with no molecular connection between them. The result is two lists of modified sites — informative at the site level but silent on the crosstalk question.
Proteoform-level analysis can resolve this, as our PTM Proteoform Mapping service demonstrates for intact protein characterization. However, for broader proteome-scale crosstalk analysis across hundreds to thousands of proteins, the integrative multi-PTM enrichment approach — capturing phosphorylated, acetylated, ubiquitinated, and redox-modified peptides from the same biological sample with matched quantification — provides the throughput necessary to build statistically meaningful crosstalk networks across entire signaling pathways.
Integrative Multi-PTM Enrichment and Quantification
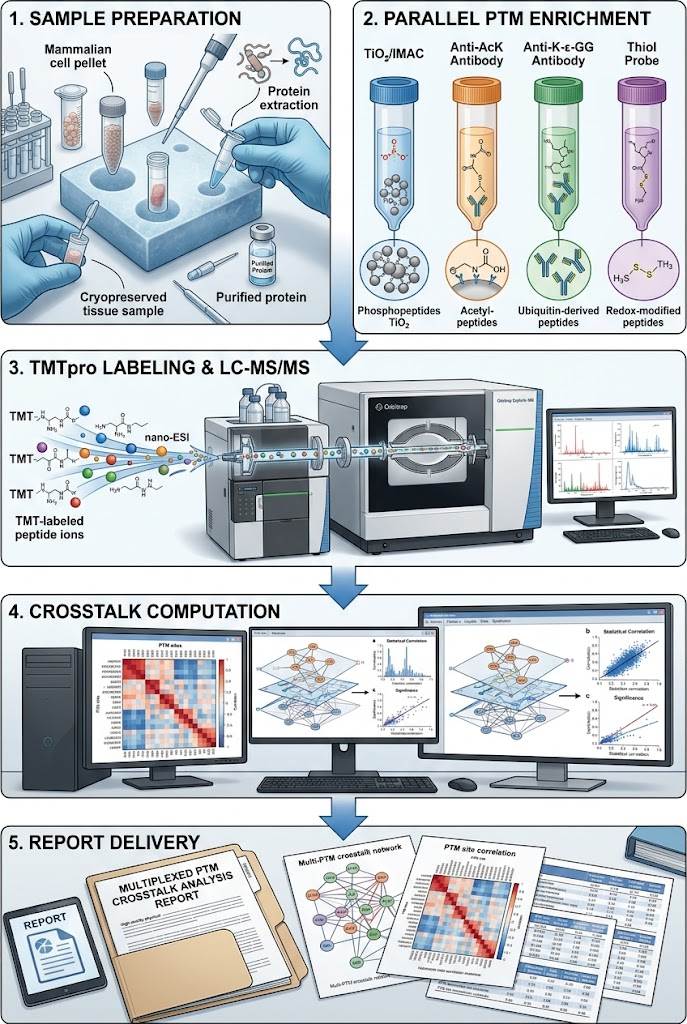
Our crosstalk profiling workflow is built around a core principle: the sample must be processed once, with all PTM types enriched from the same lysate using parallel or sequential enrichment strategies, and quantified using the same mass spectrometry platform under identical acquisition parameters. This ensures that the quantitative measurements of phosphorylation, acetylation, ubiquitination, and redox modifications are directly comparable — a prerequisite for meaningful crosstalk analysis.
The workflow begins with a single protein extraction from your biological sample. Proteins are reduced, alkylated, and digested under conditions optimized to preserve labile modifications such as O-GlcNAc and cysteine oxidation. The resulting peptide pool is split into parallel enrichment channels:
- Phosphopeptide enrichment using TiO₂ or IMAC (immobilized metal affinity chromatography), optimized for mono- and multi-phosphorylated peptides
- Acetylated peptide enrichment using pan-acetyllysine antibody-based immunoprecipitation
- Ubiquitin remnant (K-ε-GG) enrichment using antibody-based capture of the diglycine remnant left after tryptic digestion of ubiquitinated lysines
- Cysteine redox profiling using thiol-reactive probes to capture reversibly oxidized cysteines
Each enriched fraction is labeled with isobaric tandem mass tags (TMTpro 16-plex or 18-plex) for multiplexed quantification, enabling simultaneous measurement across up to 18 samples (biological replicates × conditions × time points) in a single LC-MS/MS run. All fractions are analyzed on Orbitrap-based mass spectrometers operating at resolving powers ≥ 120,000 with real-time database searching for peptide identification.
The matched quantification framework means that a phosphorylation site on Protein X and an acetylation site on the same protein are measured in the identical set of biological samples, using the same normalization strategy, and subjected to the same statistical testing pipeline. When the data shows that phosphorylation at Ser-276 and acetylation at Lys-310 both increase upon TNFα stimulation with a Pearson correlation of 0.89 across biological replicates, that co-regulation signal is grounded in comparable measurements — not an artifact of comparing separate experiments with different batch effects and normalization biases.
For projects requiring targeted validation of specific modification sites identified in the discovery phase, our PTM Site Identification service provides complementary high-confidence site assignment.
Crosstalk Network Construction and PTM Interaction Mapping
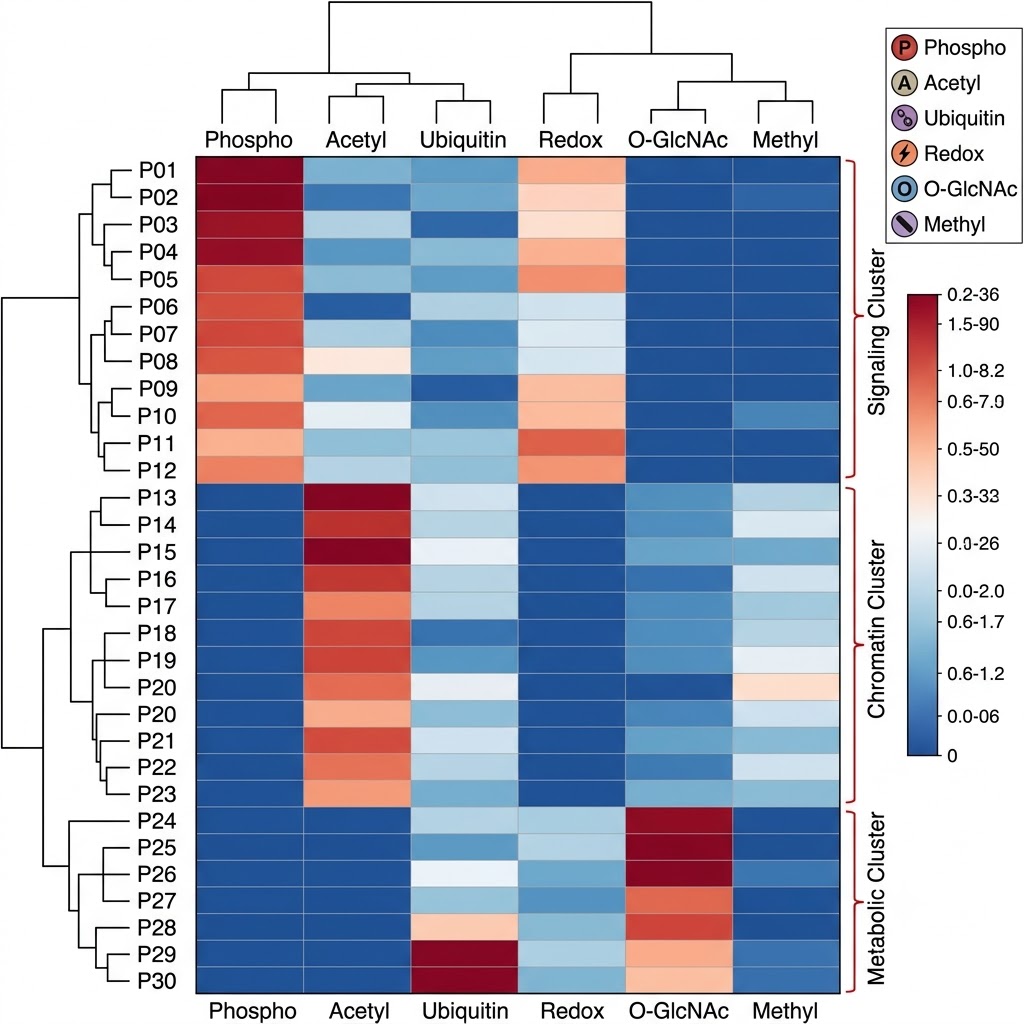
The raw output of integrative multi-PTM enrichment is a quantitative matrix: rows are modification sites, columns are samples, and values are TMT reporter ion intensities. From this matrix, our bioinformatics pipeline constructs crosstalk networks through a three-stage computational workflow.
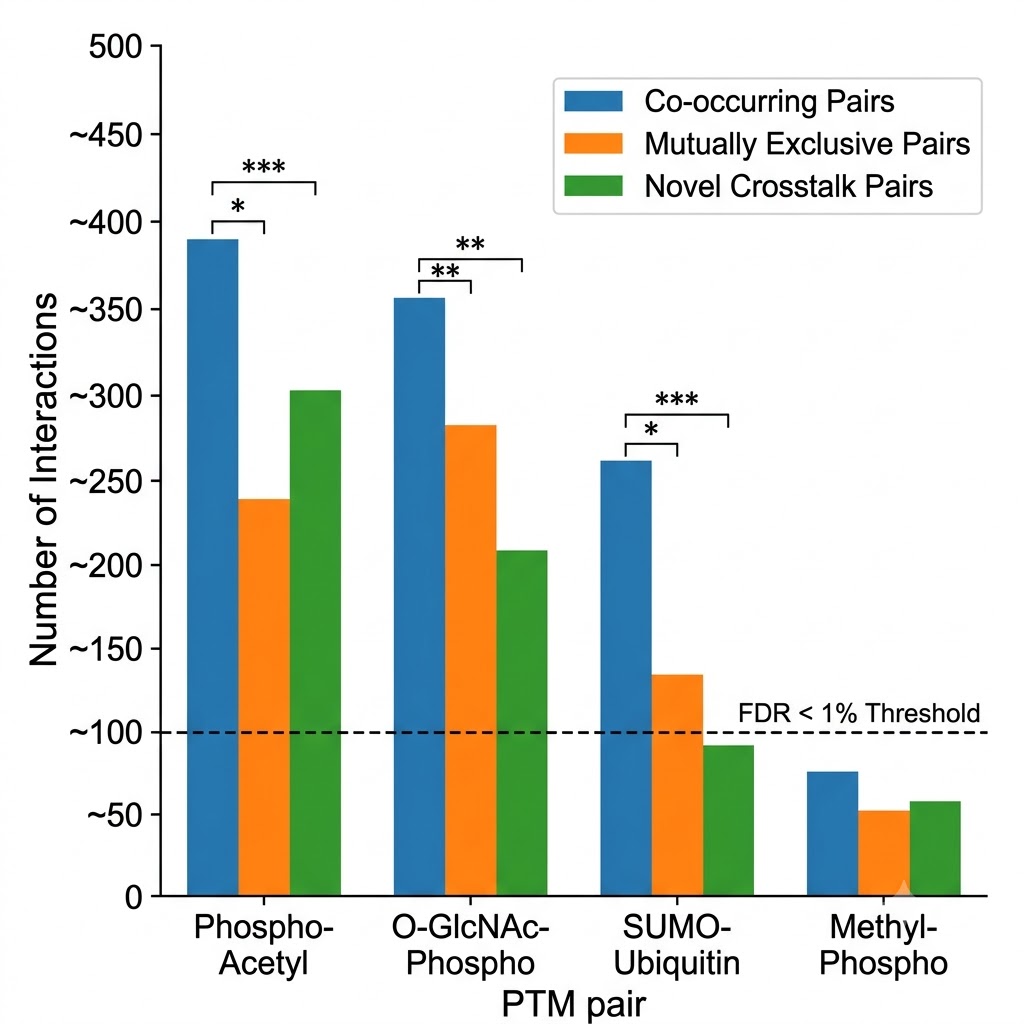
Stage 1: Co-Occurrence Scoring. For every pair of modification sites residing on the same protein, we calculate the Pearson or Spearman correlation coefficient of their abundance patterns across all biological samples. A strong positive correlation (r > 0.7, p < 0.05) between phosphorylation at Site A and acetylation at Site B suggests co-occurrence — these two modifications tend to be present or absent together. A strong negative correlation (r < −0.7) suggests mutual exclusivity — when one modification is present, the other tends to be absent, consistent with competition for the same residue or steric incompatibility.
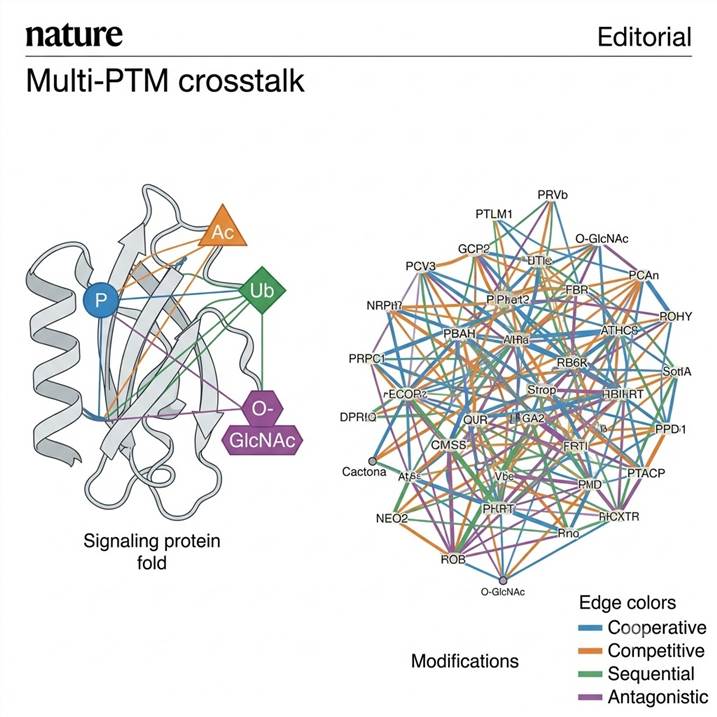
Stage 2: Crosstalk Type Classification. Beyond simple correlation, we classify crosstalk relationships into functional categories: cooperative crosstalk (two modifications co-occur and functionally synergize, e.g. phosphorylation of a kinase activation loop + acetylation of its regulatory domain), competitive crosstalk (two modifications target the same or adjacent residues and cannot coexist, e.g. O-GlcNAcylation and phosphorylation competing for Ser/Thr residues), sequential crosstalk (Modification A creates a recognition motif for the enzyme that installs Modification B, e.g. phosphorylation-dependent ubiquitination), and antagonistic crosstalk (Modification A blocks the enzyme responsible for Modification B without competing for the same residue).
Stage 3: Network Visualization and Pathway Integration. Classified crosstalk pairs are rendered as interactive network diagrams. Protein nodes are connected by edges representing crosstalk relationships, with edge color coding crosstalk type (cooperative, competitive, sequential, antagonistic) and edge thickness reflecting correlation strength. These networks are overlaid onto KEGG and Reactome pathway maps so that crosstalk relationships can be interpreted in their functional pathway context. The final deliverable includes a network data export compatible with Cytoscape for custom visualization, along with publication-ready static network diagrams formatted for manuscript figures.
Key PTM Crosstalk Pairs We Profile
Our service is designed to detect well-characterized crosstalk relationships while remaining open to discovering novel interaction patterns. Below are four representative crosstalk axes that our integrated workflow is optimized to profile, each representing a distinct mechanism of modification interplay.
Phosphorylation-Acetylation Crosstalk: The Histone Code and Beyond
The most intensively studied crosstalk paradigm operates on histone tails, where phosphorylation, acetylation, and methylation combine to regulate chromatin accessibility. Phosphorylation of histone H3 at Ser-10 promotes acetylation at Lys-14 by the GCN5 acetyltransferase, while phosphorylation at Ser-28 facilitates acetylation at Lys-27. Beyond histones, phosphorylation-acetylation crosstalk regulates transcription factors including p53, NF-κB, and STAT proteins — where acetylation of DNA-binding domains modulates the affinity established by phosphorylation-dependent conformational changes. Our Phosphoproteomics and Acetylomics services provide deep individual coverage of these PTM classes for follow-up validation.
O-GlcNAc-Phosphorylation Competition: The Nutrient-Sensing Switch
O-GlcNAc modification and phosphorylation are the two most abundant intracellular PTMs targeting serine and threonine residues. Because they compete for the same hydroxyl group, they cannot coexist on the same residue. This binary switch couples nutrient status (O-GlcNAc levels reflect hexosamine pathway flux) with signal transduction (phosphorylation cascades respond to growth factors and stress). Crosstalk profiling identifies proteins where O-GlcNAc and phosphorylation sites are adjacent or overlapping — revealing proteins whose function may be regulated by the nutrient-sensing O-GlcNAc switch. Our O-GlcNAc analysis service offers dedicated O-GlcNAc enrichment and site mapping for focused studies.
SUMO-Ubiquitin Crosstalk: Protein Stability Control
SUMOylation and ubiquitination both modify lysine residues but drive proteins toward different fates — SUMOylation generally promotes protein stabilization and nuclear localization, while ubiquitination targets proteins for proteasomal degradation. When SUMO and ubiquitin compete for the same lysine residue, the outcome determines protein half-life. Crosstalk profiling identifies proteins where SUMOylation and ubiquitination sites co-localize, revealing regulatory nodes where protein stability may be controlled by the balance between these two modifications. Our Ubiquitylomics service provides complementary deep coverage of ubiquitination.
Methylation-Phosphorylation Crosstalk: Signal Integration
Lysine methylation and phosphorylation regulate each other through steric and charge-based mechanisms. Methylation of Lys-9 on histone H3 blocks phosphorylation at adjacent Ser-10, while phosphorylation at Ser-10 can release HP1 from methylated Lys-9 during mitosis. Beyond histones, methylation-phosphorylation crosstalk on signaling proteins including Akt, ERK, and p53 integrates inputs from methyltransferase and kinase pathways — a logic that crosstalk profiling is uniquely positioned to reveal.
Crosstalk Profiling vs. Conventional Single-PTM Analysis
Choosing between integrated crosstalk profiling and separate single-PTM analyses depends on your research question. The table below compares the approaches across dimensions that directly affect experimental design and biological interpretation.
| Capability |
Multi-PTM Crosstalk Profiling (This Service) |
Individual Phospho + Acetyl Runs |
| Sample origin |
Single lysate, parallel enrichment |
Separate lysates or separate aliquots of same lysate |
| Quantification framework |
Matched TMT multiplexing — directly comparable across PTM types |
Separate TMT experiments — normalization biases prevent direct cross-PTM comparison |
| Co-occurrence detection |
Direct — correlation of matched quantitative data |
Indirect — can only compare site lists; cannot distinguish co-occurrence from independent regulation |
| Mutual exclusivity analysis |
Direct — negative correlations between sites |
Not possible with unmatched datasets |
| Network construction |
Protein-level crosstalk networks with statistical scoring |
List-level overlap analysis only |
| Novel crosstalk discovery |
Open — unexpected co-regulation patterns detected from correlation matrix |
Not possible without matched quantification |
| Throughput per PTM type |
Moderate — parallel enrichment reduces depth per PTM compared to dedicated runs |
High — each enrichment protocol optimized for maximum coverage of one PTM type |
| Best for |
Hypothesis-driven crosstalk studies, mechanism papers, network biology |
Initial PTM site discovery, deep coverage of a single modification type |
The two approaches are complementary. Many research programs begin with individual PTM discovery to identify modified sites on proteins of interest, then use crosstalk profiling to determine which of those sites function in coordinated networks. Our PTM Site Occupancy service provides quantitative occupancy measurements that complement crosstalk analysis by revealing what proportion of each modification site is occupied under your experimental conditions.
Service Workflow
Our Multi-PTM Crosstalk Profiling Service follows a structured, quality-controlled workflow designed for reproducibility and statistical rigor.
Step 1: Sample Submission and Protein Extraction
You provide your biological samples following our preparation guidelines. Upon receipt, we extract proteins under conditions compatible with PTM preservation — phosphatase inhibitors, deacetylase inhibitors, and thiol-blocking agents are included to prevent post-lysis modification changes. Protein concentration and integrity are assessed by BCA assay and SDS-PAGE.
Step 2: Parallel PTM Enrichment
The protein digest is split into parallel enrichment channels. Phosphopeptides are captured by TiO₂ or IMAC. Acetylated peptides are enriched by pan-acetyllysine antibody immunoprecipitation. Ubiquitin remnant peptides are captured by K-ε-GG antibody. Cysteine redox states are profiled using thiol-reactive probe labeling. Each enrichment is performed under conditions validated for specificity and recovery.
Step 3: TMT Labeling and LC-MS/MS
Each enriched peptide fraction is labeled with TMTpro reagents, pooled, and fractionated by high-pH reversed-phase chromatography to reduce sample complexity. Fractions are analyzed by nanoLC coupled to an Orbitrap mass spectrometer operating in data-dependent acquisition (DDA) mode with real-time database searching.
Step 4: Crosstalk Computation
Raw MS data are processed through MaxQuant or Proteome Discoverer for peptide identification and TMT reporter ion quantification. The quantitative matrix is then analyzed by the crosstalk pipeline: site-level correlation, crosstalk type classification, and network construction.
Step 5: Report Delivery
You receive a comprehensive project report containing crosstalk network diagrams, co-occurrence heatmaps, differential crosstalk analysis between conditions, pathway-level integration, and all raw and processed data files.
Sample Requirements
The table below summarizes sample types, quantities, and handling guidelines for Multi-PTM Crosstalk Profiling. For projects comparing multiple conditions, all samples from a given comparison should be prepared using identical protocols and submitted as a single batch to minimize batch effects.
| Sample Type |
Minimum Amount |
Recommended Amount |
Handling Notes |
| Cell Pellet (mammalian) |
5 × 10⁶ cells |
1 × 10⁷ cells |
Wash 3× with cold PBS, snap-freeze in liquid nitrogen, store at -80°C. Include phosphatase/protease inhibitors during lysis. |
| Tissue |
30 mg wet weight |
50 mg wet weight |
Snap-freeze immediately after collection. Keep on dry ice during shipping. Avoid freeze-thaw cycles. |
| Purified Protein Complex (IP eluate) |
20 µg |
50 µg |
Provide in volatile buffer (e.g., ammonium bicarbonate). Include buffer composition details. |
| Subcellular Fraction |
50 µg total protein |
100 µg total protein |
Confirm fraction purity by western blot before submission. |
All samples must be shipped on dry ice with appropriate labeling and documentation. For specialized sample types not listed above, contact our scientific team to discuss feasibility.
Research Applications
Multi-PTM crosstalk profiling provides insights spanning signal transduction, epigenetics, metabolic regulation, and drug mechanism research.
Signal Transduction Network Mapping
Multi-PTM crosstalk profiling directly addresses the core shortcoming of traditional phosphoproteomics in signaling research: the inability to determine whether two phosphorylation events on the same kinase represent sequential activation steps, parallel inputs from different upstream pathways, or competing regulatory signals. By measuring phosphorylation alongside acetylation, ubiquitination, and redox modifications from the same samples, our service reveals the full regulatory logic operating on signaling proteins — not just the phospho-centric view. For projects integrating kinase activity data, our Kinase-Substrate Network service provides complementary kinase-substrate relationship mapping.
Epigenetic Regulation and Chromatin Biology
The combinatorial histone code — where specific patterns of acetylation, methylation, phosphorylation, and ubiquitination on histone tails determine chromatin state — is the canonical example of PTM crosstalk. Our integrated workflow captures multiple histone PTM types simultaneously, enabling direct detection of co-occurring histone marks and the statistical evaluation of which combinations are enriched under your experimental conditions. For focused histone studies, our Histone PTM Analysis service provides dedicated histone enrichment and deep coverage.
Metabolic Regulation and Nutrient Sensing
O-GlcNAcylation — a modification that uses the nutrient-sensing metabolite UDP-GlcNAc as its donor substrate — competes directly with phosphorylation at serine and threonine residues. This competition links cellular metabolic state to signal transduction. Crosstalk profiling identifies proteins where O-GlcNAcylation and phosphorylation patterns shift in opposite directions under changing nutrient conditions, revealing metabolic checkpoints in signaling networks.
Drug Mechanism of Action and Resistance
When a kinase inhibitor blocks phosphorylation of its target, what happens to the broader PTM landscape? Compensatory activation of alternative pathways can manifest as changes in acetylation, ubiquitination, or redox-sensitive cysteines that single-PTM studies miss. Crosstalk profiling provides a panoramic view of the PTM response to drug treatment, identifying resistance mechanisms and off-target effects that operate through modification crosstalk rather than through protein abundance changes.
Case Study: Integrative Multi-PTM Profiling in Cytokine-Treated Pancreatic Beta Cells
A landmark study by Gluth, Li, Gritsenko, and colleagues (2024, Molecular & Cellular Proteomics) demonstrates the power and necessity of integrative multi-PTM analysis — establishing the conceptual and technical framework that directly informs our Crosstalk Profiling service design.
Background
The research team, led by scientists at Pacific Northwest National Laboratory, tackled a central challenge in systems biology: cytokines such as IL-1β and IFNγ trigger complex signaling cascades in pancreatic beta cells that involve coordinated changes across multiple PTM types, but prior studies had examined these PTMs in isolation. Without an integrated view, the functional interplay between redox-sensitive cysteines, phosphorylation-driven signaling, and acetylation-mediated transcriptional regulation remained opaque.
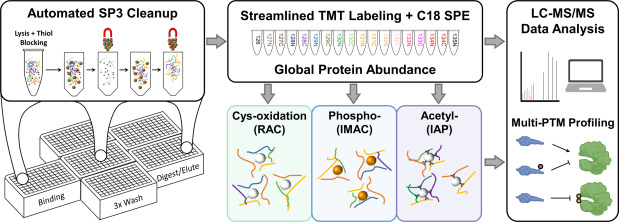
Methods
The team developed an integrated SP3 (single-pot, solid-phase-enhanced sample preparation) workflow that enabled parallel quantification of four molecular dimensions — total proteome, cysteine thiol oxidation, phosphoproteome, and acetylome — from a single sample preparation. Peptides were labeled with TMTpro 16-plex reagents and analyzed by high-resolution LC-MS/MS on an Orbitrap platform. INS-1E pancreatic beta cells were treated with IL-1β + IFNγ over a time course, and each time point was analyzed in biological triplicate, generating a matched multi-PTM quantitative dataset spanning all four dimensions.
Key Results
The integrative analysis identified coordinated regulation across PTM layers that would have been invisible in single-PTM experiments. Redox-sensitive cysteines in NF-κB pathway components showed oxidation changes that correlated with phosphorylation changes on the same proteins, revealing a redox-phosphorylation crosstalk mechanism. Acetylation changes on histones and transcription factors tracked with phosphorylation-driven signaling events, providing a molecular bridge between cytoplasmic kinase cascades and nuclear transcriptional responses. The study's Figure 5 presents a summary view of multi-PTM analysis results across the time course, illustrating how integrating proteome, redox, phospho, and acetyl data layers reveals regulatory patterns that no single layer captures alone.
Conclusion
The study demonstrated that integrating multiple PTM dimensions provides mechanistic insight unattainable through parallel single-PTM experiments. Pathway-level analysis revealed that NF-κB and JAK-STAT signaling components are regulated through coordinated changes in cysteine oxidation and phosphorylation — a crosstalk mechanism that would be missed by any single-PTM approach. The workflow and computational framework established in this study directly inform our Crosstalk Profiling service, which applies the same integrative logic to your biological questions.
Frequently Asked Questions
What is the difference between multi-PTM crosstalk profiling and running individual PTM analyses separately?
Individual PTM analyses — a phosphoproteomics experiment plus a separate acetylomics experiment — generate two independent site lists measured under different normalization conditions. You can compare which proteins appear in both lists, but you cannot statistically determine whether phosphorylation at Site A and acetylation at Site B co-occur, compete, or are regulated independently. Crosstalk profiling enriches all PTM types from a single sample and quantifies them with matched TMT labeling, enabling direct correlation and co-occurrence analysis across modification types.
Which PTM types can you profile together in one crosstalk experiment?
Our standard panel includes phosphorylation, acetylation, ubiquitination (K-ε-GG), and cysteine redox modifications. We also support custom panels incorporating SUMOylation, methylation, O-GlcNAcylation, succinylation, and other PTM types depending on your biological question. The maximum number of PTM types in a single experiment is determined by sample amount — each enrichment consumes peptide material, and we recommend at least 1 mg of total peptide per PTM type.
How do you determine whether two PTMs co-occur or are mutually exclusive?
We calculate Pearson and Spearman correlation coefficients for every pair of modification sites on the same protein across all biological replicates and conditions. Strong positive correlation (r > 0.7) indicates co-occurrence — the two modifications tend to be present or absent together. Strong negative correlation (r < −0.7) indicates mutual exclusivity. These correlations are statistically tested (p < 0.05 after multiple testing correction), and the full correlation matrix is provided in your project report.
Can you detect novel or unexpected crosstalk pairs?
Yes — this is a core strength of the approach. Because we compute correlations across all detected modification sites without restricting the analysis to known crosstalk pairs, entirely novel relationships emerge from the data. A phosphorylation site on a kinase that strongly co-varies with an acetylation site on a transcription factor, for instance, may reveal a previously unrecognized regulatory connection that becomes a high-priority target for follow-up validation.
What statistical confidence do you provide for crosstalk assignments?
We control false discovery at multiple levels. Peptide and site identification FDR is controlled at 1% using target-decoy searching. Crosstalk pair significance is assessed using correlation p-values with Benjamini-Hochberg multiple testing correction. For each reported crosstalk pair, we provide the correlation coefficient, p-value, adjusted p-value, and the number of observations contributing to the correlation.
Is the data publication-ready?
Yes. The project report includes annotated crosstalk network diagrams, co-occurrence heatmaps with hierarchical clustering, differential crosstalk volcano plots between conditions, and all quantitative tables formatted with accession numbers, gene names, site positions, and modification types. Raw data files (RAW, mzML, and search engine outputs) are provided alongside processed results. Our methods section is written to the level of detail expected by proteomics journals, and we support manuscript figure preparation upon request.
References
- Integrative Multi-PTM Proteomics Reveals Dynamic Global, Redox, Phosphorylation, and Acetylation Regulation in Cytokine-Treated Pancreatic Beta Cells — Gluth A, Li X, Gritsenko MA, Gaffrey MJ, Kim DN, Lalli PM, Chu RK, Day NJ, Sagendorf TJ, Monroe ME, Feng S, Liu T, Yang B, Qian WJ, Zhang T. Molecular & Cellular Proteomics, 2024, 23(12):100881.
- Decoding Post-Translational Modification Crosstalk With Proteomics — Leutert M, Entwisle SW, Villén J. Molecular & Cellular Proteomics, 2021, 20:100129.
- Elucidating Crosstalk Mechanisms Between Phosphorylation and O-GlcNAcylation — Leney AC, El Atmioui D, Wu W, Ovaa H, Heck AJR. Proceedings of the National Academy of Sciences, 2017, 114(35):E7255-E7261.
- Crosstalk Between Phosphorylation and O-GlcNAcylation: Friend or Foe — van der Laarse SAM, Leney AC, Heck AJR. The FEBS Journal, 2018, 285(17):3152-3167.