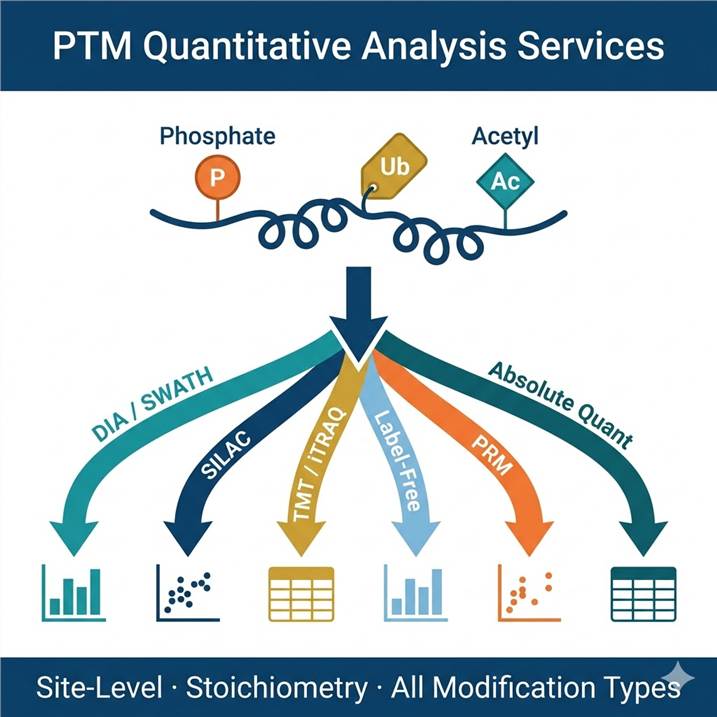
Why Quantitative PTM Analysis — Not Just Identification
Identifying that a modification site exists is the beginning of a PTM project, not the end. The biologically meaningful questions — Does this site change in response to drug treatment? Does phosphorylation stoichiometry increase as cells progress through the cell cycle? Which ubiquitination events are gained during PROTAC-induced degradation, and which are constitutive background? — require quantitative modification data: site-level abundance ratios between conditions, stoichiometry estimates, and statistical confidence values for each change.
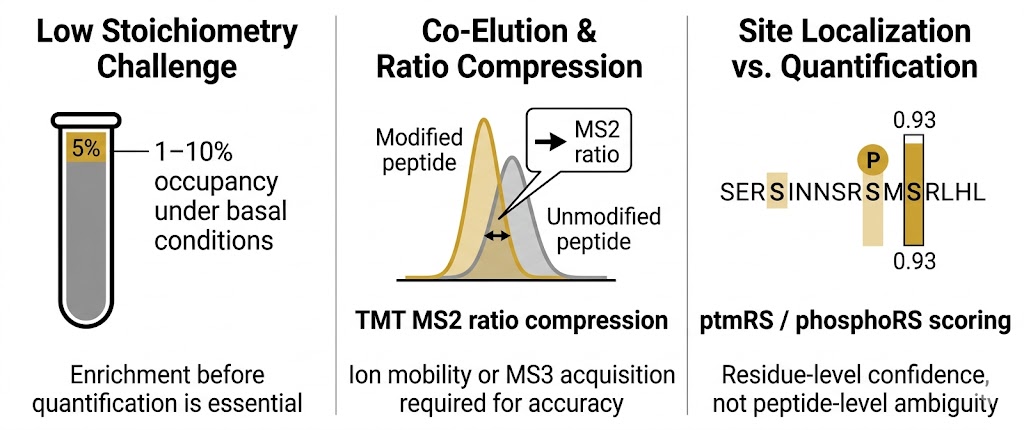
PTM quantification is technically more demanding than protein abundance quantification for three reasons:
Low Stoichiometry Challenge
Most modification sites are occupied on only a fraction of the protein population at any given time — often 1–10% stoichiometry for phosphorylation under basal conditions, lower for many emerging acyl marks. Modified peptides must first be enriched from a 10–100-fold excess of unmodified counterparts before quantification can yield meaningful signal-to-noise. Enrichment efficiency and specificity therefore directly determine the quality of every quantitative measurement that follows.
Co-Elution & Ratio Compression
Modified peptides with identical sequences but different modification states may co-elute during LC separation, creating chimeric spectra that inflate or compress measured abundance ratios — a particular challenge for isobaric labeling (TMT/iTRAQ) strategies. Ion mobility separation (4D/diaPASEF), MS3-based TMT acquisition, or SILAC avoids this by separating co-eluting precursors either in the gas phase or by mass shift, delivering more accurate fold-change measurements at low stoichiometry.
Site Localization vs. Quantification
Quantifying a modified peptide intensity and correctly localizing the modification to a specific residue are separate analytical problems. A peptide with three Ser/Thr residues and one phosphorylation can produce a measured abundance ratio that does not correspond to any single site — it could reflect a mixture of three phosphoforms with different biological origins. We apply site localization scoring (ptmRS, phosphoRS) and report site localization probability alongside every quantitative measurement, ensuring your fold-change data maps to residue-level biology, not peptide-level ambiguity.
Choosing the Right Quantification Strategy
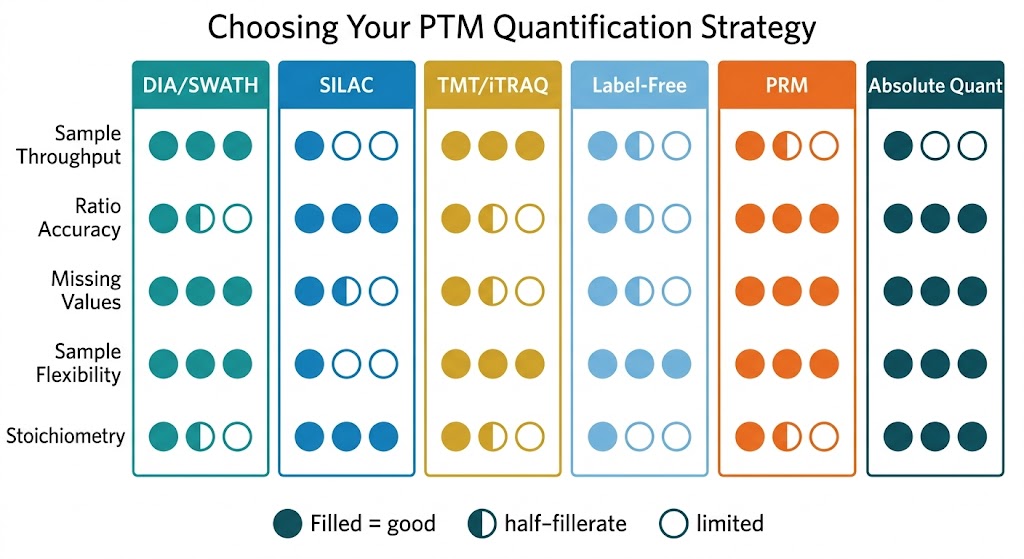
The quantification strategy determines what you can measure, how many samples you can compare, and what sources of bias affect your data. The table below summarizes the key performance characteristics across all strategies we offer — use it to identify the best match for your experimental design, then follow the links to the dedicated service page for full workflow details.
| Strategy |
Multiplexing |
Best For |
Key Advantage |
Key Limitation |
Sample Types |
| DIA / SWATH |
Unlimited (sequential) |
Large cohorts, biomarker discovery, low missing values across ≥10 samples |
Lowest missing-value rate; reproducible across hundreds of samples; stoichiometry calculable |
Requires spectral library or deep learning-based search (DIA-NN); higher computational cost |
Any — cells, tissue, plasma, FFPE, primary cells |
| SILAC |
2–3 conditions |
Drug MoA studies, cell line signaling, highest ratio accuracy |
Lowest ratio noise; no ratio compression; stoichiometry from heavy/light + protein ratios |
Requires actively dividing cells; 5–7 day labeling period; not applicable to tissue or primary cells |
Dividing cell lines only |
| TMT / iTRAQ |
Up to 16-plex (TMT) |
Time-course, dose-response, multi-condition batch studies |
High throughput; minimal batch effects within a plex; deep coverage with fractionation |
Ratio compression at MS2 level; MS3 acquisition required for accuracy; higher reagent cost |
Any — cells, tissue, FFPE, plasma after protein extraction |
| Label-Free (LFQ) |
Unlimited (sequential) |
Primary cells, tissue, biofluids, any sample where labeling is impractical |
No labeling reagents; widest sample type compatibility; highest identification numbers |
Highest sensitivity to sample preparation variability; requires ≥3 biological replicates per condition |
Any — cells, tissue, plasma, biofluids, primary cells |
| PRM (targeted) |
~10–100 sites per run |
Validation of discovery-phase candidates; defined site monitoring in large cohorts |
Highest sensitivity and selectivity for defined sites; defined LOD/LOQ; reproducible across cohorts |
Requires predefined target site list; not discovery mode; needs synthetic peptide standards |
Any — optimal for biofluids and clinical research samples |
| Absolute Quantification |
Site-specific |
Stoichiometry in defined units (fmol/μg protein, copies/cell), regulatory threshold studies |
True molar quantities; site occupancy as a percentage; calibration curve with defined LOQ |
Requires stable-isotope-labeled standard peptides per site; higher cost per site |
Any — cells, tissue, plasma |
PTM Quantification Sub-Services
Each sub-service below is a dedicated quantification workflow designed for a specific experimental context. All are available as standalone projects or as the quantification phase following our Global PTM Profiling or PTM Site Identification discovery projects.
Our recommended default for most quantitative PTM projects. DIA systematically acquires MS/MS spectra for all precursor ions within defined isolation windows — eliminating the stochastic undersampling of DDA and producing a highly reproducible quantitative matrix with very low missing values even across large sample cohorts. We offer standard DIA and 4D-diaPASEF (Bruker timsTOF Pro) configurations, the latter adding trapped ion mobility separation to reduce co-fragmentation interference in complex enriched samples.
Typical PTM applications: Phosphoproteomics across 20–200 samples; ubiquitylomics cohort studies; acyl mark quantification with low missing values across time points.
Expected depth: 10,000–30,000+ phosphosites (cells); 5,000–15,000 K-ε-GG sites (ubiquitylomics); 5,000–10,000 acetylation sites.
The gold standard for two-condition PTM comparisons in actively dividing cell lines, delivering the lowest ratio noise of any quantification strategy for modification sites. Heavy (13C6 Lys / 13C6,15N4 Arg) and light-labeled cell populations are mixed after lysis at a defined protein ratio — eliminating all downstream sample preparation variability from the comparison. Ratio accuracy for phosphosites in SILAC significantly outperforms TMT at MS2 level, making it the preferred strategy for kinase inhibitor MoA studies where accurate fold-change at individual signaling nodes is critical.
Typical applications: Kinase inhibitor phosphoproteomics; drug treatment phospho-signaling; PROTAC ubiquitylation dynamics; SILAC-pulse for modification turnover studies.
Stoichiometry: Phosphorylation site occupancy calculable from heavy/light phosphopeptide vs. total protein SILAC ratios.
Isobaric chemical labeling enabling up to 16-condition multiplexing (TMT16) within a single LC-MS/MS run — the highest-throughput PTM quantification strategy available. All conditions share the same peptide backbone, so fractionation depth is maximized without increasing sample complexity. TMT is particularly valuable for time-course experiments, multi-dose comparisons, and projects where >3 conditions must be compared with controlled batch effects. We apply MS3 acquisition (SPS-MS3) where ratio accuracy for low-abundance modified peptides is critical, and report compression-corrected ratios.
Typical applications: Histone PTM time-course; multi-drug dose-response phosphoproteomics; 16-condition multi-tissue acylomics studies.
Quantitative PTM analysis without any chemical labeling requirement — applicable to the broadest range of sample types including primary cells, patient-derived tissue, clinical biospecimens, FFPE sections, and organisms that cannot tolerate isotope incorporation. MaxLFQ intensity normalization accounts for sample-to-sample variation; match-between-runs (MBR) reduces missing values across samples. Label-free delivers the highest PTM identification numbers of any strategy, at the cost of higher sensitivity to sample preparation reproducibility — requiring strict CV monitoring and ≥3 biological replicates per condition.
Typical applications: Tissue phosphoproteomics; primary cell acylomics; clinical cohort PTM studies; any non-cell-culture sample.
Parallel reaction monitoring (PRM) transitions the PTM workflow from discovery into targeted validation — monitoring defined precursor → product ion pairs for specific modified peptides with the highest available selectivity and sensitivity. PRM can detect modification events that global discovery workflows miss at low sample input, and provides reproducible, site-specific quantification suitable for large clinical research cohorts where discovery depth is not required. Synthetic heavy isotope-labeled peptide standards (SIS peptides) can be incorporated for absolute quantification of defined sites.
Typical applications: Validation of top-ranked phosphosites from DIA discovery; targeted ubiquitylation site monitoring in drug studies; biomarker confirmation in clinical research samples.
Stable isotope dilution (SID) mass spectrometry for true molar quantification of modified peptides — reporting site occupancy as a stoichiometric percentage, copy number per cell, or concentration in fmol/μg protein with a calibration curve and defined LOD/LOQ. Requires synthesis of heavy isotope-labeled standard peptides for each target site. Essential when you need to know not just whether a site changes between conditions, but what fraction of the total protein population is modified at any given time — a critical parameter for understanding the functional significance of a regulatory PTM.
Typical applications: Phosphorylation stoichiometry in cell cycle studies; histone mark occupancy across epigenetic drug treatment; ubiquitin site copy number in degrader characterization.
Integrated quantitative analysis of two or more modification types from the same protein digest — delivering coordinated site-level abundance data for both modifications under the same experimental conditions. Enables statistical identification of co-regulated sites (e.g., proteins where phosphorylation and ubiquitination are simultaneously up-regulated, indicating phosphodegron-driven degradation), cross-modification correlation analysis, and pathway-level reconstruction of multi-PTM regulatory networks. Available for phospho + ubiquitin, phospho + acetyl, acyl mark panels, and custom combinations.
Dedicated service for measuring the fractional stoichiometry of modification at a defined site — the proportion of the protein population that carries the modification — rather than raw peptide intensity. Occupancy quantification requires parallel measurement of both modified and unmodified counterpart peptides under conditions normalized for protein expression changes. This approach is essential for regulatory PTMs where the biological threshold for function may be at a specific occupancy level, not just detectable presence, and for distinguishing stoichiometric from sub-stoichiometric modification events.
Quantitative Analysis by Modification Type
Each core modification type has a dedicated quantitative workflow service optimized for the enrichment chemistry, instrument platform, and bioinformatics requirements of that specific modification. These modification-specific quantitative services all apply one of the above quantification strategies appropriate to the biological question.
DIA, SILAC, or TMT phosphoproteomics with IMAC/TiO2 enrichment, 10,000–50,000+ phosphosites, KSEA kinase network analysis.
SILAC or label-free diGLY (K-ε-GG) ubiquitylomics with NEM-stabilized lysis, 5,000–15,000 sites, E3 substrate network annotation.
N- and O-glycosite quantification by DIA or TMT — glycan site occupancy and glycoform distribution across conditions.
Pan-acetyllysine antibody enrichment with DIA or TMT quantification — histone marks, metabolic enzyme acetylation, stoichiometry measurement.
Histone-specific acid extraction, derivatization, dedicated LC-MS/MS with quantitative measurement of H3, H4, H2A, H2B marks including combinatorial co-occurrence analysis.
Multi-acyl mark quantification panel — acetyl, crotonyl, succinyl, lactyl, propionyl, malonyl, glutaryl in a coordinated multi-enrichment workflow.
Non-enzymatic glycation site quantification for diabetes research and AGE characterization — HbA1c-level and site-specific glycation measurement by LC-MS/MS.
Quantitative mapping of cysteine oxidation states — reduced, sulfenic, S-glutathionylated, S-nitrosylated — with differential alkylation and isoTOP-ABPP strategies.
Quantitative PTM Analysis Workflow
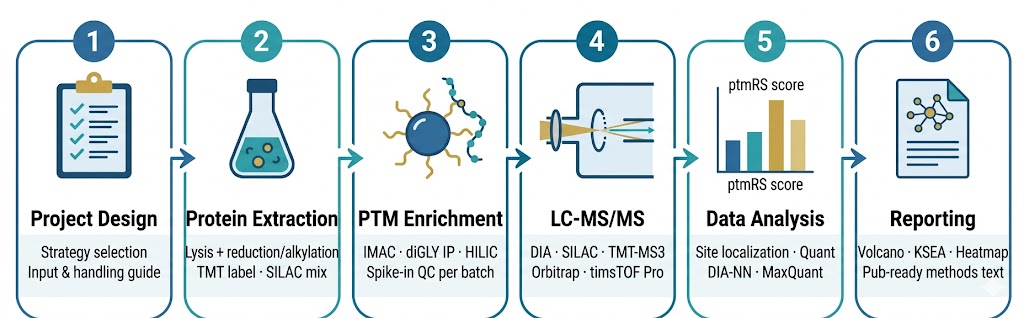
Step 1 — Project Design & Sample QC
We review your modification type, sample type, number of conditions, biological replicates, and scientific question — then recommend the optimal quantification strategy with explicit reasoning about the tradeoffs. Required sample inputs, pre-collection handling requirements (phosphatase inhibitors, NEM for ubiquitylomics, trapping reagents for redox PTMs), and shipping conditions are confirmed in writing before you collect or ship samples. On receipt, samples are assessed for protein yield, integrity, and inter-replicate variability before processing begins — samples that fail QC thresholds are flagged and discussed before any project resources are committed.
Step 2 — Protein Extraction & Digest
Cells or tissue are lysed under conditions validated for the target modification — denaturing urea lysis with NEM for ubiquitylomics; non-denaturing lysis for interaction-preserving workflows; acid extraction with propionylation derivatization for histone modifications. Following reduction (DTT), alkylation (chloroacetamide), and trypsin digestion, peptide yield and missed cleavage rate are measured. For TMT projects, isobaric labeling is performed at the peptide level before pooling, with label incorporation efficiency verified by LC-MS spot check. For SILAC projects, heavy and light lysates are mixed at 1:1 protein mass ratio verified by BCA.
Step 3 — Modification-Specific Enrichment
Enrichment chemistry is matched to the modification: Fe3+-IMAC or TiO2 (phosphopeptides); anti-K-ε-GG diGLY antibody IP at 4 °C (ubiquitylomics); HILIC or lectin affinity (glycopeptides); pan-acyl-lysine antibodies (acetyl, crotonyl, succinyl, lactyl); acyl-RAC (palmitoylation); differential alkylation (redox cysteines). A pre-enrichment aliquot (2–5%) is retained for total protein quantification to enable occupancy calculations. Enrichment efficiency is monitored per batch using spike-in modified peptide standards — we report enrichment specificity (percentage modified peptides in eluate) as a QC metric alongside the final dataset.
Step 4 — LC-MS/MS Acquisition
Platform selection is matched to the quantification strategy and modification type. DIA/SWATH: Thermo Orbitrap Fusion Lumos or Q Exactive HF-X in variable isolation window DIA mode; diaPASEF on Bruker timsTOF Pro for 4D-DIA with ion mobility separation. SILAC: DDA on Orbitrap Fusion Lumos with HCD fragmentation. TMT: MS3 acquisition on Orbitrap Fusion Lumos (SPS-MS3) or high-field Q Exactive for ratio accuracy at low modified peptide abundance. PRM: scheduled parallel reaction monitoring on Q Exactive HF-X with synthetic SIS peptide co-elution monitoring. Instrument QC includes mass accuracy checks, iRT standard injection, and spray stability verification before every run.
Step 5 — Data Analysis & Site Quantification
Database searches use MaxQuant (SILAC/LFQ), Proteome Discoverer (TMT), or DIA-NN (DIA/SWATH) with modification-appropriate variable modifications (phospho, GlyGly, acetyl, etc.), 1% FDR at peptide and protein level, and ptmRS or phosphoRS site localization scoring. Site-level quantification matrices are generated with normalized intensities or ratios. Statistical analysis applies t-test or limma (for small sample sizes) with Benjamini-Hochberg FDR correction; volcano plots, MA plots, and heatmaps are generated for all regulated sites. For SILAC and TMT projects, protein-level ratios are used to correct modification ratios for protein abundance changes — delivering modification-intrinsic fold-changes.
Step 6 — Biological Interpretation & Deliverables
Regulated modification sites are annotated against PhosphoSitePlus (phospho), UbiNet (ubiquitin), or relevant modification databases. Kinase-substrate enrichment analysis (KSEA) is applied to phosphoproteomics datasets. GO, KEGG, and Reactome pathway enrichment is performed on proteins with significantly regulated modification sites. For multi-PTM projects, crosstalk analysis between modification types is delivered as a correlation matrix and network visualization. Deliverables: raw data files, modified peptide identification and quantification tables, site-level statistical results, bioinformatics figures (volcano, heatmap, KSEA, network), sample QC report, enrichment QC metrics, and a comprehensive project report with publication-ready methods text.
Representative Quantitative PTM Data
The following illustrate the types of quantitative outputs generated by our DIA, SILAC, and TMT workflows for phosphoproteomics — including differential site analysis, kinase activity inference, and stoichiometry distribution outputs that are standard deliverables in every quantitative PTM project.
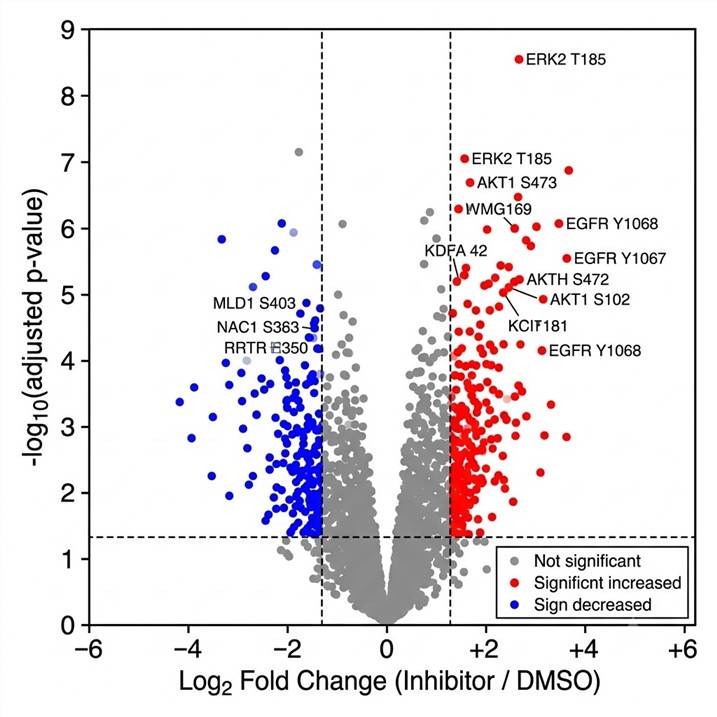
Fig. 1 — Volcano plot of DIA-quantified phosphorylation sites in kinase inhibitor-treated vs. DMSO control cells. Each point represents a unique phosphosite; red = significantly increased phosphorylation (padj ≤0.05, log2FC ≥1); blue = significantly decreased. Dashed lines denote FC and significance thresholds. Site annotations (gene name + residue) for top-regulated sites are displayed.
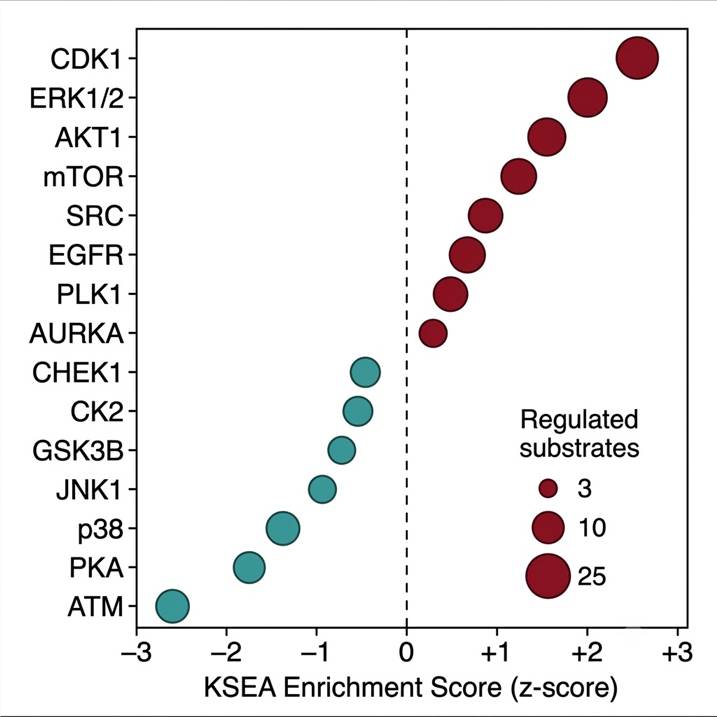
Fig. 2 — Kinase-substrate enrichment analysis (KSEA) from quantitative DIA phosphoproteomics. Each bubble = one kinase; bubble size = number of significantly regulated substrates; x-axis = KSEA enrichment z-score (positive = kinase activated, negative = suppressed). Inferred directly from site-level phosphorylation fold-changes using PhosphoSitePlus kinase-substrate annotations.
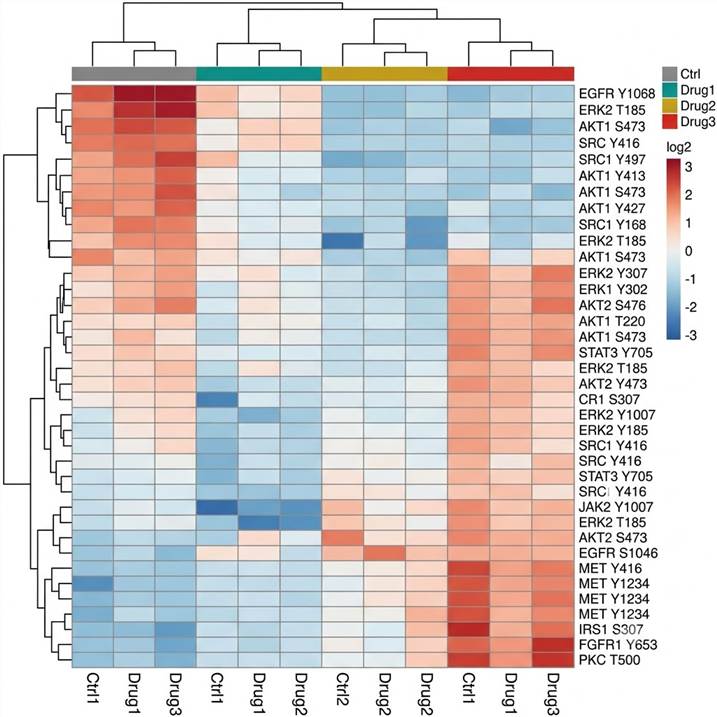
Fig. 3 — Hierarchical clustering heatmap of TMT-quantified phosphosites significantly regulated across four treatment conditions (3 replicates each). Color: log2 TMT ratio (blue = decreased, red = increased). Row dendrogram resolves site clusters with distinct temporal or dose-dependent response profiles — a standard deliverable for multi-condition PTM projects.
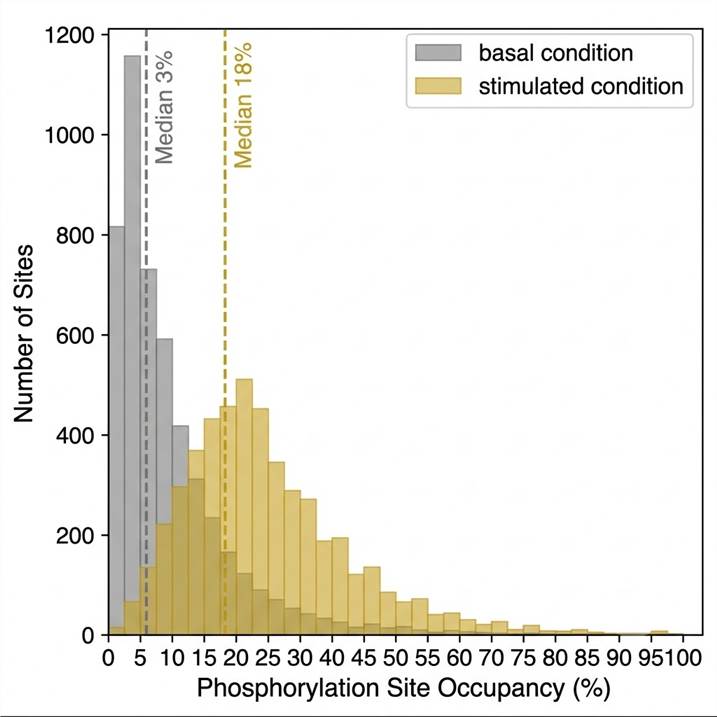
Fig. 4 — Phosphorylation site occupancy distribution from SILAC quantitative phosphoproteomics. Each bar = proportion of total phosphosite population at a given stoichiometry range (0–100%). Median site occupancy in this cell line is ~3% under basal conditions, rising to ~18% at key regulatory sites following growth factor stimulation — illustrating how stoichiometry data contextualizes fold-change results.
Case Study — DIA Enables Systematic Quantitative Phosphoproteomics Across 30 Kinase Inhibitors with Site Stoichiometry
Reference: Bekker-Jensen DB, Bernhardt OM, Hogrebe A, et al. Rapid and site-specific deep phosphoproteome profiling by data-independent acquisition without the need for spectral libraries. Nat Commun. 2020;11:787. DOI: 10.1038/s41467-020-14609-1 (CC BY 4.0)
Background & Scientific Question
Large-scale quantitative phosphoproteomics had been limited by the stochastic sampling bias of DDA acquisition, which produces high run-to-run missing values that undermine cohort-scale studies. The Olsen laboratory aimed to develop a DIA-based phosphoproteomics workflow that could systematically and reproducibly quantify >10,000 phosphosites across hundreds of samples without requiring a pre-built spectral library — and to demonstrate its scalability by applying it to a screen of 30 kinase inhibitors in the EGF signaling pathway, including quantification of phosphorylation site stoichiometry across conditions.
Methods
Phosphopeptides were enriched by two-step IMAC from HeLa cell lysates treated with 30 different kinase inhibitors targeting major EGF signaling nodes. DIA data was acquired on a Q Exactive HF mass spectrometer with variable isolation windows optimized for phosphopeptide precursor density. Data analysis used an untargeted DIA search strategy — bypassing the need for a pre-existing spectral library — and employed a phosphorylation site localization algorithm adapted for DIA fragmentation data. Phosphorylation stoichiometry was determined from DIA by measuring both phosphorylated and non-phosphorylated counterpart peptides in the same run, using protein-level normalization to decouple modification changes from protein abundance changes.
Results
The DIA workflow quantified >10,000 phosphorylation sites per sample with significantly lower missing values than DDA across the 30-inhibitor panel. Phosphorylation site stoichiometry was calculated on a proteome-wide scale — revealing the fractional occupancy of each site under each inhibitor condition. Kinase motif analysis of inhibitor-specific regulated sites correctly identified known substrates for each targeted kinase (e.g., ERK substrates for MEK inhibitors, AKT substrates for PI3K inhibitors) and revealed additional sites indicating pathway crosstalk. The approach scaled to hundreds of samples with reproducible site quantification and was benchmarked against SILAC, demonstrating comparable ratio accuracy for >95% of regulated sites at sufficient coverage.
Relevance to Our Service
This study demonstrates exactly the type of output our DIA PTM Quantification service delivers: >10,000 phosphosites per sample, low missing values, site localization scoring, stoichiometry calculation, and kinase network analysis — across a multi-condition screen at a scale only DIA makes feasible. Whether your project spans 10 or 200 samples, involves a single kinase inhibitor or a panel, the same analytical principles apply. Our implementation combines the workflow described in this landmark paper with 4D-diaPASEF on Bruker timsTOF for additional ion mobility-based separation — extending depth and quantitative precision beyond what Q Exactive-based DIA achieves.
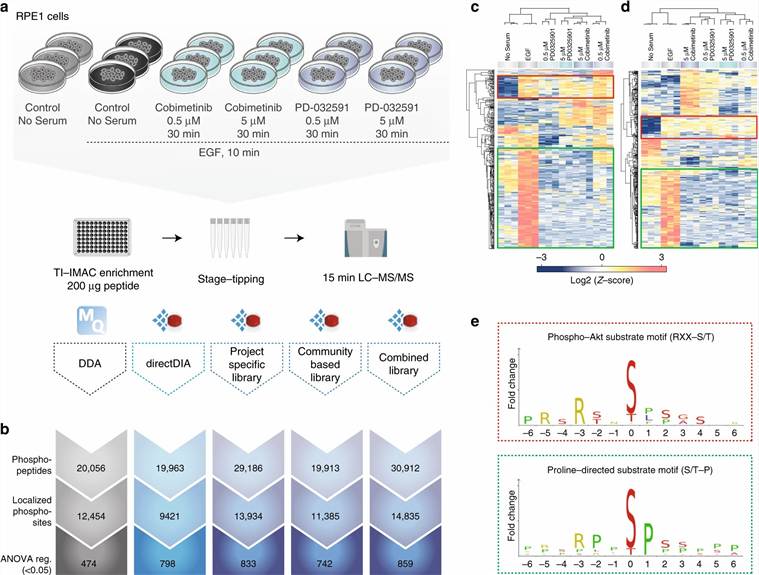
Figure adapted from Bekker-Jensen et al. 2020, Nat Commun 11:787, CC BY 4.0. Shows DIA quantification of phosphosites across 30 kinase inhibitors — kinase motif enrichment and stoichiometry distribution outputs.
Sample Requirements
| PTM Type |
Recommended Input |
Pre-Collection Requirement |
Compatible Strategies |
| Phosphoproteomics |
≥1 mg (DIA/SILAC); ≥2 mg (TMT); ≥0.5 mg (PRM targeted) |
Add phosphatase inhibitor cocktail (PhosSTOP or NaF 50 mM + Na₃VO₄ 1 mM) to lysis buffer immediately before use; lyse on ice |
DIA, SILAC, TMT, Label-Free, PRM, Absolute |
| Ubiquitylomics (diGLY) |
≥10 mg (global); ≥1–5 mg (targeted/PROTAC) |
Add 20 mM NEM to lysis buffer at the moment of lysis to block DUBs; do not delay — DUB activity begins within seconds of cell disruption |
SILAC, Label-Free, TMT |
| Acetylomics / Acylomics |
≥2–5 mg per modification type |
Standard protease inhibitors; for multi-acyl panels, provide protein mass per sample measured by BCA |
DIA, TMT, Label-Free, SILAC |
| Glycoproteomics |
≥0.5 mg (cells); ≥2 mg (plasma after depletion); ≥1 mg (tissue) |
No special requirements; avoid samples with high free glycan contamination; for secreted glycoproteins from conditioned medium, concentrate before submission |
DIA, TMT, Label-Free |
| Histone PTMs |
≥50 μg purified histones or ≥5 × 10⁶ cells for in-house extraction |
Snap-freeze cell pellets within 60 s of media removal; ship on dry ice; acid extraction performed in-house if whole-cell pellets are provided |
Label-Free, TMT, Absolute (individual marks) |
| Redox / Cysteine PTMs |
≥1 mg (differential alkylation); ≥2 mg (isoTOP-ABPP) |
Add trapping reagent (iodoacetamide, NEM, or modification-specific reagent) immediately at lysis before any exposure to air; work under N₂ or argon where feasible |
Label-Free, SILAC, ITRAQ/TMT (isoTOP-ABPP) |
FAQs — PTM Quantification
What is the difference between relative PTM quantification and PTM site occupancy analysis?
Relative PTM quantification measures how the abundance of a modified peptide changes between two conditions — for example, whether a phosphosite is 2-fold higher in drug-treated vs. control cells. This tells you the direction and magnitude of regulation but does not tell you what fraction of the total protein carries that modification. PTM site occupancy analysis measures the stoichiometric percentage — for example, that 5% of the protein population carries the modification under basal conditions, rising to 35% after drug treatment. Occupancy requires parallel measurement of both the modified and unmodified counterpart peptide (and the corresponding protein ratio for normalization in SILAC/TMT experiments). Occupancy data is biologically essential for understanding whether a modification is a major regulatory switch (high occupancy, high dynamic range) or a minor fraction effect (low occupancy even at maximum stimulation). We deliver occupancy alongside standard relative quantification for projects where input is sufficient for both measurements. See our dedicated PTM Site Occupancy Analysis service for projects where stoichiometry is the primary endpoint.
Why does TMT suffer from ratio compression, and how do you address it for PTM quantification?
TMT ratio compression occurs because co-isolated interfering precursors (peptides from other proteins present in the same MS1 isolation window) contribute TMT reporter ion signals that dilute toward a 1:1 ratio — compressing the true fold-change of the target peptide toward unity. For abundant, high-stoichiometry modifications, compression is modest and often acceptable. For low-abundance modified peptides — the majority of any PTM-enriched sample — compression can reduce a true 5-fold change to an apparent 1.5-fold change, causing false negatives. We address this through three strategies: (1) SPS-MS3 acquisition on Orbitrap Fusion Lumos, which selects MS2 fragment ions as the MS3 precursors, dramatically reducing interfering reporter signal; (2) high-pH offline fractionation before enrichment to reduce sample complexity and co-isolation probability; and (3) variable isolation window DIA-TMT where applicable. For projects where ratio accuracy is critical (e.g., distinguishing 1.5-fold from 3-fold regulated kinase substrates), we recommend SILAC or DIA-label-free as primary strategies and use TMT where throughput is the primary driver.
How many biological replicates do I need per condition for quantitative PTM analysis?
The minimum is three biological replicates per condition for any quantitative PTM project — this is non-negotiable for statistical testing. With n=3, you can apply a t-test or limma, calculate fold-change and p-value, and apply FDR correction — but statistical power is limited and only the most strongly regulated sites will reach significance. For projects where the goal is to identify a comprehensive regulated site list (e.g., all significantly regulated phosphosites in response to a drug), n=4–5 per condition substantially increases power to detect sites with moderate fold-changes (1.5–2.5×) and is our recommendation for phosphoproteomics studies intended for publication. For SILAC experiments, three biological replicates means three independently labeled and mixed heavy/light pairs — not three injections of the same mixture. For DIA cohort studies (biomarker discovery), statistical power depends on cohort size and expected effect size; we provide power calculation guidance for large-scale projects. Technical replicates (repeated injection of the same sample) are included internally for QC but do not substitute for biological replicates in any statistical analysis.
Can you perform quantitative PTM analysis on FFPE tissue samples?
Yes, with important caveats by modification type. Phosphoproteomics from FFPE tissue is feasible using antigen retrieval and optimized deparaffinization, followed by IMAC enrichment — we routinely process FFPE sections for quantitative phosphoproteomics with label-free or TMT quantification, generating 3,000–8,000 phosphosites per sample depending on tissue quality and section number. Ubiquitylomics from FFPE is not feasible — formalin cross-linking disrupts the diGLY epitope recognized by the enrichment antibody, and the NEM required to block DUBs cannot be applied retroactively to fixed tissue. Glycoproteomics from FFPE is feasible for N-glycosylation (PNGase F enzymatic release is cross-linking-tolerant) but challenging for O-glycosylation (labile O-linkages are affected by fixation). For any FFPE PTM project, we recommend submitting 10+ sections (10 μm thickness) per sample to compensate for the lower protein recovery from fixed tissue, and request pathology reports or H&E stain confirmation of tissue content before project initiation.
What bioinformatics outputs are included, and can you integrate PTM data with total proteomics from the same samples?
Standard bioinformatics deliverables for every quantitative PTM project: raw data files; modified peptide identification table with sequence, modified residue, localization probability score (≥0.75 = confident), charge state, and spectral FDR; site-level quantification matrix (normalized intensities or ratios across all samples); differential regulation table (log2 fold-change, p-value, adjusted p-value) for all pairwise comparisons specified at project initiation; volcano plots and MA plots for each comparison; hierarchical clustering heatmap of significantly regulated sites; GO biological process and KEGG pathway enrichment on regulated proteins; kinase-substrate enrichment analysis (KSEA) for phosphoproteomics datasets; enrichment QC report (enrichment specificity, spike-in recovery); and a project report with publication-ready methods text. When total proteomics (DIA or TMT global proteome) is performed from the same sample — which we strongly recommend for any PTM quantification project where protein expression changes between conditions are plausible — we perform integrated analysis: PTM site ratios are normalized by the corresponding protein ratio to isolate modification-intrinsic changes from simple protein abundance effects. This integration is essential for correctly interpreting PTM fold-change data and is available as part of our combined total proteomics + PTM project packages.