Why PTM Site Occupancy Matters for Mechanistic Research
Relative quantification reveals trends; site occupancy reveals mechanism. Knowing that a modification is "2-fold increased" under treatment cannot distinguish between a modification that is functionally dominant versus one that is merely present. Site occupancy answers the fundamental question: how much of the protein is actually modified?
The Biological Significance of Stoichiometry
Signaling threshold effects: Many phosphorylation-dependent signaling events require a minimum occupancy threshold before a biological response is triggered. For example, Akt activation requires phosphorylation at both Thr308 and Ser473 above specific stoichiometric levels. Without occupancy data, correlating phosphorylation events with downstream activation remains ambiguous.
Enzyme-substrate relationships: The stoichiometry of a modification directly reflects the balance between modifying enzymes (kinases, acetyltransferases, E3 ligases) and removing enzymes (phosphatases, deacetylases, DUBs). Occupancy measurements provide a quantitative readout of enzyme activity in situ, revealing regulatory mechanisms invisible to fold-change analysis.
Drug target engagement: In drug development, understanding how a candidate compound affects PTM occupancy at specific sites provides direct evidence of on-target engagement and off-target effects. For epigenetic drugs targeting histone modifications, site occupancy serves as a definitive pharmacodynamic biomarker.
Reversible vs. stable modifications: Occupancy distinguishes between high-turnover, dynamically regulated sites (low occupancy, rapid cycling) and stable, structural modifications (high occupancy, slow turnover). This distinction is critical for prioritizing targets for functional validation.
For a broader overview of all PTM analysis approaches available, see our PTM Services overview.
Our Approach to Site Occupancy Determination
Accurate site occupancy measurement requires simultaneous quantification of both the modified and unmodified forms of a target peptide. We deploy multiple complementary strategies, selected based on the modification type, sample availability, and the depth of coverage required.
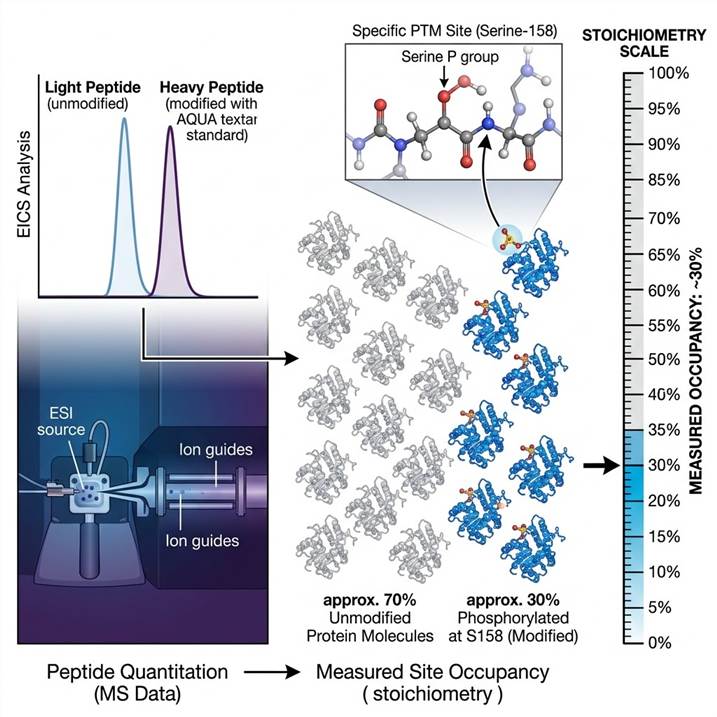
AQUA-Based Occupancy (Gold Standard)
For targeted, high-precision occupancy measurements, we use matched pairs of AQUA internal standard peptides — one representing the modified form and one representing the unmodified form of the same peptide sequence. Both AQUA peptides are spiked into the sample at known concentrations, enabling correction for differential ionization efficiency between modified and unmodified species. Site occupancy is calculated as: Site Occupancy (%) = [Modified Peptide] / ([Modified Peptide] + [Unmodified Peptide]) × 100.
This approach delivers occupancy values with typical coefficients of variation below 15%, suitable for detecting biologically meaningful stoichiometry changes across experimental conditions.
SILAC-Based Global Occupancy Profiling
For broader surveys of modification occupancy across the proteome, we employ SILAC-based quantification strategies. Cells are grown in light and heavy SILAC media, with one condition undergoing phosphatase or deacetylase treatment to generate reference unmodified peptides. The ratio of heavy to light signal directly reports the occupancy of each modification site. For deeper coverage of specific modification classes, consider our Global PTM Profiling service for complementary discovery-phase data.
Label-Free Occupancy Estimation
When the modified and unmodified forms of a peptide can be detected in the same LC-MS run without enrichment bias, label-free comparison provides a rapid occupancy estimate. This approach is best suited for high-abundance modifications and is typically cross-validated with AQUA-based measurements for critical targets.
Data Quality and Validation
Every occupancy measurement includes site localization confidence scoring (≥0.75 probability threshold), modified/unmodified peptide ratio reproducibility across technical replicates, matrix effect assessment via spike-recovery experiments, and limit of occupancy detection based on blank controls.
Compatible Sample Types and Modification Classes
Accepted Sample Types
| Sample Type |
Minimum Requirement |
Notes |
| Cultured cells (mammalian) |
≥1 × 10⁷ cells (targeted)
≥2 × 10⁷ cells (global) |
SILAC labeling possible for global occupancy |
| Tissues |
≥20 mg wet weight |
Snap-frozen or RNAlater-stabilized |
| Biofluids (plasma/serum) |
≥200 μL |
Targeted occupancy only |
| Immunoprecipitated samples |
≥10 μg protein per pull-down |
On-bead digestion supported |
| Subcellular fractions |
≥100 μg protein equivalent |
Nuclear, cytoplasmic, membrane, mitochondrial |
Supported Modification Classes
| Modification Class |
Occupancy Range Typically Observed |
Key Applications |
| Phosphorylation |
0.1–95% |
Signaling pathway analysis, kinase inhibitor pharmacodynamics |
| Acetylation |
1–80% |
Epigenetic regulation, metabolic enzyme control |
| Ubiquitination |
≤0.01–5% |
Proteasomal degradation signaling, DNA damage response |
| Methylation |
1–99% |
Histone code analysis, transcriptional regulation |
| SUMOylation |
0.1–10% |
Nuclear transport, stress response |
For targeted verification of specific modification sites discovered in your experiments, our PRM PTM Verification service provides complementary assay development and targeted quantification.
End-to-End Workflow: From Sample to Site Occupancy Data
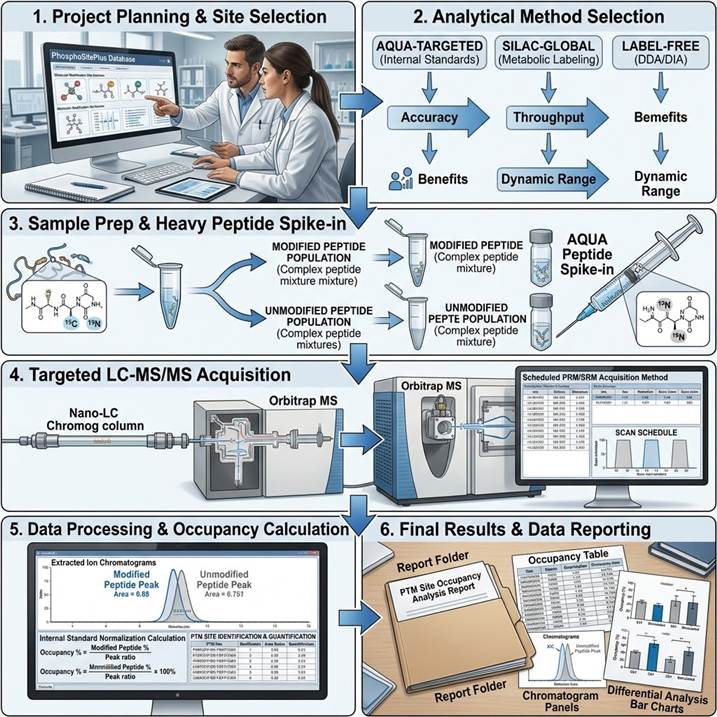
Step 1: Project Planning and Target Selection
We review your research goals and identify modification sites for occupancy analysis. Sites can be selected from prior discovery data, published literature, or public databases (PhosphoSitePlus, dbPTM). For global occupancy surveys, we design SILAC or chemical labeling strategies tailored to your sample type.
Step 2: Method Selection and Assay Design
Based on target number, sample type, and required precision, we select the optimal strategy — AQUA-based targeted (highest precision, ≤30 targets), SILAC-based global profiling (broadest coverage), or label-free rapid estimation (screening). For comprehensive characterization of combinatorial PTM patterns on individual proteoforms, our PTM Proteoform Mapping service provides detailed proteoform-level analysis.
Step 3: Sample Preparation and LC-MS/MS
Samples are processed under standardized conditions with parallel processing of modified and unmodified peptide populations. For AQUA-based occupancy, known quantities of both modified and unmodified AQUA peptides are spiked in. LC-MS/MS is performed on Orbitrap (PRM) or triple-quadrupole (SRM) platforms.
Step 4: Data Processing and Occupancy Calculation
Extracted ion chromatograms for modified/unmodified peptide pairs are integrated, AQUA internal standard-normalized, and occupancy percentages calculated with full error propagation. Site localization is verified using established scoring algorithms (≥0.75 confidence threshold).
Step 5: Differential and Statistical Analysis
For multi-condition experiments, occupancy changes are analyzed with appropriate statistical tests. Results are integrated with protein abundance data where available, enabling occupancy changes to be distinguished from protein-level expression changes.
Step 6: Deliverables and Review
Raw MS data files, AQUA peptide QC certificates, extracted ion chromatograms for each target, site occupancy table with replicate statistics, differential occupancy analysis, assay validation report, and a scientist consultation session for data walk-through and biological interpretation.
Why Choose Our PTM Site Occupancy Analysis Service
Specialized Stoichiometry Expertise
Our team has deep experience with the technical challenges unique to site occupancy determination — including differential ionization efficiency correction, modified/unmodified peptide co-elution optimization, and occupancy data validation. This expertise directly translates into reliable stoichiometry values you can build mechanistic conclusions on.
Orthogonal Strategy Validation
We do not rely on a single method. Wherever possible, occupancy values are cross-validated using orthogonal approaches (e.g., AQUA vs. SILAC, or targeted PRM vs. global profiling), providing an additional layer of confidence in your stoichiometry data.
Biological Context Integration
Occupancy data alone is powerful, but its true value emerges when integrated with protein abundance, modification dynamics, and pathway context. Our optional PTM Bioinformatics Analysis service places your occupancy data within its full biological framework.
Flexible Project Scope
From a single, high-value target site to proteome-wide occupancy profiling, our service scales to meet your needs. Pilot studies with 5–10 targets can be completed rapidly, while comprehensive global surveys provide systems-level stoichiometry landscapes.
Case Study: Global Ubiquitylation Site Occupancy Reveals Systems-Level Regulatory Properties
In a landmark 2024 study published in Cell, Prus et al. performed the first global, site-resolved analysis of ubiquitylation occupancy and turnover rate, revealing fundamental systems-level properties of the ubiquitin-proteasome system.
Background: While ubiquitylation is known to regulate virtually every cellular process, the fraction of a protein that is ubiquitinated at any given site — the site occupancy — had never been systematically measured. Without occupancy data, distinguishing between regulatory ubiquitylation events and background noise was impossible at the proteome scale.
Approach: The team developed a quantitative mass spectrometry strategy combining partial chemical Gly-Gly modification (NHS-Gly-Gly-Boc) with SILAC-based serial dilution to measure absolute ubiquitylation site occupancy. The approach was extended to measure ubiquitylation turnover (half-life) using dynamic SILAC pulse-chase labeling. In total, 11,403 ubiquitylation sites across 3,086 proteins were quantified for occupancy, and 13,833 sites for half-life.
Key Findings:
- The median ubiquitylation occupancy is 0.0081% — over three orders of magnitude lower than median phosphorylation occupancy (~28%), reflecting the distinct regulatory logic of ubiquitin signaling
- Ubiquitylation occupancy spans a remarkable 10,000-fold range (four orders of magnitude), from sites present on less than 0.001% to more than 5% of protein molecules
- High-occupancy ubiquitylation sites are enriched on plasma membrane solute carrier transporters, suggesting a role in transporter quality control
- The median ubiquitylation half-life is approximately 12 minutes, with rapid deubiquitylation observed on E1 and E2 ubiquitin enzymes
- Integration of occupancy and half-life data revealed that high-occupancy sites are not necessarily long-lived — challenging assumptions about the relationship between modification abundance and stability
Significance: This study established that ubiquitylation site occupancy can be systematically measured at the proteome scale and that occupancy data reveals regulatory properties invisible to conventional presence/absence analysis. The finding that median ubiquitylation occupancy is orders of magnitude lower than phosphorylation underscores the importance of method sensitivity for accurate stoichiometry determination.
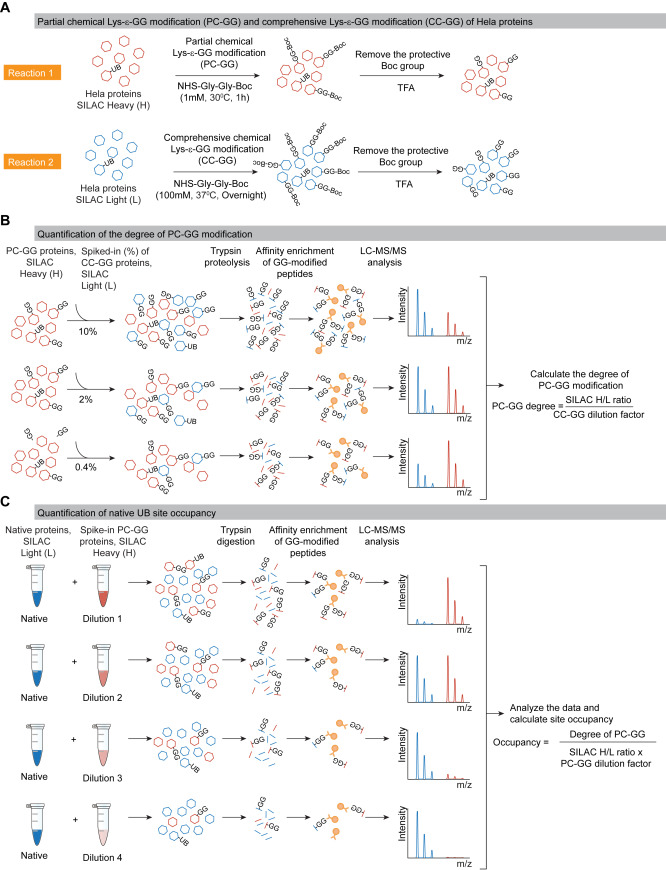
Figure 1 from Prus et al. (2024). Global ubiquitylation site occupancy measurements showing the distribution, range, and comparison with phosphorylation occupancy. (CC BY 4.0)
Representative Site Occupancy Results
Our site occupancy analysis delivers data ready for immediate biological interpretation. Each project package includes fully annotated quantification, quality metrics, and differential analysis.
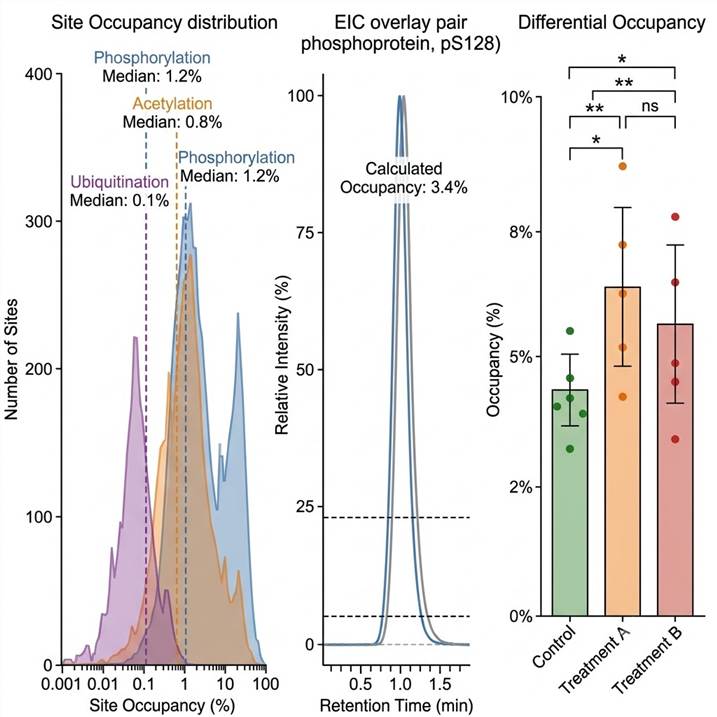
Representative data outputs from our PTM site occupancy analysis pipeline. Left: Site occupancy distribution across quantified modification sites. Center: Extracted ion chromatograms for modified and unmodified peptide pairs. Right: Differential occupancy comparison across experimental conditions.
Key data components included in every deliverable package:
- Site occupancy distribution — Per-site occupancy percentages across all quantified modification sites, with confidence intervals and replicate reproducibility
- Differential occupancy analysis — For multi-condition experiments, site-specific occupancy changes with statistical significance (p-values, effect sizes)
- Modified vs. unmodified ion chromatograms — Overlay of extracted ion chromatograms demonstrating co-elution and signal quality for each quantified site
- Assay performance summary — Limit of occupancy detection, replicate reproducibility (CV%), and spike-recovery accuracy
Related Services
Our site occupancy analysis service is one component of a comprehensive PTM quantification platform. These services can be used independently or integrated into a complete quantitative analysis workflow.
FAQs
What is PTM site occupancy?
PTM site occupancy (also called modification stoichiometry) is the percentage of a protein's total population that carries a specific post-translational modification at a specific amino acid residue. For example, if 30% of a protein is phosphorylated at Ser473, the site occupancy is 30%.
How is site occupancy different from relative quantification?
Relative quantification measures fold-changes between conditions (e.g., "2.5-fold increase in phosphorylation at Site X"). Site occupancy measures the absolute fraction of modified protein (e.g., "Site X occupancy increased from 5% to 45%"). Occupancy reveals whether a modification is functionally dominant or minor, which relative ratios cannot distinguish.
What methods do you use for occupancy determination?
We use AQUA-based targeted occupancy (gold standard, highest precision, ≤30 targets), SILAC-based global occupancy profiling (broadest coverage, thousands of sites), and label-free estimation (rapid screening). The method is selected based on target number, sample type, and required precision.
What is the typical precision of site occupancy measurements?
For AQUA-based targeted occupancy, we achieve CV ≤15% across technical replicates. For SILAC-based global profiling, CV ≤25% is typical. Precision depends on target abundance, modification type, and sample complexity.
What is the limit of detection for occupancy?
The minimum detectable occupancy varies by modification type and peptide abundance. For phosphorylation, occupancies as low as 0.1% can be confidently quantified for medium-to-high abundance peptides. For ubiquitination, our methods detect occupancies as low as 0.001% with appropriate enrichment.
Can you measure occupancy for any modification type?
Yes, in principle. The key requirement is the ability to distinguish and quantify both the modified and unmodified forms of the target peptide. We have validated protocols for phosphorylation, acetylation, ubiquitination, methylation, and multiple acylations. For novel or unusual modifications, AQUA standard design and method development are performed on a project basis.
What controls are included in an occupancy experiment?
Every project includes unmodified peptide controls, blank processing controls, AQUA internal standard spike-in controls (for targeted methods), replicate injections, and calibration standards. For SILAC-based studies, labeling efficiency controls and mixing ratio validations are included.
How many targets can be analyzed in a single project?
For AQUA-based targeted occupancy: up to 30 modification sites per project. For SILAC-based global profiling: thousands of sites across the proteome. Project scope recommendations are made during the initial consultation based on your research objectives.
References
- Prus G, Satpathy S, Weinert BT, Narita T, Choudhary C. Global, site-resolved analysis of ubiquitylation occupancy and turnover rate reveals systems properties. Cell. 2024;187(11):2875-2892.
For research use only. Not for use in diagnostic procedures.