Tissue-Resolved Phospho-Signaling Analysis for Understanding Drug Response and Signaling Network Heterogeneity
Protein phosphorylation — the reversible enzymatic attachment of phosphate groups to serine, threonine, and tyrosine residues by protein kinases — is the central regulatory mechanism governing signal transduction, cell cycle progression, differentiation, metabolism, and apoptosis. Dysregulated phosphorylation signaling is a hallmark of cancer and many other diseases, and over 50 FDA-approved kinase inhibitors target aberrant phospho-signaling pathways in oncology and inflammatory diseases. However, conventional phosphoproteomics workflows that rely on tissue homogenization irreversibly destroy spatial information, averaging phospho-signaling signals across morphologically distinct regions including tumor epithelium, stroma, immune infiltrates, and necrotic areas. This loss of spatial context is particularly problematic for phospho-signaling, which exhibits extreme heterogeneity across tissue microenvironments — the same signaling pathway may be hyperactivated in tumor cells while simultaneously suppressed in adjacent stromal fibroblasts, a distinction that carries fundamentally different therapeutic implications but is completely obscured in bulk analysis.
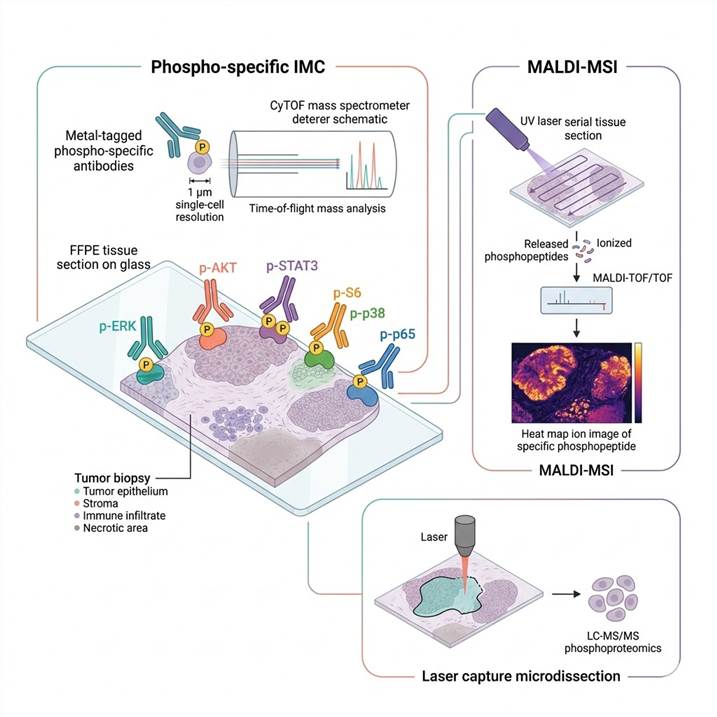
Spatial phospho-signaling analysis overcomes this limitation by detecting and localizing phospho-protein signaling events directly within intact tissue sections. Imaging mass cytometry (IMC) using metal-tagged phospho-specific antibodies enables simultaneous detection of 30+ phospho-epitopes at single-cell resolution (1 μm), providing a comprehensive view of signaling pathway activation states across different cell types within the tissue context. MALDI-MSI-based spatial phosphoproteomics complements antibody-based detection by enabling label-free, untargeted mapping of phosphopeptides released directly from tissue surfaces, providing discovery-phase coverage of phosphorylation events without the need for pre-selected antibodies. Together, these complementary platforms enable researchers to map phospho-signaling networks at resolutions ranging from single-cell to tissue-wide, and to correlate signaling states with drug treatment response, target engagement, and disease progression in the same tissue context. For comprehensive phosphorylation analysis in homogenized samples, our Phosphoproteomics Analysis Services provide complementary solution-phase phosphopeptide identification and quantification.
Find Your Solution: Research Goal → Spatial Phospho-Signaling Strategy
| Your Research Goal |
Recommended Approach |
Key Techniques |
| Multiplexed phospho-signaling pathway mapping in FFPE tumor biopsies at single-cell resolution |
Imaging mass cytometry (IMC) with metal-tagged phospho-specific antibody panel |
Metal-conjugated phospho-antibody panel (20–35 markers), IMC acquisition at 1 μm resolution, single-cell segmentation, per-cell signaling activation scoring, spatial neighborhood analysis |
| Drug target engagement assessment: confirming kinase inhibitor effects on downstream phospho-signaling in tissue |
Targeted IMC phospho-signaling panel with drug-treated vs. control tissue comparison |
Phospho-antibody panel targeting inhibited pathway nodes (p-ERK, p-AKT, p-S6), quantitative comparison of phospho-signal intensity across treatment groups, spatial mapping of drug penetration and signaling inhibition gradients |
| Untargeted discovery of phosphopeptide spatial distribution in fresh frozen or FFPE tissue sections |
MALDI-mass spectrometry imaging (MALDI-MSI) spatial phosphoproteomics |
On-tissue phosphopeptide enrichment or phosphatase inhibition, MALDI-MSI acquisition at 10–50 μm pixel size, phosphopeptide identification by accurate mass matching and MS/MS fragmentation |
| Region-specific phosphoproteomics: identifying phosphorylation sites from defined tissue microregions |
Laser capture microdissection (LCM) + LC-MS/MS phosphoproteomics |
LCM capture of defined tissue regions (tumor nests, invasive front, lymphoid aggregates), phosphopeptide enrichment (IMAC or TiO₂), LC-MS/MS with HCD or EThcD fragmentation, site localization scoring |
| Multi-modal integration of spatial phospho-signaling with transcriptomics or proteomics |
Serial section multi-omics or same-section sequential workflow |
Adjacent tissue section correlation, same-section sequential workflows (IMC → H&E → IHC), spatial data coregistration, multi-modal image alignment and signaling pathway activity correlation |
| High-throughput phospho-biomarker screening across clinical tissue cohorts |
Automated IMC pipeline on tissue microarrays (TMAs) |
Automated phospho-antibody staining on TMA slides, high-content IMC acquisition, quantitative phospho-signal scoring per core, correlation with clinical annotations and survival data |
Complementary Platforms for Spatial Phospho-Signaling Detection and Phosphoproteomic Analysis
Our spatial phospho-signaling analysis portfolio encompasses three complementary technology platforms, each optimized for specific spatial resolution, signaling pathway coverage, and sample type requirements. Platform selection depends on the research question, available tissue material, signaling pathways of interest, and desired spatial resolution.
Imaging Mass Cytometry (IMC) with Multiplexed Phospho-Specific Antibodies for Targeted Signaling Pathway Mapping
IMC-based phospho-signaling analysis uses a panel of metal isotope-tagged phospho-specific antibodies directed against phosphorylated epitopes on key signaling proteins — including p-ERK1/2 (T202/Y204, MAPK pathway activation), p-AKT (S473, PI3K pathway activation), p-STAT3 (Y705, JAK/STAT pathway activation), p-S6 (S235/236, mTOR pathway activation), p-p38 (T180/Y182, stress signaling), p-JNK (T183/Y185, stress signaling), p-p65 (S536, NF-κB activation), p-CHK1 (S345, DNA damage response), p-Histone H3 (S10, mitotic signaling), and γH2AX (S139, DNA double-strand break signaling) — to simultaneously detect 20–35 phospho-epitopes and signaling markers in a single tissue section at 1 μm spatial resolution. After antibody staining, the tissue is introduced into a CyTOF mass spectrometer where the metal tags are quantified by atomic mass spectrometry, generating pixel-by-pixel phospho-signaling maps that can be segmented by cell type and analyzed for spatial relationships. The metal-tag detection strategy eliminates tissue autofluorescence and spectral overlap issues that limit conventional fluorescence-based multiplexing to 4–7 markers, and the 1 μm spatial resolution enables single-cell phospho-signaling profiling within the tissue context. For comprehensive phosphoproteomic analysis complementary to targeted IMC, our Quantitative Phosphoproteomics Analysis service provides solution-phase phosphopeptide quantification and pathway analysis.
MALDI-Mass Spectrometry Imaging (MALDI-MSI) for Untargeted Spatial Phosphoproteomics
MALDI-MSI-based spatial phosphoproteomics provides label-free, untargeted detection of phosphopeptides released directly from tissue sections, enabling simultaneous mapping of hundreds of phosphopeptide signals in a single imaging experiment. The workflow involves on-tissue enzymatic digestion (trypsin), phosphopeptide enrichment by on-tissue IMAC or TiO₂, matrix application, and MALDI-MSI acquisition at 10–50 μm spatial resolution. Each pixel in the resulting ion image represents the phosphopeptide mass spectrum at that tissue location, generating spatially resolved phosphopeptide abundance maps that can be overlaid with the histological image of the same section. While less comprehensive than homogenate-based phosphoproteomics in terms of total phosphopeptide coverage, MALDI-MSI spatial phosphoproteomics provides unique information about the spatial distribution of phosphorylation events across tissue regions, enabling correlation of specific phospho-signals with morphological features and cell types. For comprehensive site-specific phosphorylation analysis, our Phosphorylation Site Identification and Phosphoproteomics Data Analysis services provide complementary LC-MS/MS-based identification and bioinformatics support.
Laser Capture Microdissection (LCM) and Spatial Phosphoproteomics by LC-MS/MS
For researchers who require identification of both the phosphorylation site and the protein carrier from specific tissue regions identified through IMC or MALDI-MSI spatial mapping, LCM-coupled LC-MS/MS phosphoproteomics provides the missing molecular detail. After spatial phospho-signaling mapping identifies tissue regions of interest — for example, a p-ERK hotspot in the invasive front of a tumor — adjacent tissue sections are used for LCM capture of the corresponding regions. Captured tissue microdissections (typically 500–5,000 cells per region) are subjected to protein extraction, reduction, alkylation, and tryptic digestion, followed by phosphopeptide enrichment using IMAC or TiO₂ and LC-MS/MS analysis with HCD or EThcD fragmentation for phosphorylation site localization. For comprehensive phosphopeptide enrichment support, our Phosphopeptide Enrichment and Modified Peptide Enrichment Services provide complementary IMAC, TiO₂, and MOAC-based enrichment platforms.
Why Choose Our Spatial Phospho-Signaling Analysis Services
Integrated Multi-Platform Spatial Phospho-Signaling Detection Under a Single Service Relationship
We offer the three most advanced spatial phospho-signaling platforms — IMC with multiplexed phospho-specific antibodies (20–35 markers, 1 μm resolution), MALDI-MSI spatial phosphoproteomics (untargeted phosphopeptide mapping, 10–50 μm resolution), and LCM-coupled LC-MS/MS phosphoproteomics (region-specific phosphorylation site identification) — within a single service relationship. This integration eliminates the need to coordinate separate providers for imaging and phosphoproteomics and ensures that findings from one platform are directly validated and extended by the others on matched tissue samples.
Comprehensive Signaling Pathway Coverage from Single-Cell to Tissue-Scale Resolution
Our combined phospho-antibody panel portfolio covers the major kinase signaling cascades — MAPK/ERK, PI3K/AKT/mTOR, JAK/STAT, NF-κB, Wnt/β-catenin, TGF-β/SMAD, Hippo/YAP, DNA damage response, and apoptosis signaling — with validated phospho-specific antibodies for 50+ phosphorylated epitopes, enabling comprehensive signaling network analysis at spatial resolutions ranging from single-cell (1 μm IMC) to tissue-region (10–50 μm MALDI-MSI and LCM).
Both FFPE Archival and Fresh Frozen Tissue Compatibility for Retrospective and Prospective Studies
All three platforms are optimized for FFPE tissue sections, enabling access to the vast archives of clinically annotated formalin-fixed tissues in hospital pathology departments and tissue banks — a critical capability for retrospective clinical trial correlative studies where archived FFPE biopsies are the primary available sample type. Fresh frozen tissue protocols are also available for all platforms, with MALDI-MSI on fresh frozen tissue typically yielding higher phosphopeptide detection sensitivity due to reduced crosslinking.
Drug Development-Focused Analytical Framework with Target Engagement and Pharmacodynamic Readouts
Our spatial phospho-signaling platform is specifically designed to support drug development workflows, providing quantitative spatial readouts of phospho-signaling inhibition (target engagement), pathway modulation (pharmacodynamic biomarkers), and resistance mechanism mapping in preclinical and clinical tissue samples. Custom antibody panel design services are available for client-specific target pathways, and our bioinformatics pipeline delivers treatment-group comparison statistics with spatial context.
Workflow: From Tissue Section to Publication-Ready Spatial Phospho-Signaling Maps
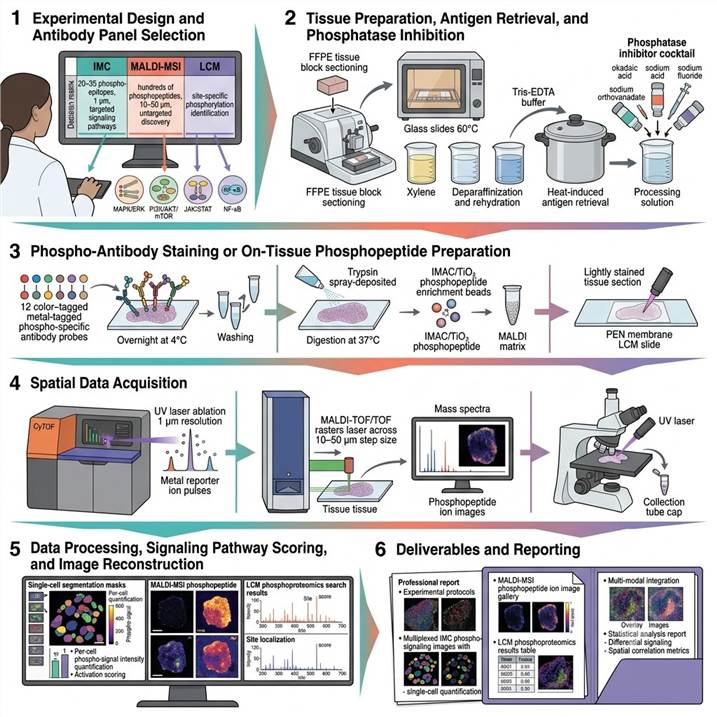
Step 1: Experimental Design and Antibody Panel Selection
We consult with you to define the spatial phospho-signaling strategy based on tissue type (FFPE or fresh frozen), signaling pathways of interest (MAPK, PI3K/AKT, JAK/STAT, NF-κB, custom), desired spatial resolution (single-cell IMC or tissue-region MALDI-MSI), and comparison groups (drug-treated vs. control, disease vs. normal). A customized phospho-antibody panel (10–35 markers) is designed based on your signaling pathways of interest, with inclusion of lineage markers for cell type identification.
Step 2: Tissue Preparation, Antigen Retrieval, and Phosphatase Inhibition
FFPE tissue sections are deparaffinized, rehydrated, and subjected to heat-induced antigen retrieval in Tris-EDTA buffer optimized for phospho-epitope preservation. For fresh frozen sections, cold ethanol or formalin fixation is performed. Phosphatase inhibitor cocktails are applied throughout the staining protocol to preserve endogenous phosphorylation states. Tissue morphology is documented by H&E staining of a reference serial section.
Step 3: Phospho-Antibody Staining or On-Tissue Phosphopeptide Preparation
For IMC: metal-tagged phospho-specific antibody panel is applied to the tissue section, incubated overnight (4°C) for optimal phospho-epitope binding, washed, and dried for CyTOF acquisition. For MALDI-MSI: on-tissue tryptic digestion is performed by spray deposition (37°C, 2–4 hours), followed by on-tissue phosphopeptide enrichment (IMAC or TiO₂) and MALDI matrix application. For LCM: tissue is lightly stained and mounted on LCM slides.
Step 4: Spatial Data Acquisition
IMC: tissue is ablated by UV laser at 1 μm resolution in a CyTOF instrument, generating pixel-by-pixel metal reporter counts for each phospho-antibody across the tissue area. MALDI-MSI: mass spectra are acquired at 10–50 μm pixel size in positive ion mode, generating ion images for each detected phosphopeptide (m/z value). LCM: regions of interest identified by reference to spatial phospho-signaling maps are captured by laser microdissection for downstream LC-MS/MS.
Step 5: Data Processing, Signaling Pathway Scoring, and Image Reconstruction
IMC data are processed for single-cell segmentation (using nuclear and membrane markers), cell type classification, and per-cell phospho-signal quantification with signaling pathway activation scores. MALDI-MSI data are processed for spectral peak picking, phosphopeptide identification by accurate mass matching and MS/MS, ion image reconstruction, and spatial co-localization analysis. LCM-LC-MS/MS data are searched by phosphoproteomics search engines for phosphopeptide identification with site localization scoring.
Step 6: Deliverables and Reporting
Comprehensive spatial phospho-signaling report including: experimental protocols with tissue preparation and antibody panel details, multiplexed IMC phospho-signaling images with single-cell quantification and pathway activation maps, MALDI-MSI phosphopeptide ion images with spatial distribution maps, LCM phosphoproteomics results with identified phosphorylation sites, multi-modal integration images correlating phospho-signaling with morphology and lineage markers, and statistical analysis with differential signaling and spatial correlation metrics.
Applications in Spatial Phospho-Signaling Analysis Research
Spatial phospho-signaling analysis has emerged as a transformative approach for understanding the role of phosphorylation-driven signaling in tissue biology, drug response, and disease progression. The following application areas represent the most active and impactful use cases for this technology.
Drug Target Engagement and Pharmacodynamic Biomarker Assessment
A critical challenge in kinase inhibitor drug development is demonstrating that the drug engages its intended target and modulates downstream signaling in the relevant tissue compartment. Spatial phospho-signaling analysis by IMC provides direct evidence of target engagement by quantifying phospho-protein inhibition at single-cell resolution in drug-treated versus control tissue sections. For example, in a tumor biopsy from a patient treated with a MEK inhibitor, the spatial distribution of p-ERK inhibition across different tumor regions reveals whether the drug penetrates uniformly into the tumor tissue, whether some cancer cell clones escape pathway inhibition, and whether stromal cells show differential signaling responses. This spatial pharmacodynamic information is essential for interpreting clinical trial results, optimizing dosing regimens, and identifying mechanisms of resistance. For complementary solution-phase kinase activity analysis, our Kinase Activity Profiling and Kinase-Substrate Network Analysis services provide biochemical kinase activity measurements and network-level signaling analysis.
Oncology Signaling Network Heterogeneity and Resistance Mechanisms
Intratumoral heterogeneity in signaling pathway activation is a major driver of therapeutic resistance, yet this heterogeneity is largely invisible in bulk phosphoproteomic analysis. Spatial phospho-signaling analysis reveals how different signaling pathways are activated in different tumor subclones and microenvironmental niches within the same tumor, enabling identification of resistant cell populations that maintain pathway activity despite treatment. For example, spatial mapping of PI3K/AKT/mTOR and MAPK/ERK signaling in the same tissue section can reveal compensatory pathway activation — where inhibition of one pathway leads to upregulation of another in specific tumor regions — providing spatial evidence for combination therapy strategies. Our Multi-PTM Crosstalk Profiling service provides complementary analysis of phosphorylation interactions with other PTMs in the same biological context.
Tumor Microenvironment Signaling and Immune Cell Functional States
Phospho-signaling in immune cells within the tumor microenvironment — including T cell receptor signaling (p-ZAP70, p-LCK, p-SLP76), costimulatory pathway activation (p-NF-κB, p-STAT), and checkpoint signaling (PD-1/PD-L1 engagement effects) — determines whether the immune system can mount an effective anti-tumor response. Spatial phospho-signaling analysis enables simultaneous mapping of immune cell lineage markers and intracellular phospho-signaling readouts in the same tissue section, revealing the activation states of tumor-infiltrating lymphocytes, macrophages, and dendritic cells in their native tissue context. This spatial immune signaling information is critical for understanding immunotherapy response and resistance, identifying spatially organized immune suppression mechanisms, and discovering combination immunotherapy strategies that target both immune checkpoints and intracellular signaling pathways.
Preclinical Drug Development and Patient-Derived Xenograft (PDX) Model Characterization
Patient-derived xenograft (PDX) models are widely used in preclinical drug development to evaluate therapeutic efficacy, but standard analysis endpoints (tumor volume, homogenate-based proteomics) provide limited spatial information about drug action. Spatial phospho-signaling analysis of PDX tumors enables comprehensive characterization of drug-target engagement across different tumor regions, assessment of pharmacodynamic biomarker modulation with spatial resolution, identification of resistant tumor subpopulations that escape pathway inhibition, and evaluation of tumor-stroma signaling crosstalk in response to treatment. This spatial pharmacodynamic information provides mechanistic insights that are essential for go/no-go decisions in drug development programs and for designing rational combination therapy strategies. For reactive cysteine-targeted covalent drug engagement, our Reactive Cysteine Target Engagement Assay provides complementary chemoproteomic target engagement analysis.
Clinical Trial Correlative Studies and Patient Stratification
Spatial phospho-signaling analysis of pre-treatment and on-treatment biopsies from clinical trials provides spatially resolved pharmacodynamic evidence of target engagement and pathway modulation, supporting clinical proof-of-mechanism and enabling patient stratification based on baseline signaling pathway activation patterns. In phase I/II clinical trials of kinase inhibitors, spatial IMC analysis of paired biopsies (pre-treatment and on-treatment) can demonstrate that the drug inhibits its target in the intended tissue compartment, identify baseline signaling features that predict clinical response or resistance, and reveal adaptive signaling changes that inform combination therapy strategies. The ability to work with FFPE tissue — the standard clinical biopsy preservation format — makes our platform directly compatible with clinical trial tissue collection workflows.
Case Study: Imaging Mass Cytometry-Based Characterization of Tumor Microenvironment Remodeling Following Oncogene Inhibition in Preclinical Lung Cancer Models
In a 2021 study published in Nature Communications (CC BY 4.0), van Maldegem et al. developed and applied an optimized imaging mass cytometry workflow to characterize the tumor microenvironment remodeling induced by KRAS G12C inhibitor treatment, establishing a robust framework for spatial phospho-signaling analysis of drug response in intact tissue sections at single-cell resolution.
Background: KRAS G12C inhibitors — including sotorasib and adagrasib — represent a breakthrough in targeting the previously undruggable KRAS oncoprotein, yet the tissue-level effects of KRAS G12C inhibition on the tumor immune microenvironment were poorly understood. Preclinical studies had demonstrated that KRAS G12C inhibition leads to immune cell infiltration and activation, but the spatial organization and phenotypic characteristics of this immune remodeling — including changes in signaling pathway activation states across different cell types within the tumor microenvironment — had not been characterized at single-cell resolution. The authors addressed this gap by developing an optimized 27-antibody IMC panel and automated image analysis pipeline to comprehensively characterize the spatial and functional remodeling of the tumor immune microenvironment following KRAS G12C inhibitor treatment in an immune-competent mouse model.
Approach: An orthotopic mouse model of KRAS G12C-driven lung adenocarcinoma was established in immune-competent mice, and animals were treated with the KRAS G12C inhibitor MRTX1257 or vehicle control. Tumor tissues were harvested, frozen, sectioned, and stained with a 27-antibody IMC panel including markers for immune cell lineage identification (CD3, CD4, CD8, FoxP3, CD11b, CD11c, F4/80, Ly6G, NK1.1, B220), activation markers (CD69, CD44, CD62L, ICOS, PD-1, CTLA-4, LAG-3, TIM-3), proliferation (Ki-67), functional markers (granzyme B, IFN-γ, TNF-α, iNOS, arginase-1), and signaling proteins (p-STAT3, p-S6, p-ERK). An automated image segmentation pipeline (imcyto) was developed in Nextflow for pixel classification, single-cell segmentation, signal quantification, and spatial neighborhood analysis. Tissue classification based on cellular composition identified distinct tumor microenvironment domains.
Key Findings:
- TME remodeling following oncogene inhibition: KRAS G12C inhibitor treatment induced significant remodeling of the tumor immune microenvironment, characterized by increased infiltration of CD8+ T cells, CD11c+ dendritic cells, and F4/80+ macrophages into tumor regions, with concurrent reduction in immunosuppressive cell populations including FoxP3+ regulatory T cells and arginase-1+ myeloid cells
- Spatial organization of immune activation: Spatial neighborhood analysis revealed that KRAS G12C inhibitor treatment promoted the formation of immune cell clusters and increased proximity between CD8+ T cells and CD11c+ dendritic cells within the tumor microenvironment, suggesting enhanced antigen presentation and T cell priming in drug-treated tumors correlating with observed tumor regression
- Cell-type-specific signaling changes: Multiplexed signaling protein analysis (p-STAT3, p-S6, p-ERK) revealed cell-type-specific changes in pathway activation following KRAS G12C inhibition, with reduced MAPK pathway signaling in tumor cells and increased STAT3 signaling in immune cells, demonstrating the cell-type-specific nature of signaling responses to targeted therapy
- Automated image analysis pipeline: The imcyto Nextflow pipeline provided scalable, reproducible single-cell analysis of IMC data, with automated pixel classification, cell segmentation, and spatial neighborhood quantification that was validated against manual analysis and applied across multiple treatment groups and biological replicates
- Functional validation: Flow cytometry and RNA-seq analysis of parallel tissue samples validated the IMC-based findings, confirming increased CD8+ T cell infiltration, enhanced dendritic cell activation, and reduced immunosuppressive myeloid populations in KRAS G12C inhibitor-treated tumors
Significance: This study established a comprehensive and reproducible IMC-based spatial phospho-signaling analysis workflow for characterizing tumor microenvironment remodeling following targeted therapy, demonstrating that KRAS G12C inhibition not only suppresses oncogenic signaling in tumor cells but also induces profound remodeling of the immune microenvironment with enhanced antigen presentation and T cell activation. The 27-antibody IMC panel design — incorporating immune lineage markers, activation markers, functional markers, and phospho-signaling readouts — provides a template for spatial signaling analysis in drug development, enabling simultaneous assessment of target engagement, pharmacodynamic biomarker modulation, and immune microenvironment remodeling in a single tissue section at single-cell resolution. The imcyto image analysis pipeline is publicly available and directly applicable to our spatial phospho-signaling platform, where we similarly employ automated segmentation and spatial analysis for multiplexed IMC data.
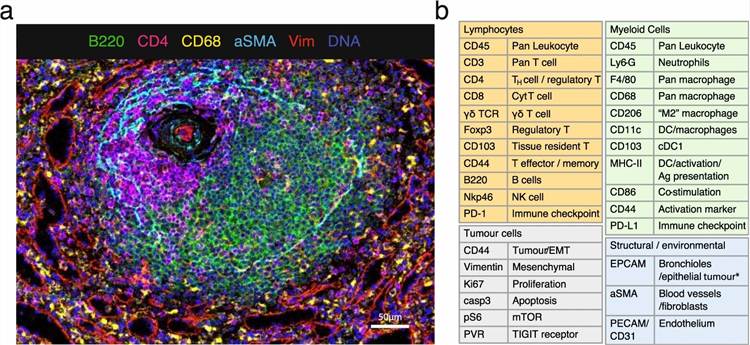
Adapted from van Maldegem et al. (2021). Characterisation of tumour microenvironment remodelling following oncogene inhibition in preclinical studies with imaging mass cytometry. Nature Communications 12:5906. (CC BY 4.0)
Representative Results: Spatial Phospho-Signaling Data Outputs and Platform Performance
Our spatial phospho-signaling analysis platform delivers integrated data packages combining imaging, spectrometric, and phosphoproteomic results for comprehensive tissue-level signaling pathway characterization. The representative data below illustrates the typical output quality and performance specifications achieved across the three complementary platforms.
Platform Performance Specifications
| Performance Parameter |
Phospho-Specific IMC |
MALDI-MSI Phosphoproteomics |
LCM Phosphoproteomics |
| Detection scope |
20–35 targeted phospho-epitopes + lineage markers |
Hundreds of phosphopeptide signals (untargeted) |
Site-specific phosphorylation identification |
| Spatial resolution |
1 μm (single-cell) |
10–50 μm pixel size |
Region-specific (LCM-defined areas) |
| Sample type compatibility |
FFPE and fresh frozen |
FFPE and fresh frozen |
FFPE and fresh frozen |
| Multiplexing capacity |
30+ markers per section |
All detectable phosphopeptides per pixel |
100s phosphorylation sites per region |
| Signaling pathway coverage |
MAPK/ERK, PI3K/AKT, JAK/STAT, NF-κB, DDR, apoptosis |
Discovery-phase phosphoproteome |
Discovery-phase phosphoproteome |
| Quantification type |
Relative phospho-signal intensity per cell |
Relative phosphopeptide abundance per pixel |
Label-free or TMT quantification |
| Throughput (samples/week) |
5–20 tissue sections |
2–8 tissue sections |
2–5 LCM regions |
| Typical tissue area per analysis |
1–100 mm² |
1–500 mm² |
0.1–50 mm² |
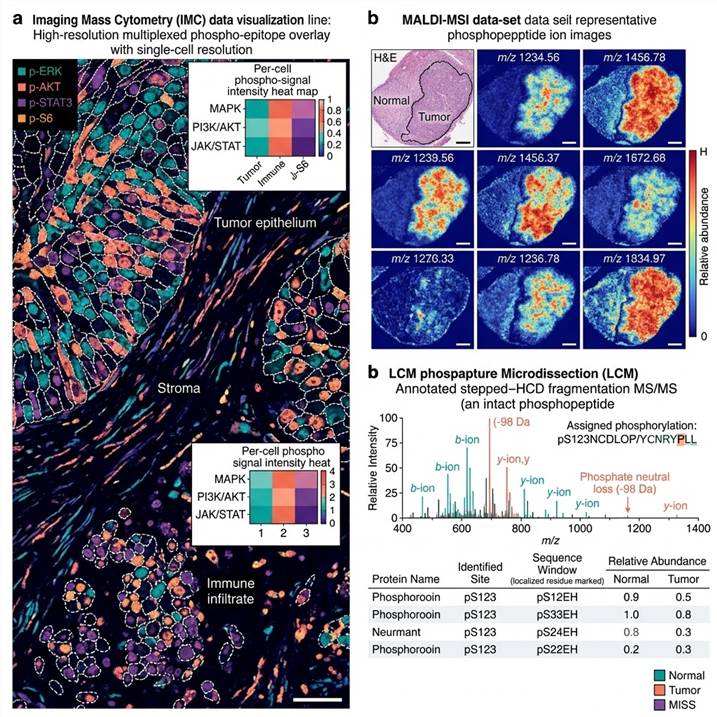
Representative data outputs from our Spatial Phospho-Signaling Analysis platform. Left: Multiplexed IMC phospho-signaling maps with single-cell segmentation and pathway activation scoring. Center: MALDI-MSI phosphopeptide ion images across tissue regions. Right: LCM-coupled phosphoproteomics MS/MS spectrum and phosphorylation site identification results.
Key data deliverables included in every spatial phospho-signaling analysis project:
- IMC phospho-signaling data package — Pixel-level and single-cell-level phospho-signal intensity maps for all antibodies in the panel, cell type classification masks with signaling pathway activation scores per cell type, spatial neighborhood analysis identifying signaling-defined tissue microenvironments, and multiplexed overlay images correlating phospho-signaling with cell lineage markers and tissue morphology
- MALDI-MSI phosphoproteomics data package — Ion images for all detected phosphopeptide signals with spatial distribution maps overlaid on tissue morphology, phosphopeptide identification by accurate mass matching and MS/MS fragmentation, differential abundance maps comparing phosphopeptide intensities between user-defined tissue regions, and spatial co-localization matrices identifying correlated phospho-signals
- LCM phosphoproteomics data package — Complete list of identified phosphopeptides with phosphorylation site localization scores (≥0.75), annotated MS/MS spectra for each identified phosphopeptide with b- and y-ion series annotation, and relative quantification of phosphopeptides across captured tissue regions
- Multi-modal integration — Coregistered spatial phospho-signaling images overlaid with H&E histology, IHC marker expression, or spatial transcriptomics data from serial sections, enabling direct correlation of phospho-signaling distribution with morphological features, protein expression, and gene expression patterns in the same tissue context
- Statistical analysis — Differential phospho-signaling analysis between tissue regions and experimental groups, spatial signaling correlation metrics, cell-type-specific signaling pathway activation scores with appropriate statistical testing, and drug treatment group comparisons with spatial context
- Methods documentation — Complete protocols for tissue preparation, phospho-antibody staining, MALDI-MSI acquisition, LCM capture, and LC-MS/MS analysis, formatted for publication methods sections and regulatory reference
Related Services
Our spatial phospho-signaling analysis platform is part of a comprehensive PTM and spatial biology service portfolio spanning phosphoproteomics, spatial PTM mapping, enrichment technologies, and bioinformatics integration for multi-omic spatial research programs.
- Spatial PTM Profiling — Integrated spatial profiling platform covering phosphoproteomic, glycomic, and histone modification mapping in tissue sections using imaging mass spectrometry and antibody-based spatial detection
- Spatial Histone Modification Profiling — Dedicated spatial mapping of histone post-translational modifications in FFPE and fresh frozen tissue sections for epigenomic spatial analysis
- Phosphoproteomics Analysis Services — Comprehensive solution-phase phosphoproteomics platform combining IMAC/TiO₂ enrichment and LC-MS/MS for phosphorylation site identification and quantification
- Quantitative Phosphoproteomics Analysis — SILAC, TMT, and label-free quantitative phosphoproteomics for differential phosphorylation analysis across experimental conditions
- Phospho-Signaling Antibody Array — Targeted antibody array-based detection of phospho-signaling proteins in cell and tissue lysates for focused signaling pathway analysis
- Kinase Activity Profiling — Biochemical and mass spectrometry-based kinase activity profiling for drug discovery and signaling network analysis
FAQs
How does IMC-based spatial phospho-signaling analysis differ from conventional phosphoproteomics?
IMC-based spatial phospho-signaling analysis uses metal-tagged phospho-specific antibodies to detect phosphorylation events directly in intact tissue sections at 1 μm (single-cell) resolution, preserving the spatial context of signaling activation — including which cell types show pathway activation, how signaling varies across tissue regions, and how adjacent cells influence each other's signaling states. Conventional phosphoproteomics by LC-MS/MS provides deeper coverage of the phosphoproteome (thousands of phosphopeptides) but requires tissue homogenization, destroying all spatial information. The two approaches are complementary: IMC provides spatial and single-cell resolution with targeted pathway coverage, while LC-MS/MS provides comprehensive phosphoproteomic depth without spatial context. Our platform integrates both modalities to deliver complete spatial phospho-signaling characterization.
Can spatial phospho-signaling analysis be performed on FFPE tissue sections?
Yes — all three of our platforms (phospho-specific IMC, MALDI-MSI, and LCM phosphoproteomics) are fully optimized for FFPE tissue sections. FFPE samples require deparaffinization, rehydration, and heat-induced antigen retrieval optimized for phospho-epitope preservation. Phosphatase inhibitor cocktails are applied throughout the staining protocol to maintain endogenous phosphorylation states. FFPE compatibility is a critical advantage for clinical and translational research, as it enables access to the vast archives of clinically annotated tissue samples in hospital pathology departments and biobanks, including pre-treatment and on-treatment biopsies from clinical trials.
How many phospho-specific antibodies can be multiplexed in a single IMC experiment?
Our standard phospho-signaling IMC panels accommodate 20–35 metal-tagged antibodies in a single tissue section, including phospho-specific antibodies targeting key signaling nodes (p-ERK, p-AKT, p-STAT3, p-S6, p-p38, p-JNK, p-p65, γH2AX, etc.), cell lineage markers for cell type identification (CK, CD45, CD3, CD20, CD68, α-SMA, etc.), and functional markers (Ki-67, cleaved caspase-3, etc.). Custom panel design services allow you to select antibodies specific to your signaling pathways of interest. The multiplexing capacity far exceeds conventional fluorescence-based imaging (limited to 4–7 markers) while eliminating tissue autofluorescence issues.
What tissue section thickness and size are required for spatial phospho-signaling analysis?
For optimal results, we recommend 5–10 μm thick sections for FFPE tissue and 10–12 μm for fresh frozen tissue. Minimum tissue area is approximately 1 mm² for IMC and MALDI-MSI, though smaller regions can be analyzed with reduced signaling marker coverage. For LCM phosphoproteomics, larger capture areas (10–50 mm² cumulative) are typically required to obtain sufficient protein for LC-MS/MS analysis, though recent protocol optimizations have enabled phosphoproteomics from as few as 1,000–5,000 captured cells depending on phosphorylation stoichiometry.
How do you ensure that endogenous phosphorylation states are preserved during tissue processing?
Preservation of endogenous phosphorylation states is critical for accurate spatial phospho-signaling analysis. Our protocols incorporate several measures: (1) immediate fixation of fresh tissue in cold formalin or ethanol to arrest enzymatic activity; (2) inclusion of broad-spectrum phosphatase inhibitor cocktails (including okadaic acid, sodium orthovanadate, sodium fluoride, and β-glycerophosphate) in all aqueous processing steps; (3) optimization of antigen retrieval conditions to maximize phospho-epitope accessibility while minimizing dephosphorylation; (4) validation of phospho-antibody specificity by comparison with control tissues treated with phosphatase or kinase inhibitors; (5) inclusion of internal phospho-signal standards for cross-sample normalization and quality control.
Can spatial phospho-signaling data be quantified and compared across treatment groups?
Yes — quantitative comparison of phospho-signaling across treatment groups is a core capability of our platform. For IMC data, per-cell phospho-signal intensities are normalized and compared across treatment groups using statistical methods appropriate for single-cell data (mixed-effects models, Wilcoxon rank-sum tests, or generalized linear models). For MALDI-MSI data, phosphopeptide ion intensities are normalized to total ion count or internal standards and compared across tissue regions and treatment groups. For LCM phosphoproteomics, label-free quantification or TMT labeling enables relative phosphopeptide abundance comparison across captured regions. All statistical analyses include appropriate multiple testing correction and are delivered with visualization plots and summary statistics.
How are spatial phospho-signaling data analyzed and visualized?
Spatial phospho-signaling data are processed through a multi-step bioinformatics pipeline. For IMC: raw CyTOF data are processed for pixel intensity normalization, single-cell segmentation (using nuclear and membrane markers), per-cell phospho-signal quantification, cell type classification, signaling pathway activation scoring, and spatial neighborhood analysis. For MALDI-MSI: raw mass spectra are processed for baseline correction, peak picking, phosphopeptide identification, ion image reconstruction, and spatial co-localization analysis. For LCM phosphoproteomics: LC-MS/MS data are searched using phosphoproteomics search engines (MaxQuant, Proteome Discoverer) with phosphorylation site localization scoring. Visualization outputs include multiplexed phospho-signaling ion images overlaid on tissue morphology, single-cell signaling heat maps with t-SNE/UMAP clustering, signaling pathway activation spatial maps, and multi-modal overlay images with H&E or transcriptomic data. All data are delivered in standard formats compatible with common spatial analysis platforms.
References
- van Maldegem F, Valand K, Cole M, Patel H, Angelova M, Rana S, Colliver E, Enfield K, Bah N, Kelly G, Tsang VSK, Mugarza E, Moore C, Hobson P, Levi D, Molina-Arcas M, Swanton C, Downward J. Characterisation of tumour microenvironment remodelling following oncogene inhibition in preclinical studies with imaging mass cytometry. Nature Communications. 2021;12:5906.
- Grgic A, Krestensen KK, Heeren RMA. Optimized protocol for MALDI MSI of N-glycans using an on-tissue digestion in fresh frozen tissue sections. Scientific Reports. 2023;13:2776.
- Plattner C, Lamberti G, Blattmann P, Kirchmair A, Rieder D, Loncova Z, Sturm G, Scheidl S, Ijsselsteijn M, Fotakis G, Noureen A, Lisandrelli R, Böck N, Nemati N, Krogsdam A, Daum S, Finotello F, Somarakis A, Schäfer A, Wilflingseder D, Acera MG, Öfner D, Huber LA, Clevers H, Becker C, Farin HF, Greten FR, Aebersold R, de Miranda NF, Trajanoski Z. Functional and spatial proteomics profiling reveals intra- and intercellular signaling crosstalk in colorectal cancer. iScience. 2023;26(12):108399.
For research use only. Not for use in diagnostic procedures.