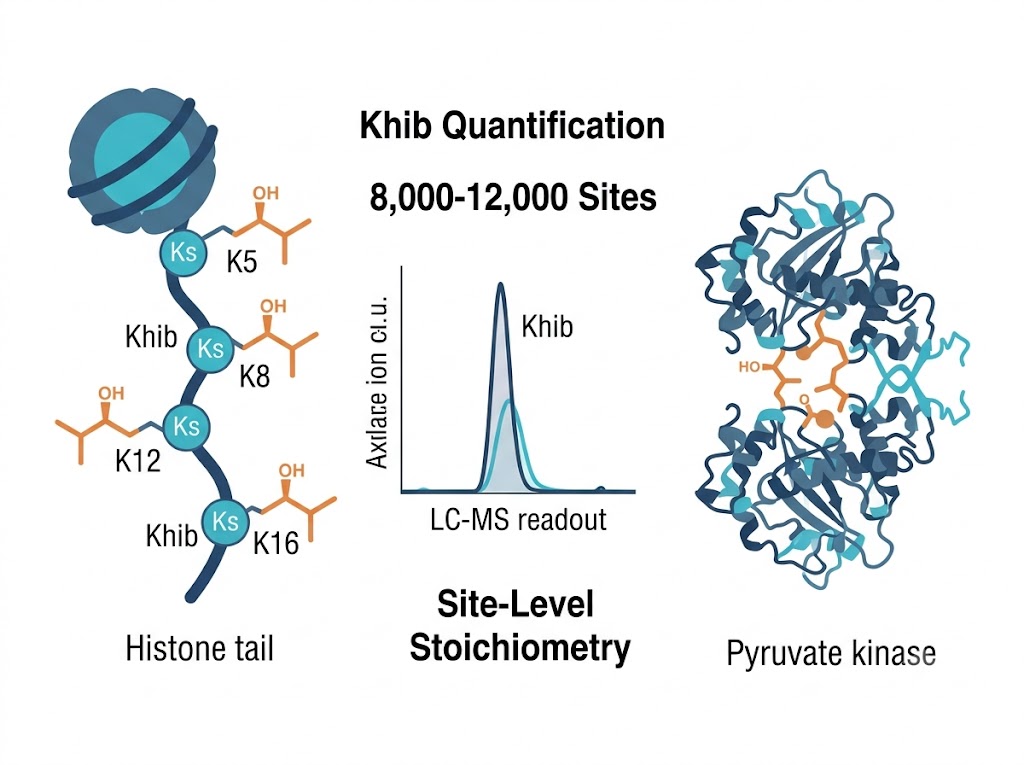
Why Quantify 2-Hydroxyisobutyrylation — Connecting Cellular Metabolism to Epigenetic Regulation
Khib was first described in 2014 by the Zhao lab as a histone mark with a distinctive branched carbon skeleton that distinguishes it from every other lysine acylation. Unlike the straight-chain C2 acetylation or the C4 double-bonded crotonylation, Khib carries a hydroxyl group on a branched isobutyryl chain — a structural feature that alters local protein surface chemistry and, as a consequence, protein-protein interactions, enzymatic activity, and chromatin accessibility in ways that linear acyl chains cannot.
The biological significance of Khib lies in its connection to cellular metabolic state. The acetyltransferase p300 functions as a Khib writer, transferring 2-hydroxyisobutyryl groups from 2-hydroxyisobutyryl-CoA to lysine residues. Histone deacetylases HDAC1, HDAC2, and HDAC3 remove Khib marks. The substrate 2-hydroxyisobutyryl-CoA is produced during ketone body metabolism and branched-chain amino acid catabolism — meaning Khib levels directly reflect metabolic flux through these pathways. In cells cultured under ketogenic conditions or in tissues with active fatty acid oxidation, Khib levels rise. This makes Khib a metabolic sensor that translates nutritional state into chromatin and protein-level responses.
On chromatin, genome-wide mapping studies have shown that Khib marks actively transcribed gene promoters, with substantial overlap with H3K4me3 and H3K9ac. The genes nearest to these Khib-enriched promoters are disproportionately involved in glycolysis, fatty acid metabolism, and oxidative phosphorylation. On non-histone proteins, proteome-wide studies have identified Khib on over 2,000 proteins from diverse species, with strong enrichment for metabolic enzymes. Dysregulation of Khib has been linked to pancreatic cancer, bladder cancer, and plant stress responses — making Khib quantification a valuable tool for any research program at the intersection of metabolism, gene regulation, and disease.
Our Khib Quantification Platform — From Tissue to Site-Specific Stoichiometry
The analytical pipeline for Khib profiling combines peptide-level immunoaffinity enrichment with high-resolution LC-MS/MS.
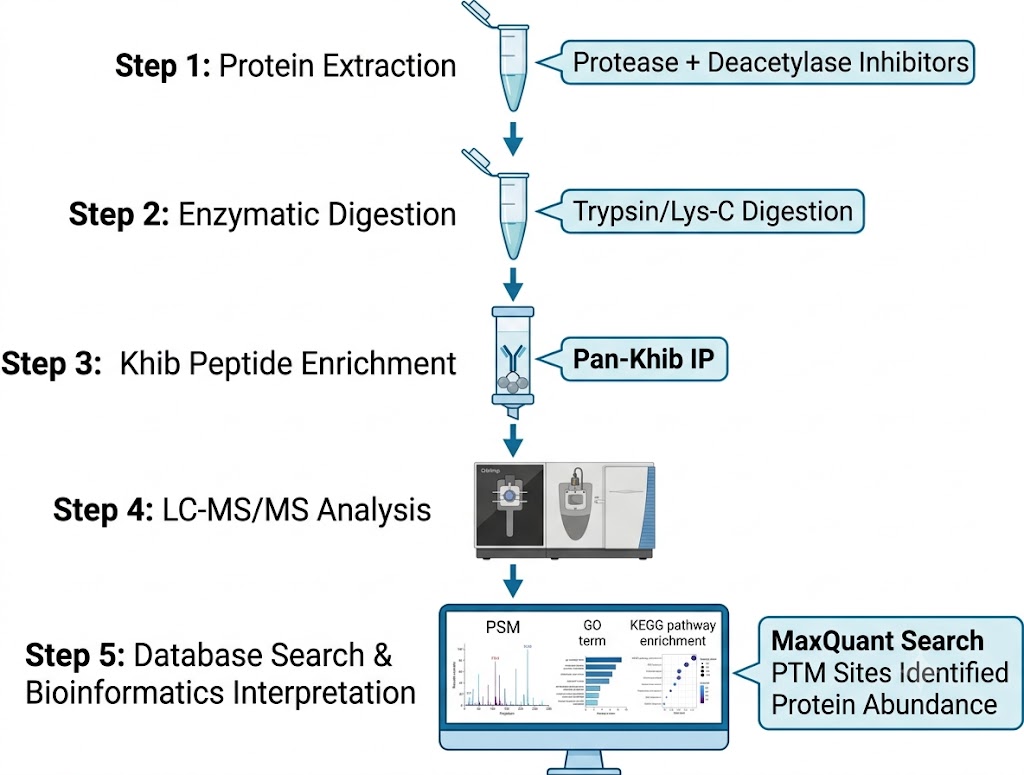
Step 1 — Protein extraction and quantification. Proteins are extracted using an optimized lysis buffer (8 M urea, 50 mM Tris pH 8.0, protease inhibitors, and deacetylase inhibitors including 5 μM TSA and 10 mM NAM to preserve endogenous modification states). Protein concentration is measured by BCA assay. A minimum of 2 mg total protein is recommended; projects with 0.5 mg may proceed with reduced site depth.
Step 2 — Enzymatic digestion. Reduced and alkylated proteins are digested with sequencing-grade trypsin (1:50 enzyme-to-substrate, 37°C, 16 h). For challenging samples (fibrous tissue, FFPE), a dual-enzyme strategy with trypsin + Lys-C is used to improve Khib peptide coverage. Digestion is quenched with formic acid, and peptides are desalted on C18 Sep-Pak cartridges.
Step 3 — Khib peptide enrichment. Desalted peptides are incubated with a validated pan-2-hydroxyisobutyryl-lysine antibody conjugated to agarose beads in IP buffer (50 mM Tris pH 7.5, 100 mM NaCl). After 4-hour incubation at 4°C with gentle rotation, beads are washed sequentially with IP buffer (×3) and water (×2). Khib peptides are eluted with 0.1% TFA and dried by vacuum centrifugation. Antibody specificity is verified in each batch against a panel of competitor acyl-peptides — cross-reactivity is consistently below 2% across all tested modifications.
Step 4 — LC-MS/MS analysis. Enriched Khib peptides are analyzed on an Orbitrap Exploris 480 or Fusion Lumos Tribrid mass spectrometer coupled to an EASY-nLC 1200 nanoLC system. Peptides are separated on a 75 μm × 25 cm C18 column (1.9 μm particles) over a 120-minute gradient (2–35% acetonitrile in 0.1% formic acid). The mass spectrometer operates in DDA mode: full MS scans at 60,000 resolution (350–1,600 m/z), followed by top-20 MS/MS scans at 15,000 resolution with HCD fragmentation (NCE 30%). Dynamic exclusion is set to 30 s.
Step 5 — Database searching and site localization. Raw data are searched against the species-specific UniProt database using MaxQuant (v2.x) with the Andromeda search engine. Khib on lysine (+86.0368 Da) and protein N-terminal acetylation (+42.0106 Da) are set as variable modifications; carbamidomethylation of cysteine (+57.0215 Da) as a fixed modification. Peptide FDR is controlled at <1% using a target-decoy approach. Only sites with localization probability ≥0.75 are reported; probability ≥0.95 indicates high-confidence sites.
Step 6 — Quantification and data processing. Label-free quantification (LFQ) is performed using MaxQuant's built-in LFQ algorithm with match-between-runs enabled. Khib site intensity is normalized to total peptide intensity across samples. For multi-condition comparisons, differential analysis uses a two-sided t-test with permutation-based FDR correction. A minimum of three biological replicates per condition is required for statistically valid differential Khib analysis.
Quantitative Accuracy & QC Metrics — Reproducible Khib Quantification Across Projects
Quantitative rigor is essential for Khib research because the modification is low-abundance and enrichment efficiency varies between runs. We report the following QC metrics for every project:
Identification confidence. PSM FDR < 1% at the peptide and protein level. Site localization probability ≥ 0.75 for standard reporting; sites ≥ 0.95 are flagged as high-confidence. A minimum localization probability difference of 0.1 between top-ranked and second-ranked site is required.
Technical reproducibility. Pooled Khib reference peptide mixtures (from HeLa cell digest, enriched for Khib) are analyzed as a QC standard in every batch. Technical replicate LFQ intensity CV < 15%. Blank injections are run every 10 samples to monitor peptide carryover (acceptable threshold: <1% of preceding sample's total ion current).
Biological replicate precision. Biological replicate CV across LFQ intensities is maintained at < 20% for Khib sites quantified in all replicates. Sites with CV > 30% are flagged as low-confidence and excluded from differential analysis unless manually reviewed.
Enrichment specificity control. In each project, a small aliquot of the flow-through from the Khib IP step is analyzed by LC-MS/MS to confirm that non-Khib peptides do not dominate the enriched fraction. Enrichment specificity is typically 65–85% in well-performed experiments.
System suitability. A BSA digest standard is injected at the beginning, middle, and end of each analytical batch to monitor retention time stability (CV < 0.5 min), mass accuracy (within 3 ppm), and intensity stability (CV < 10%).
Benchmark comparison. We compare project-level Khib site identifications against published datasets from matched tissue types. In human pancreatic tissue projects, we expect 8,000–12,000 Khib sites — comparable to the 10,367 sites reported in the published literature.
Biological Functions of Khib — From Chromatin Regulation to Metabolic Enzyme Control
The functional scope of Khib extends across both nuclear and cytoplasmic compartments, and its regulatory logic differs substantially from better-studied acylations.
Chromatin Regulation
Khib on histone H4 (K5, K8, K12, K16) and H2B strongly correlates with active transcription. ChIP-seq shows Khib-enriched regions overlap H3K4me3 at transcription start sites near genes encoding glycolytic enzymes, ribosomal proteins, and stress response factors — positioning Khib as a chromatin-level coordinator of metabolic gene expression.
Metabolic Enzyme Activity
The branched 2-hydroxyisobutyryl group introduces steric changes at enzyme active sites. HK2 Khib at K420 reduces glycolytic efficiency; IDH1 Khib at K102 impairs TCA cycle isocitrate binding; CPT1A Khib at K497 relieves malonyl-CoA inhibition, activating fatty acid import. Khib functions as a direct metabolic sensor adjusting enzyme activity in proportion to substrate availability.
p53 Tumor Suppressor
Khib on p53 at multiple C-terminal lysine residues (K370, K373, K381, K382) reduces its transcriptional activity by impairing DNA-binding domain recruitment to target gene promoters, directly linking Khib dynamics to cell cycle regulation and apoptosis control.
Estrogen Receptor Alpha
ERα Khib at K302 and K303 — sites also modified by acetylation and SUMOylation — modulates nuclear translocation and target gene activation. This multi-PTM regulatory switch at identical lysine positions enables fine-tuned control of hormone signaling.
Khib in Disease Research — Cancer Metabolism, Metabolic Disorders & Development
The experimental evidence connecting Khib to human disease has accumulated rapidly.
Pancreatic cancer. Lu et al. (2022) performed the first comprehensive Khib proteomics analysis of human pancreatic cancer tissue, identifying 10,367 Khib sites on 2,325 proteins. KEGG pathway analysis revealed strong enrichment of Khib-modified proteins in glycolysis, TCA cycle, and fatty acid degradation pathways. Functional validation using MG149, an inhibitor of the Khib writer Tip60 (p300), showed that reducing Khib levels in pancreatic cancer cell lines significantly suppressed proliferation, migration, and invasion — confirming that Khib is functionally required for cancer cell aggressiveness.
Bladder cancer. Zhang et al. (2023) identified Khib at lysine 260 of ALDH1A1 in bladder cancer tissue. Decreased K260hib modification correlated with reduced ALDH1A1 protein stability and suppression of tumor progression through the retinoic acid pathway, illustrating how a single Khib site can function as a molecular switch in oncogenic signaling.
Metabolic stress and adaptation. In liver and adipose tissue, Khib levels respond dynamically to nutritional state. Fasting and ketogenic diets increase Khib on histones and metabolic enzymes within hours, correlating with rising β-hydroxybutyrate levels. In adipocyte differentiation, Khib on PPARγ and C/EBP family transcription factors appears to regulate differentiation timing.
Plant biology. Zhang et al. (2021) reported the first Khib proteome in wheat root, identifying 6,328 sites on 2,186 proteins. Khib-modified proteins were strongly enriched in carbon metabolism, protein synthesis, and sulfur metabolism. Cross-species comparison revealed that only 60 Khib sites were conserved between wheat, rice, and moss — suggesting rapid evolutionary divergence of Khib substrates.
Bioinformatics & Data Deliverables — From Khib Site List to Pathway-Level Discovery
Our data package transforms raw Khib identification data into interpretable biological insights:
Raw data and processed tables. Raw MS files (.raw) and peak lists (.mgf) are provided. The primary quantification table includes: modification site (position and surrounding ±10 amino acid sequence window), protein ID and gene name, localization probability (0–1), MaxQuant score, LFQ intensity (raw and normalized), sequence coverage, and number of peptide-spectrum matches. For multi-condition projects, fold change, p-value, and adjusted p-value are included.
Sequence motif analysis. Using pLogo or Motif-X, we analyze the ±10 amino acid window around all identified Khib sites to define the sequence preference. The canonical Khib motif features enrichment of acidic residues at the −1 position and hydrophobic residues at the +1 position — a pattern distinct from the acetylation motif.
GO and KEGG pathway enrichment. GO enrichment is performed for biological process, molecular function, and cellular component. KEGG pathway mapping is the key interpretive deliverable — enrichment of Khib-modified proteins in glycolysis, TCA cycle, and fatty acid degradation pathways consistently emerges across species.
PTM crosstalk analysis. For residues modified by multiple PTM types, we provide a crosstalk analysis identifying overlaps with acetylation, succinylation, crotonylation, and ubiquitination. This draws from both multi-PTX projects and public databases (PhosphoSitePlus, dbPTM).
Publication-ready figures. All figures delivered in vector PDF and 300 dpi PNG: Khib site distribution bar chart, motif logo plot, GO/KEGG enrichment bubble chart, Khib abundance heatmap across samples, volcano plot for differential analysis, and STRING protein-protein interaction network with Khib-modified nodes highlighted.
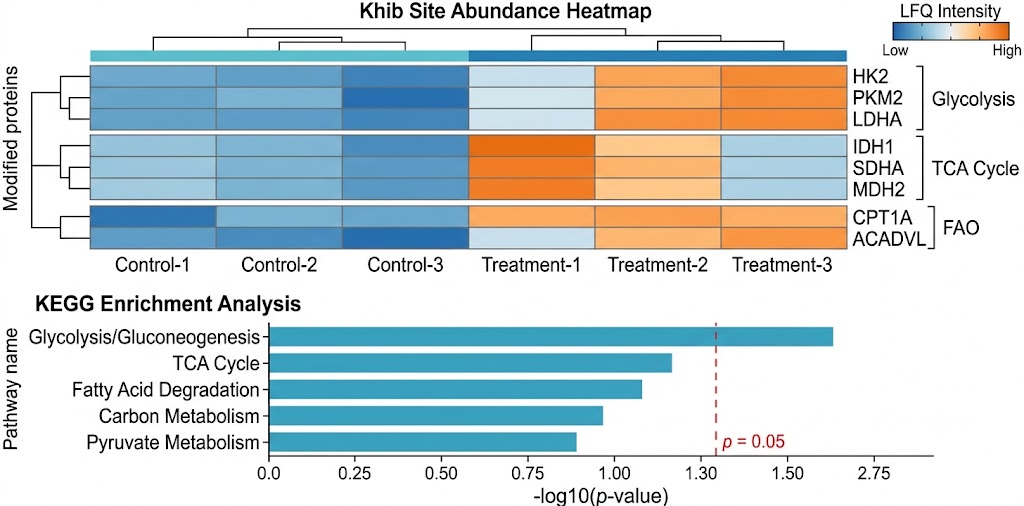
Demo Results — Khib Quantification Data Outputs
Below are representative data visualization deliverables from a typical Khib quantification project. Each figure type addresses a distinct analytical question and is delivered in publication-ready format.
Khib Abundance Heatmap
Hierarchical clustering of Khib site intensities across experimental conditions. Rows represent individual Khib-modified sites (or proteins); columns represent biological replicates. Color scale from deep blue (low abundance) to orange (high abundance), with key metabolic enzyme labels (HK2, PKM2, IDH1, CPT1A) annotated on the right margin.
KEGG & GO Enrichment
Bubble chart showing KEGG pathway enrichment significance (−log10 p-value) against pathway gene ratio. Signature Khib-enriched pathways consistently identified: glycolysis/gluconeogenesis, TCA cycle, fatty acid degradation, carbon metabolism, and pyruvate metabolism. GO terms for metabolic process, catalytic activity, and mitochondrial component.
Differential Analysis Volcano
Volcano plot comparing Khib site abundance between two conditions. Log2 fold change on x-axis, −log10 p-value on y-axis. Significantly upregulated sites in red, downregulated in blue, with key proteins (p53 K370, HK2 K420, CPT1A K497) labeled. Significance cutoff: p < 0.05 with fold change > 1.5.
Sample Requirements for Khib Analysis — Maximizing Site Coverage and Quantitative Reliability
| Sample Type |
Minimum Amount |
Recommended Amount |
Notes |
| Cultured cells (pellet) |
5 × 10⁶ |
1–2 × 10⁷ |
Flash-freeze in LN2, −80°C |
| Fresh frozen tissue (soft) |
20 mg |
50–100 mg |
Snap-freeze, avoid RNAlater |
| Fresh frozen tissue (fibrous) |
50 mg |
200–300 mg |
LN2 grinding recommended |
| Total protein extract |
0.5 mg |
2–5 mg |
Concentration ≥ 1 mg/mL |
| Plasma/serum |
100 μL |
200–500 μL |
HAP depletion available |
| FFPE tissue |
5 × 10 μm sections |
10–15 sections |
Deparaffinization included |
| Plant tissue |
100 mg |
300–500 mg |
Buffer optimization required |
Quality requirements: Protein extract should show no visible degradation on SDS-PAGE. Include protease inhibitor cocktail and deacetylase inhibitors (5 μM TSA + 10 mM NAM) in lysis buffer to preserve endogenous Khib levels. Avoid EDTA > 5 mM, which inhibits trypsin digestion.
Shipping and storage: Ship on dry ice (minimum 5 kg, sufficient for 72-hour transit). Store at −80°C upon receipt. Avoid more than two freeze-thaw cycles.
Biological replicates: Minimum three per condition for differential analysis. Pilot studies can proceed with two but statistical power will be limited.
Frequently Asked Questions About 2-Hydroxyisobutyrylation Quantification
Q: How does Khib differ from lysine acetylation, and why would I study Khib instead?
A: Khib and acetylation differ in chemical structure (C4 branched + hydroxyl vs C2 straight), biological regulation (Khib responds to ketone body metabolism, acetylation to acetyl-CoA from glucose), and target spectrum (Khib is proportionally more abundant on metabolic enzymes). At the same lysine residue, Khib and acetylation can have opposite effects on protein stability. We recommend studying both when possible.
Q: What depth of Khib coverage should I expect from my sample type?
A: For human cell lines and soft tissues: 8,000–12,000 Khib sites on 2,000–3,000 proteins. For plant tissues: 4,000–7,000 sites. For limited-input projects (<1 mg protein): 2,000–5,000 sites. These ranges are consistent with published datasets.
Q: How do you ensure Khib enrichment specificity?
A: Each lot of pan-Khib antibody is validated against a panel of competitor acyl-peptides (acetyl, butyryl, crotonyl, succinyl, propionyl). Cross-reactivity is below 2% before the antibody enters our workflow. Additionally, a flow-through fraction from every project is analyzed to verify that non-Khib peptides are not major components of the enriched sample.
Q: Can I compare Khib levels across conditions quantitatively?
A: Yes. Our LFQ-based quantification with match-between-runs enables cross-condition comparison. With three or more biological replicates per condition, we perform differential Khib analysis with statistical testing and FDR correction.
Q: What is the minimum sample amount for a pilot Khib study?
A: For a pilot feasibility assessment, 0.5 mg total protein is sufficient. The resulting data (typically 1,000–3,000 sites) determines whether Khib is detectable at useful depth in your sample type.
Q: Can you analyze Khib and another PTM (acetylation, crotonylation) from the same sample?
A: Yes. We offer multi-PTX enrichment from the same biological sample by splitting the digested peptide pool into equal aliquots for parallel enrichment with different PTM-specific antibodies. This provides direct comparison of modification crosstalk without biological variation between runs.
Case Study — Global Khib Landscape in Human Pancreatic Cancer
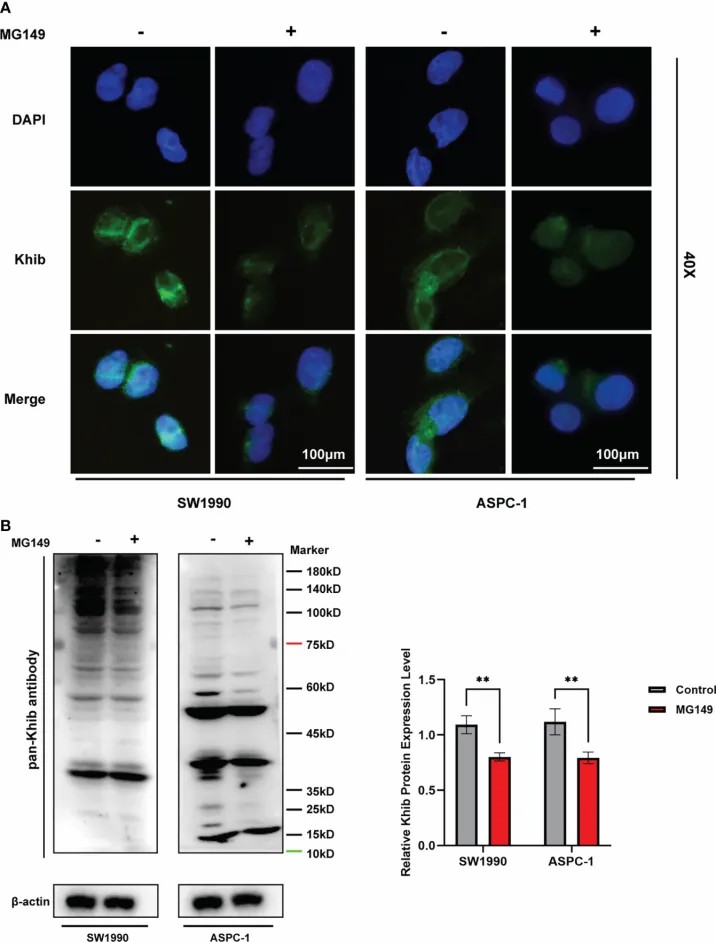
Study overview. Lu and colleagues (Frontiers in Oncology, 2022) performed the first comprehensive Khib proteomics analysis of human pancreatic cancer, establishing the extent and functional significance of Khib remodeling in a solid tumor.
Methods. Pancreatic cancer tissues from seven patients were subjected to protein extraction, trypsin digestion, pan-Khib antibody enrichment, and LC-MS/MS analysis on an Orbitrap mass spectrometer. The study included both global Khib landscape identification and functional validation in pancreatic cancer cell lines (SW1990, ASPC-1).
Key findings. The analysis identified 10,367 Khib sites on 2,325 proteins. Khib-modified proteins were significantly enriched in glycolysis, TCA cycle, and fatty acid degradation. MG149 (Tip60 inhibitor) treatment reduced global Khib levels and suppressed cancer cell proliferation, colony formation, migration, and invasion (Fig. 6, Fig. 7). The comparison across Khib, succinylation, and acetylation identified 105 proteins with 80 sites modified by all three PTMs, suggesting coordinated cross-type regulation.
Relevance. This study demonstrates that Khib analysis is feasible from clinical tissue samples with limited starting material, that the resulting data connects directly to metabolic pathway biology, and that functional follow-up using writer inhibitors is possible. For researchers planning Khib projects, this work provides a benchmark for expected site depth and biological interpretability. (Source: Lu et al., 2022, doi:10.3389/fonc.2022.1001807)
Related Services
References
- Dai L, Peng C, Montellier E, et al. Lysine 2-hydroxyisobutyrylation is a widely distributed active histone mark. Nature Chemical Biology. 2014;10(5):365-370. doi:10.1038/nchembio.1497
- Lu Y, Li X, Zhao K, et al. Global landscape of 2-hydroxyisobutyrylation in human pancreatic cancer. Frontiers in Oncology. 2022;12:1001807. doi:10.3389/fonc.2022.1001807
- Zhang Y, Wang G, Song L, et al. Global analysis of lysine 2-hydroxyisobutyrylation in wheat root. Scientific Reports. 2021;11:8513. doi:10.1038/s41598-021-85879-y
- Zhang Z, Wang Y, Liang Z, et al. Modification of lysine-260 2-hydroxyisobutyrylation destabilizes ALDH1A1 expression to regulate bladder cancer progression. iScience. 2023;26(12):108142. doi:10.1016/j.isci.2023.108142
*This service is provided for research use only (RUO). It is not intended for clinical diagnostic or therapeutic applications.