Tissue-Resolved Glycosylation Analysis for Understanding Glycan Function in Disease
Protein glycosylation — the enzymatic attachment of complex oligosaccharide structures to asparagine (N-glycosylation) or serine/threonine (O-glycosylation) residues — is the most structurally diverse post-translational modification, with over 7,000 known glycan structures in the human glycome. Glycosylation patterns are exquisitely sensitive to cellular state, differentiation stage, and disease progression, making them one of the most information-rich classes of molecular markers for tissue pathology. However, conventional glycomics and glycoproteomics workflows that rely on tissue homogenization irreversibly destroy spatial information, averaging glycan signals across morphologically distinct regions including tumor epithelium, stroma, immune infiltrates, and necrotic areas. This loss of spatial context is particularly problematic for glycosylation, which exhibits pronounced heterogeneity across tissue microenvironments — the same glycan structure may be upregulated in tumor cells while simultaneously downregulated in adjacent stromal fibroblasts, a distinction that is completely lost in bulk analysis.
Spatial glycan and lectin profiling overcomes this limitation by detecting and localizing glycan structures directly within intact tissue sections. Lectin-based imaging approaches use glycan-binding proteins (lectins) with defined carbohydrate specificities as in situ probes, while MALDI-MSI provides untargeted, label-free detection of N-glycans and O-glycans released directly from tissue surfaces. Together, these complementary platforms enable researchers to map glycan distributions at resolutions ranging from single-cell (lectin imaging mass cytometry at 1 μm) to region-specific (MALDI-MSI at 10–50 μm pixel size), and to correlate glycosylation patterns with protein expression, transcript abundance, and histopathological features in the same tissue context. For comprehensive glycoproteomic analysis of specific tissue regions identified through spatial profiling, our Glycoproteomics Analysis Services provide complementary homogenate-based glycopeptide identification and site-specific glycosylation characterization.
Find Your Solution: Research Goal → Spatial Glycan Profiling Strategy
| Your Research Goal |
Recommended Approach |
Key Techniques |
| Multiplexed glycan motif mapping in FFPE tissue microarrays across multiple disease and normal tissue cores |
Lectin-based imaging mass cytometry (IMC) with multiplexed metal-tagged lectin panel |
Metal-conjugated lectin panel (12+ lectins), IMC acquisition at 1 μm resolution, single-cell segmentation, glycan motif quantification per cell type, spatial neighborhood analysis |
| Untargeted discovery of N-glycan spatial distribution in fresh frozen or FFPE tissue sections |
MALDI-mass spectrometry imaging (MALDI-MSI) with on-tissue PNGase F digestion |
On-tissue N-glycan release, MALDI-MSI acquisition at 10–50 μm pixel size, sialic acid stabilization (methylamidation), glycald composition assignment, spatial co-localization analysis |
| Spatial profiling of O-glycans and sialic acid linkage variants in tissue |
Lectin histochemistry with linkage-specific lectins + MALDI-MSI sialic acid linkage differentiation |
Linkage-specific lectins (SNA for α2,6-sialic acid, MAL-I/MAL-II for α2,3-sialic acid), chemical derivatization for sialic acid linkage stabilization, on-tissue O-glycan release by reductive β-elimination |
| Region-specific glycoproteomics: identifying glycoproteins and glycosylation sites from specific tissue regions |
Laser capture microdissection (LCM) + LC-MS/MS glycoproteomics |
LCM capture of defined tissue regions (tumor epithelium, stroma, immune infiltrates), protein extraction, tryptic digestion, glycopeptide enrichment (HILIC or lectin affinity), LC-MS/MS with stepped HCD fragmentation |
| Multi-modal integration of spatial glycan data with spatial transcriptomics or proteomics |
Serial section multi-omics or same-section multi-modal workflow |
Adjacent tissue section correlation, same-section sequential workflows (MALDI-MSI → H&E staining → IHC), spatial data coregistration, multi-modal image alignment and overlay |
| High-throughput glycan biomarker screening across large clinical tissue cohorts |
Automated lectin microarray + tissue microarray (TMA) imaging pipeline |
Automated lectin staining on TMA slides, high-content fluorescence scanning, quantitative lectin binding scoring, correlation with clinical annotations and survival data |
Complementary Platforms for Spatial Glycan Detection and Glycoproteomic Analysis
Our spatial glycan profiling service portfolio encompasses three complementary technology platforms, each optimized for specific spatial resolution, glycan coverage, and sample type requirements. Platform selection depends on the research question, available tissue material, glycan classes of interest, and desired spatial resolution.
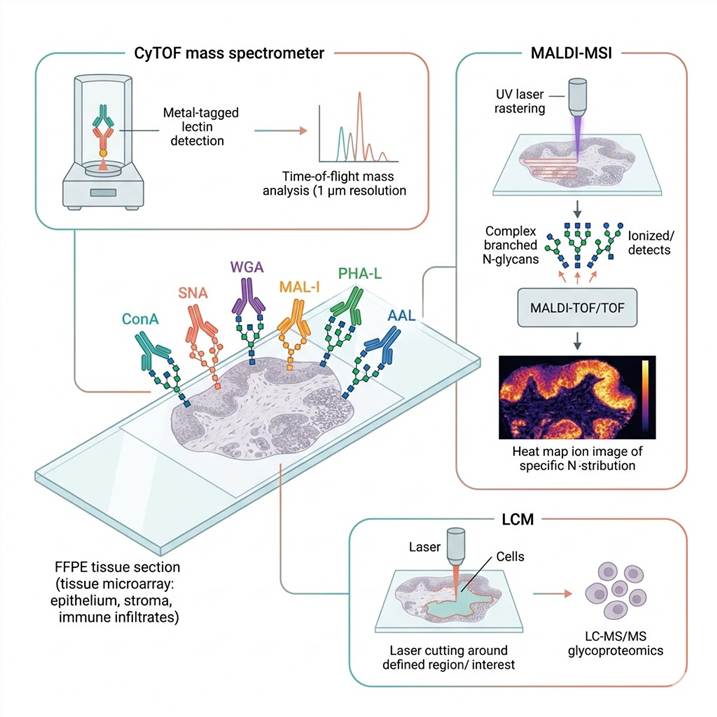
Lectin-Based Imaging Mass Cytometry (IMC) for Multiplexed Glycan Motif Mapping
Lectin-based IMC uses a panel of metal isotope-tagged lectins with defined carbohydrate specificities — including concanavalin A (ConA, oligomannose/bisecting GlcNAc), wheat germ agglutinin (WGA, GlcNAc/sialic acid), Sambucus nigra lectin (SNA, α2,6-sialic acid), Maackia amurensis lectin I/II (MAL-I/MAL-II, α2,3-sialic acid), Aleuria aurantia lectin (AAL, fucose), Phaseolus vulgaris lectin (PHA-L/PHA-E, β1,6-branched N-glycans), and Ulex europaeus agglutinin I (UEA-I, α1,2-fucose) — to simultaneously detect 12+ glycan motifs in a single tissue section at 1 μm spatial resolution. After lectin staining, the tissue is introduced into a CyTOF (cytometry by time-of-flight) mass spectrometer where the metal tags are quantified by atomic mass spectrometry, generating pixel-by-pixel glycan motif maps that can be segmented by cell type and analyzed for spatial relationships. The metal-tag detection strategy eliminates tissue autofluorescence and spectral overlap issues that limit conventional fluorescence-based lectin multiplexing, and the 1 μm spatial resolution approaches the dimensions of individual mammalian cells, enabling single-cell glycan profiling within the tissue context. This platform is ideally suited for biomarker discovery in cancer tissue microarrays, where differences in glycan motif expression between tumor and stroma compartments can be quantified with single-cell resolution across large patient cohorts.
MALDI-Mass Spectrometry Imaging (MALDI-MSI) for Untargeted N-Glycan and O-Glycan Spatial Mapping
MALDI-MSI provides label-free, untargeted detection of glycans released directly from tissue sections, enabling simultaneous mapping of 30–150+ glycan compositions in a single imaging experiment. The workflow begins with on-tissue enzymatic digestion using PNGase F (for N-glycan release from FFPE or fresh frozen tissue) or chemical release by reductive β-elimination (for O-glycans), followed by matrix application and MALDI-MSI acquisition at 10–50 μm spatial resolution. Each pixel in the resulting ion image represents the complete glycan mass spectrum at that tissue location, generating spatially resolved glycan abundance maps that can be overlaid with the histological image of the same section. Sialic acid stabilization chemistry — including methylamidation or ethyl esterification — preserves sialylated glycan signals during ionization and enables differentiation of α2,3-linked and α2,6-linked sialic acid isomers based on mass shifts after linkage-specific derivatization. The untargeted nature of MALDI-MSI makes it the platform of choice for discovery-phase spatial glycomics, where the goal is to identify glycan structures whose spatial distribution correlates with tissue pathology, treatment response, or patient outcome. For orthogonal validation and site-specific glycoproteomic characterization of glycans identified by MALDI-MSI, our Site-Specific Glycosylation Analysis service provides complementary LC-MS/MS-based glycopeptide identification.
Laser Capture Microdissection (LCM) and Spatial Glycoproteomics by LC-MS/MS
For researchers who require identification of both the glycan structure and the protein carrier and glycosylation site from specific tissue regions, LCM-coupled LC-MS/MS glycoproteomics provides the missing molecular detail. After spatial glycan mapping by MALDI-MSI or lectin IMC identifies tissue regions of interest — for example, a tumor-associated glycan hotspot in the invasive front — adjacent tissue sections are used for LCM capture of the corresponding regions. Captured tissue microdissections (typically 500–5,000 cells per region) are subjected to protein extraction, reduction, alkylation, and tryptic digestion, followed by glycopeptide enrichment using HILIC or multi-lectin affinity chromatography and LC-MS/MS analysis with stepped HCD fragmentation for simultaneous glycan and peptide backbone sequencing. This approach bridges the gap between spatial mapping (which provides glycan distribution but not protein carrier identity) and conventional glycoproteomics (which provides site-specific information but destroys spatial context). For comprehensive glycopeptide enrichment and glycoproteomics support, our Glycopeptide Enrichment and Modified Peptide Enrichment Services provide complementary HILIC, lectin affinity, and covalent hydrazide chemistry-based enrichment platforms.
Why Choose Our Spatial Glycan and Lectin Profiling Services
Integrated Multi-Platform Spatial Glycan Detection Under a Single Service Relationship
We offer the three most advanced spatial glycan profiling platforms — lectin-based imaging mass cytometry (12+ multiplexed glycan motifs, 1 μm resolution), MALDI-MSI (untargeted N-glycan mapping, 10–50 μm resolution, sialic acid linkage differentiation), and LCM-coupled LC-MS/MS glycoproteomics (region-specific glycopeptide identification) — within a single service relationship. This integration eliminates the need to coordinate separate providers for imaging and glycoproteomics and ensures that findings from one platform are directly validated and extended by the others on matched tissue samples.
Comprehensive Glycan Structural Coverage from Single-Cell to Tissue-Scale Resolution
Our combined platform portfolio covers the full glycan structural space — N-glycans (complex, hybrid, oligomannose, core-fucosylated, bisecting GlcNAc, sialylated), O-glycans (Core 1–4, extended, sialylated, fucosylated), terminal glycan epitopes (Lewis X, Lewis Y, sialyl Lewis X, T/Tn antigens, blood group antigens), and sialic acid linkage variants (α2,3 vs α2,6) — at spatial resolutions ranging from single-cell (1 μm lectin IMC) through cellular (10 μm MALDI-MSI) to tissue-region (50 μm MALDI-MSI and LCM).
Both FFPE Archival and Fresh Frozen Tissue Compatibility
All three platforms are optimized for FFPE tissue sections, enabling access to the vast archives of clinically annotated formalin-fixed tissues in hospital pathology departments and tissue banks. Fresh frozen tissue protocols are also available for all platforms, with MALDI-MSI on fresh frozen tissue typically yielding higher glycan detection sensitivity and broader coverage due to reduced crosslinking and better enzymatic digestion efficiency. We provide guidance on optimal tissue preservation and sectioning protocols for each platform and research goal.
Multi-Modal Data Integration with Spatial Transcriptomics, Proteomics, and Histology
Spatial glycan data is most powerful when interpreted in the context of other molecular and morphological features. Our bioinformatics platform supports multi-modal data coregistration, enabling correlation of lectin IMC or MALDI-MSI glycan maps with H&E-stained histology, immunohistochemistry (IHC) markers, spatial transcriptomics data (from Visium, Xenium, or MERFISH platforms), and spatial proteomics data (from GeoMx DSP or IMC platforms) on serial tissue sections. Spatial correlation analysis, neighborhood enrichment, and multi-modal clustering are performed to identify glycan-associated tissue microenvironments.
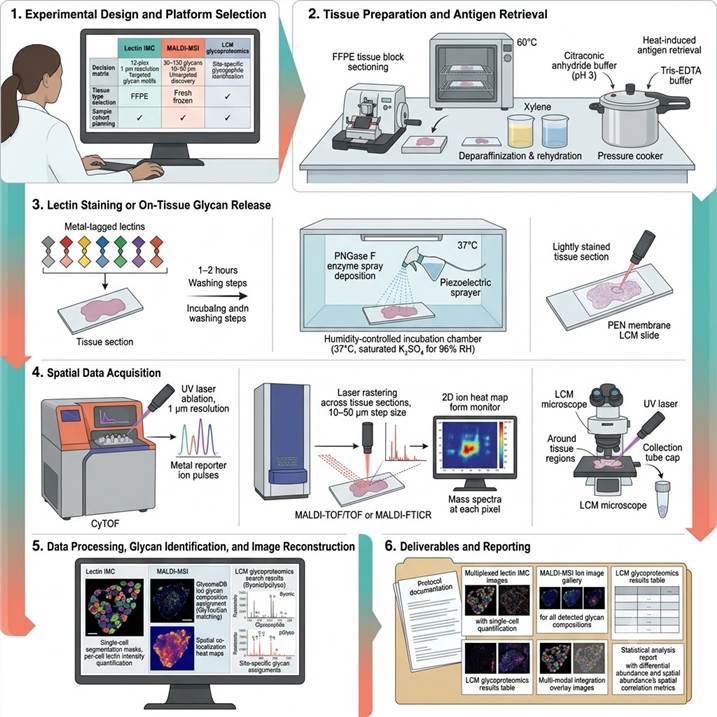
Workflow: From Tissue Section to Publication-Ready Spatial Glycan Maps
Step 1: Experimental Design and Platform Selection
We consult with you to define the spatial glycan profiling strategy based on tissue type (FFPE or fresh frozen), research objective (targeted glycan motif mapping or untargeted glycan discovery), desired spatial resolution (single-cell, cellular, or tissue-region), sample cohort size, and integration requirements with other spatial omics modalities. Tissue sectioning parameters (thickness, orientation, serial sectioning plan) are optimized for the selected platform.
Step 2: Tissue Preparation and Antigen Retrieval
FFPE tissue sections are deparaffinized, rehydrated, and subjected to heat-induced antigen retrieval in citraconic anhydride buffer (for MALDI-MSI glycan release) or Tris-EDTA buffer (for lectin IMC). Fresh frozen sections are fixed in cold ethanol or formalin, washed, and processed directly. Tissue morphology is documented by H&E staining of a reference serial section for pathological annotation and region-of-interest definition.
Step 3: Lectin Staining or On-Tissue Glycan Release
For lectin IMC: metal-tagged lectin panel is applied to the tissue section, incubated for 1–2 hours, washed, and dried for CyTOF acquisition. For MALDI-MSI: PNGase F is applied by spray deposition or acoustic spotting for N-glycan release (37°C, 1–2 hours in humidity-controlled chamber), followed by sialic acid stabilization chemistry (methylamidation) and MALDI matrix application by sublimation or spray coating. For LCM glycoproteomics: the tissue section is lightly stained for visualization and mounted on LCM slides for capture.
Step 4: Spatial Data Acquisition
Lectin IMC: tissue is ablated by UV laser at 1 μm resolution in a CyTOF instrument, generating pixel-by-pixel metal reporter counts for each lectin across the tissue area. MALDI-MSI: mass spectra are acquired at 10–50 μm pixel size across the tissue section, generating ion images for each detected glycan composition (m/z value). LCM: regions of interest are identified by reference to spatial glycan maps or H&E annotation, captured by laser microdissection, and collected for downstream LC-MS/MS. Each acquisition is accompanied by appropriate quality control samples.
Step 5: Data Processing, Glycan Identification, and Image Reconstruction
Lectin IMC data are processed for single-cell segmentation (using nuclear and membrane markers), cell type classification, and per-cell lectin signal quantification with spatial statistics. MALDI-MSI data are processed for spectral peak picking, glycan composition assignment (accurate mass matching to glycan databases with 5 ppm tolerance), ion image reconstruction, spatial co-localization analysis, and differential abundance mapping between tissue regions. LCM-LC-MS/MS data are searched by glycoproteomics search engines (Byonic, pGlyco) for glycopeptide identification with site-specific glycan assignment. Multi-modal image coregistration is performed for integrated visualization.
Step 6: Deliverables and Reporting
Comprehensive spatial glycan profiling report including: experimental protocols with tissue preparation and platform parameters, lectin IMC images with glycan motif maps and single-cell quantification, MALDI-MSI ion images for all detected glycan compositions with spatial distribution maps, LCM glycoproteomics results with identified glycopeptides and glycosylation sites, multi-modal integration images correlating glycan distribution with morphology and molecular markers, and statistical analysis results with differential abundance and spatial correlation metrics.
Applications in Spatial Glycan and Lectin Profiling Research
Spatial glycan profiling has emerged as a transformative approach for understanding the role of glycosylation in tissue biology, disease progression, and therapeutic response. The following application areas represent the most active and impactful use cases for this technology.
Tumor-Associated Glycan Biomarker Discovery and Spatial Mapping
Cancer-associated glycosylation alterations — including increased β1,6-branched N-glycans, overexpression of sialyl Lewis antigens, truncated O-glycans (Tn and sialyl-Tn antigens), and altered core fucosylation — are among the most clinically validated glycan biomarkers yet their spatial distribution within the tumor microenvironment remains poorly characterized. Our lectin IMC and MALDI-MSI platforms enable systematic mapping of tumor-associated glycan alterations directly in cancer tissue microarrays, correlating glycan spatial patterns with histological grade, invasion front, immune infiltrate composition, and patient survival. The spatial context is particularly informative for glycan biomarkers: Tn antigen expression in the invasive front versus the tumor core may carry fundamentally different prognostic significance, a distinction that only spatial profiling can resolve. For comprehensive phosphorylated and acetylated PTM analysis in the same spatial context, our Spatial PTM Profiling service provides complementary phosphoproteomic and acetylomic spatial mapping capabilities.
Tumor Microenvironment Glycan-Immune Interactions
Glycans on tumor cells and stromal cells directly regulate immune cell function through interactions with lectin receptors on immune cells — including SIGLECs (sialic acid-binding immunoglobulin-type lectins), selectins (carbohydrate-binding adhesion molecules), and galectins (β-galactoside-binding proteins). Spatial mapping of both tumor glycans and immune lectin receptors in the same tissue section enables identification of glycan-immune interaction niches that may predict immunotherapy response or resistance. For example, high sialic acid expression in the tumor-immune synapse region identified by spatial glycan profiling can reveal immunosuppressive microenvironments where SIGLEC-mediated immune checkpoint activity is spatially concentrated, providing a tissue-level biomarker for anti-SIGLEC therapeutic strategies.
Reference Glycan Atlas Construction Across Normal and Diseased Human Tissues
Large-scale spatial glycan atlases — mapping the N-glycome and O-glycome across multiple tissue types with matched normal and disease comparisons — provide essential reference resources for the glycobiology community. Using MALDI-MSI with standardized tissue microarrays, we support construction of comprehensive glycan distribution maps across bladder, breast, colon, liver, lung, pancreas, prostate, and other tissue types, with quantitative glycan abundance measurements for each tissue region and cell type. These atlases enable researchers to identify tissue-specific glycosylation patterns, discover glycan alterations common across multiple cancer types versus tissue-specific glycan changes, and prioritize glycan biomarker candidates with the most favorable tissue distribution characteristics. For spatial analysis of histone modifications in parallel tissue cohorts, our Spatial Histone Modification Profiling service provides complementary epigenomic spatial mapping.
Inflammatory and Fibrotic Disease Glycan Remodeling
Glycosylation patterns are dynamically remodeled during inflammation and fibrosis, with alterations in N-glycan branching, sialylation, and fucosylation on both immune cells and tissue-resident cells reflecting disease activity and progression. Spatial glycan profiling of inflamed versus healthy tissue regions enables identification of disease-associated glycan signatures, mapping of glycan changes across the inflammatory gradient (acute inflammation → chronic inflammation → fibrosis → resolution), and discovery of glycan-based biomarkers for disease staging and therapeutic monitoring. In fibrotic diseases including liver fibrosis, pulmonary fibrosis, and renal fibrosis, spatial profiling of extracellular matrix glycosylation reveals glycan modifications on collagen and other matrix proteins that regulate matrix stiffness, cell adhesion, and growth factor sequestration in a spatially heterogeneous manner.
Developmental Glycobiology and Tissue Morphogenesis
Glycosylation patterns change dramatically during embryonic development, tissue morphogenesis, and stem cell differentiation, with specific glycan structures serving as stage-specific markers of cell identity and differentiation state. Spatial glycan profiling of developing tissues — including brain, kidney, lung, and gastrointestinal tract — enables mapping of glycan expression dynamics across developmental time points and tissue compartments. The single-cell resolution of lectin IMC is particularly valuable for developmental studies, where glycan differences between adjacent cell lineages in a developing organ primordium can be resolved at the cellular level. These studies provide fundamental insights into the role of glycosylation in cell-cell recognition, tissue patterning, and organogenesis, with implications for regenerative medicine and stem cell biology.
Case Study: An N-Glycome Tissue Atlas of 15 Human Normal and Cancer Tissue Types Determined by MALDI-Imaging Mass Spectrometry
In a 2024 study published in Scientific Reports (Nature Portfolio, CC BY 4.0), Wallace et al. performed the largest and most systematic spatial N-glycome profiling study to date, mapping N-glycan distributions across 15 human tissue types with matched normal and tumor comparisons using MALDI-imaging mass spectrometry, providing a comprehensive reference resource for tissue-specific glycosylation patterns in cancer.
Background: Despite the well-established importance of N-glycosylation alterations in cancer — including increased β1,6-branched N-glycans linked to tumor invasion, altered core fucosylation associated with therapeutic resistance, and increased oligomannose N-glycans observed in multiple cancer types — a systematic, multi-tissue reference resource for spatially resolved N-glycan distributions in both normal and malignant human tissues had not been constructed. Previous MALDI-MSI studies had focused on individual tissue types using varied protocols, precluding direct cross-tissue comparisons and identification of tissue-specific versus pan-cancer N-glycan alterations within a single standardized experimental framework. The authors addressed this gap by applying a uniform MALDI-MSI N-glycan imaging protocol to custom tissue microarrays (TMAs) containing paired normal and tumor cores from 15 tissue types, enabling the first comprehensive spatial N-glycome tissue atlas with consistent experimental conditions across all tissue types.
Approach: Two custom FFPE TMA blocks were constructed by the Hollings Cancer Center Biorepository, containing paired normal and tumor tissue cores from the same pathology blocks across 15 tissue types — bladder, breast, cervix, colon, esophagus, gastric, kidney, liver, lung, pancreas, prostate, sarcoma, skin, thyroid, and uterus — with 3–10 core pairs per tissue type (89 total core pairs, 198 cores). Tissue sections were deparaffinized, subjected to heat-induced antigen retrieval in citraconic anhydride buffer, and N-glycans were released on-tissue by PNGase F Prime spray deposition using an HTX M5 sprayer (45°C, 2 hours). MALDI-MSI acquisition was performed on a SolariX 7T MALDI-FTICR mass spectrometer (700–4,000 m/z range, positive ion mode) and a timsTOF Flex MALDI-QTOF (20–25 μm laser spot, 40 μm raster) for full tissue section imaging. For core fucosylation-specific analysis, parallel sections were treated with endoglycosidase F3 (EndoF3), which cleaves only core-fucosylated N-glycans. Sialic acid linkage differentiation was performed using alkyne-amidation Xtra Linker (AAXL) stabilization chemistry, enabling distinction between α2,3- and α2,6-linked sialic acids. Data were processed in SCiLS Lab 2022b Pro, with N-glycan composition assignment by accurate mass matching to an in-house database (97 N-glycan compositions).
Key Findings:
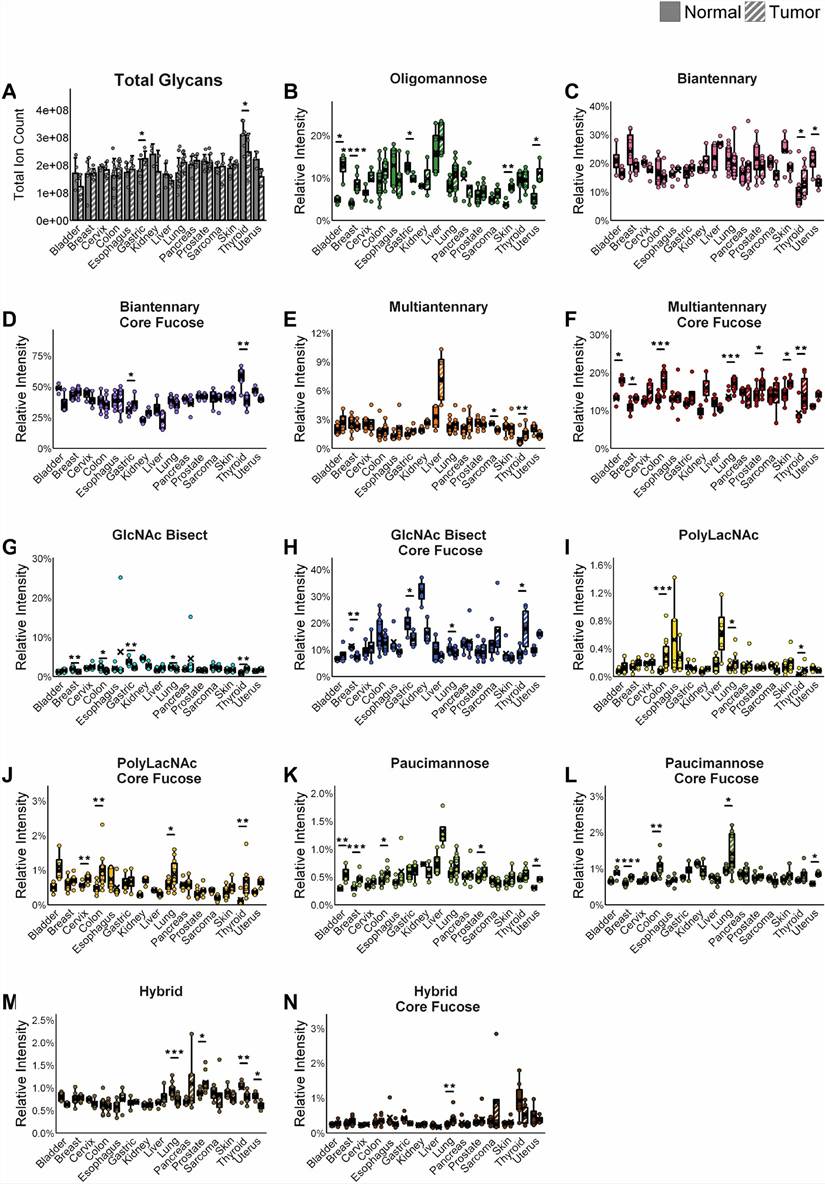
- Comprehensive multi-tissue N-glycan reference dataset: A total of 97 N-glycan compositions were identified and quantified across the 15 tissue types, with the most abundant N-glycan across nearly all tissues being the core-fucosylated biantennary glycan at m/z 1809.64 (Hex5dHex1HexNAc4), providing the most extensive standardized reference dataset for human tissue N-glycosylation patterns generated by MALDI-MSI
- Tissue-specific N-glycan signatures: Distinct tissue-specific N-glycan profiles were observed, with liver tissue showing the highest relative abundance of oligomannose N-glycans, prostate tissue exhibiting elevated multiantennary glycans, and pancreatic tissue characterized by increased bisecting GlcNAc-containing structures — establishing that each tissue type maintains a characteristic N-glycan baseline that is distinguishable by MALDI-MSI
- Cancer-associated N-glycan alterations: Oligomannose N-glycans were significantly elevated in most cancer types compared to matched normal tissue, while multiantennary and core-fucosylated N-glycans showed tissue-specific increases in bladder, breast, colon, lung, prostate, skin, and thyroid cancers — demonstrating that cancer-associated N-glycan remodeling exhibits both pan-cancer and tissue-specific features
- Core fucosylation spatial patterns: EndoF3 analysis revealed that core-fucosylated N-glycans account for 30–60% of total N-glycans depending on tissue type, with cancer-associated increases in core fucosylation observed predominantly in epithelial-derived cancers (bladder, breast, colon, lung, prostate) and spatial enrichment of core-fucosylated glycans at the tumor-stroma interface
- Sialic acid linkage mapping: AAXL stabilization chemistry enabled differentiation of α2,3- and α2,6-linked sialic acids across all tissue types, revealing that α2,6-linked sialic acids predominate in most normal tissues while the ratio of α2,3/α2,6 sialylation shifts in cancer, with particularly pronounced increases in α2,3-sialylation in colon and pancreatic adenocarcinomas
Significance: This study established the first comprehensive spatial N-glycome atlas of 15 human tissue types within a standardized experimental framework, providing an essential reference resource for the glycobiology and cancer research communities. The multi-tissue design — enabled by the TMA format and uniform MALDI-MSI protocols — allowed the first direct cross-tissue comparison of N-glycan spatial distributions and cancer-associated alterations, revealing that N-glycan remodeling in cancer is both tissue-specific and shared across tissue types. The inclusion of core fucosylation (by EndoF3) and sialic acid linkage (by AAXL) analysis within the same experimental framework provided multi-dimensional glycan structural information from the same tissue cohorts. The reference dataset and demonstrated workflow are directly transferable to our spatial glycan profiling platform, where MALDI-MSI N-glycan mapping is performed using equivalent protocols including on-tissue PNGase F release, sialic acid stabilization chemistry, and high-resolution mass spectrometry for glycan composition assignment.
Adapted from Wallace et al. (2024). An N-glycome tissue atlas of 15 human normal and cancer tissue types determined by MALDI-imaging mass spectrometry. Scientific Reports 14:489. (CC BY 4.0)
Representative Results: Spatial Glycan Profiling Data Outputs and Platform Performance
Our spatial glycan and lectin profiling platform delivers integrated data packages combining imaging, spectrometric, and glycoproteomic results for comprehensive tissue-level glycosylation characterization. The representative data below illustrates the typical output quality and performance specifications achieved across the three complementary platforms.
Platform Performance Specifications
| Performance Parameter |
Lectin IMC |
MALDI-MSI N-Glycan |
LCM Glycoproteomics |
| Glycan detection scope |
12+ targeted glycan motifs (lectin-defined) |
30–150+ N-glycan compositions (untargeted) |
Site-specific glycopeptide identification |
| Spatial resolution |
1 μm (single-cell) |
10–50 μm pixel size |
Region-specific (LCM-defined areas) |
| Sample type compatibility |
FFPE and fresh frozen |
FFPE and fresh frozen |
FFPE and fresh frozen |
| Multiplexing capacity |
12+ lectins + antibodies per section |
All detectable glycans per pixel |
100s glycosylation sites per region |
| Glycan class coverage |
N-glycans, O-glycans, terminal epitopes |
N-glycans (primary), O-glycans (secondary) |
N-glycopeptides, O-glycopeptides |
| Sialic acid linkage differentiation |
Yes (SNA α2,6; MAL-I/II α2,3) |
Yes (chemical derivatization) |
Yes (MS/MS fragmentation) |
| Throughput (samples/week) |
5–20 tissue sections |
3–10 tissue sections |
2–5 LCM regions |
| Typical tissue area per analysis |
1–100 mm² |
1–500 mm² |
0.1–50 mm² |
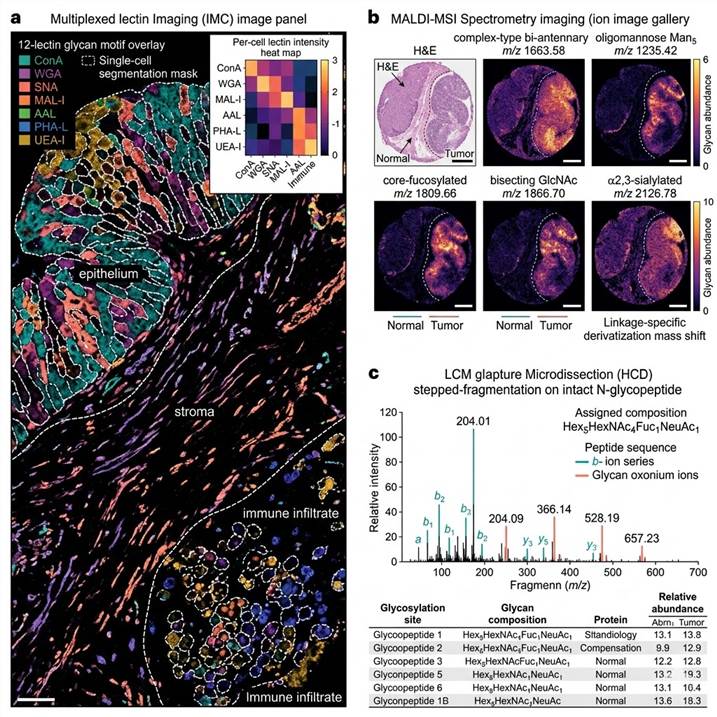
Representative data outputs from our Spatial Glycan and Lectin Profiling platform. Left: Multiplexed lectin IMC glycan motif maps with single-cell segmentation. Center: MALDI-MSI N-glycan ion images across tissue microarray cores. Right: LCM-coupled glycoproteomics MS/MS spectrum and glycopeptide identification results.
Key data deliverables included in every spatial glycan profiling project:
- Lectin IMC data package — Pixel-level and single-cell-level lectin signal intensity maps for all lectins in the panel, cell type classification masks with glycan motif enrichment scores per cell type, spatial neighborhood analysis results identifying glycan-defined tissue microenvironments, and multiplexed overlay images correlating glycan distribution with cell lineage markers and tissue morphology
- MALDI-MSI data package — Ion images for all detected N-glycan and O-glycan compositions with spatial distribution maps overlaid on tissue morphology, glycan composition assignment with accurate mass matching (5 ppm tolerance) to GlycomeDB and GlyTouCan databases, differential abundance maps comparing glycan intensities between user-defined tissue regions (tumor vs. normal, invasive front vs. tumor core, etc.), and spatial co-localization matrices identifying glycans with correlated tissue distributions
- LCM glycoproteomics data package — Complete list of identified glycopeptides with assigned glycan compositions, glycosylation site localization, annotated MS/MS spectra for each identified glycopeptide, and relative quantification of glycopeptides across different captured tissue regions
- Multi-modal integration — Coregistered spatial glycan images overlaid with H&E histology, IHC marker expression, or spatial transcriptomics data from serial sections, enabling direct correlation of glycan distribution with morphological features, protein expression, and gene expression patterns in the same tissue context
- Statistical analysis — Differential glycan abundance analysis between tissue regions and experimental groups, spatial correlation metrics, and cell-type-specific glycan motif enrichment scores with appropriate statistical testing
- Methods documentation — Complete protocols for tissue preparation, lectin staining, MALDI-MSI acquisition, LCM capture, and LC-MS/MS analysis, formatted for publication methods sections and regulatory reference
Related Services
Our spatial glycan and lectin profiling platform is part of a comprehensive PTM and spatial biology service portfolio spanning glycan analysis, spatial PTM mapping, enrichment technologies, and bioinformatics integration for multi-omic spatial research programs.
- Spatial PTM Profiling — Integrated spatial profiling platform covering phosphoproteomic, acetylomic, and histone modification mapping in tissue sections using imaging mass spectrometry and antibody-based spatial detection
- Spatial Histone Modification Profiling — Dedicated spatial mapping of histone post-translational modifications (H3K4me3, H3K27ac, H3K9me3, etc.) in FFPE and fresh frozen tissue sections for epigenomic spatial analysis
- Glycoproteomics Analysis Services — Comprehensive glycoproteomics platform combining lectin enrichment, HILIC, and enzymatic deglycosylation for N-glycopeptide and O-glycopeptide identification and quantification
- Site-Specific Glycosylation Analysis — LC-MS/MS-based identification and quantification of glycosylation sites with assigned glycan compositions for detailed glycoproteomic characterization
- Glycopeptide Enrichment Services — HILIC, lectin affinity, and covalent hydrazide chemistry-based glycopeptide enrichment solutions for MS-based glycoproteomics sample preparation
- Modified Peptide Enrichment Services — Broad-spectrum enrichment solutions including IMAC, TiO₂, HILIC, and antibody-based immunoaffinity approaches for modified peptide isolation prior to MS analysis
FAQs
What is the difference between lectin-based imaging and MALDI-MSI for spatial glycan profiling?
Lectin-based imaging uses glycan-binding proteins with defined carbohydrate specificities to detect specific glycan motifs, providing targeted detection of known glycan structures at high spatial resolution (1 μm with IMC). MALDI-MSI provides untargeted, label-free detection of all ionizable glycans simultaneously (30–150+ glycan compositions), enabling discovery of unexpected glycan structures, but at lower spatial resolution (10–50 μm). The two platforms are complementary: lectin IMC is the method of choice for hypothesis-driven, high-resolution mapping of specific glycan motifs across large tissue cohorts, while MALDI-MSI is preferred for discovery-phase glycan mapping where the goal is to identify novel glycan distributions without prior assumptions.
Can spatial glycan profiling be performed on FFPE tissue sections?
Yes — all three of our platforms (lectin IMC, MALDI-MSI, and LCM glycoproteomics) are fully optimized for FFPE tissue sections. FFPE samples require deparaffinization, rehydration, and heat-induced antigen retrieval before lectin staining or enzymatic glycan release. The fixation and embedding process does not significantly alter N-glycan structures, and extensive validation has demonstrated that MALDI-MSI glycan profiles from FFPE tissue are highly correlated with matched fresh frozen tissue. FFPE compatibility is a key advantage of our platforms, as it enables access to the vast archives of clinically annotated tissue samples in hospital pathology departments and biobanks.
How many glycan structures can be detected in a single MALDI-MSI experiment?
In a typical MALDI-MSI experiment with on-tissue PNGase F N-glycan release, we detect 30–80 N-glycan compositions per tissue type on standard instrumentation, and up to 100–150+ with optimized protocols including sialic acid stabilization chemistry (methylamidation or ethyl esterification) and high-resolution mass spectrometers. Detected glycans span complex, hybrid, and oligomannose types with variable fucosylation, bisecting GlcNAc, and sialylation. O-glycan detection by on-tissue reductive β-elimination yields 15–40 O-glycan compositions depending on tissue type. The number of detectable glycans depends on tissue type, sample preservation quality, and the specific MALDI-MSI protocol employed.
What tissue section thickness and size are required for spatial glycan profiling?
For optimal results, we recommend 5–10 μm thick sections for FFPE tissue and 10–12 μm for fresh frozen tissue. Minimum tissue area is approximately 1 mm² for MALDI-MSI and lectin IMC, though smaller regions can be analyzed with reduced glycan detection coverage. For LCM glycoproteomics, larger capture areas (10–50 mm² cumulative) are typically required to obtain sufficient protein for LC-MS/MS analysis, though recent protocol optimizations have enabled glycoproteomics from as few as 500–1,000 captured cells.
Can spatial glycan data be integrated with spatial transcriptomics or proteomics data?
Yes — multi-modal integration is a core capability of our spatial biology platform. Spatial glycan data from lectin IMC or MALDI-MSI can be coregistered with spatial transcriptomics data (from 10x Visium, Xenium, or NanoString GeoMx DSP platforms) and spatial proteomics data (from IMC, GeoMx DSP, or CODEX platforms) acquired on serial tissue sections from the same tissue block. Image registration algorithms align the different modalities based on tissue morphology, and spatial correlation analysis identifies relationships between glycan distribution and gene or protein expression across tissue regions. This multi-omics spatial integration is particularly powerful for identifying the molecular pathways underlying glycan alterations and for discovering glycan-regulated biological processes.
What are the limitations of current spatial glycan profiling technologies?
Several limitations should be considered: (1) Lectin-based detection is limited to glycan motifs for which specific lectins are available — not all glycan structures have corresponding specific lectins, and lectin cross-reactivity can occur. (2) MALDI-MSI currently detects N-glycans more readily than O-glycans, and O-glycan release from tissue sections remains less efficient than N-glycan release. (3) MALDI-MSI spatial resolution (10–50 μm) is typically above single-cell dimensions, although lectin IMC achieves single-cell resolution (1 μm). (4) Glycan identification by MALDI-MSI is based on accurate mass matching to databases and does not provide unambiguous structural characterization — isomeric glycans with identical masses cannot be distinguished without additional fragmentation or derivatization. (5) Integration of spatial glycan data with other modalities requires careful serial section alignment and computational coregistration that can introduce registration artifacts. We address each of these limitations through optimized protocols, complementary platform use, orthogonal validation, and rigorous quality control.
How are spatial glycan profiling data analyzed and visualized?
Spatial glycan data are processed through a multi-step bioinformatics pipeline. For lectin IMC: raw CyTOF data are processed for pixel intensity normalization, single-cell segmentation (using nuclear and cytoplasmic markers), per-cell lectin signal quantification, cell type classification, and spatial neighborhood analysis. For MALDI-MSI: raw mass spectra are processed for baseline correction, peak picking, glycan composition assignment (accurate mass matching to GlycomeDB, GlyTouCan, and custom databases), ion image reconstruction, and spatial co-localization analysis. For LCM glycoproteomics: LC-MS/MS data are searched using Byonic or pGlyco with glycan database matching. Visualization outputs include multiplexed glycan ion images overlaid on tissue morphology, single-cell glycan heat maps with t-SNE/UMAP clustering, spatial correlation matrices, and multi-modal overlay images with H&E, IHC, or transcriptomic data. All data are delivered in standard formats compatible with common spatial analysis platforms (QuPath, CellProfiler, SCiLS Lab, and custom R/Python visualization scripts).
References
- Wallace EN, West CA, McDowell CT, Lu X, Bruner E, Mehta AS, Aoki-Kinoshita KF, Angel PM, Drake RR. An N-glycome tissue atlas of 15 human normal and cancer tissue types determined by MALDI-imaging mass spectrometry. Scientific Reports. 2024;14:489.
- Grgic A, Krestensen KK, Heeren RMA. Optimized protocol for MALDI MSI of N-glycans using an on-tissue digestion in fresh frozen tissue sections. Scientific Reports. 2023;13:2776.
For research use only. Not for use in diagnostic procedures.