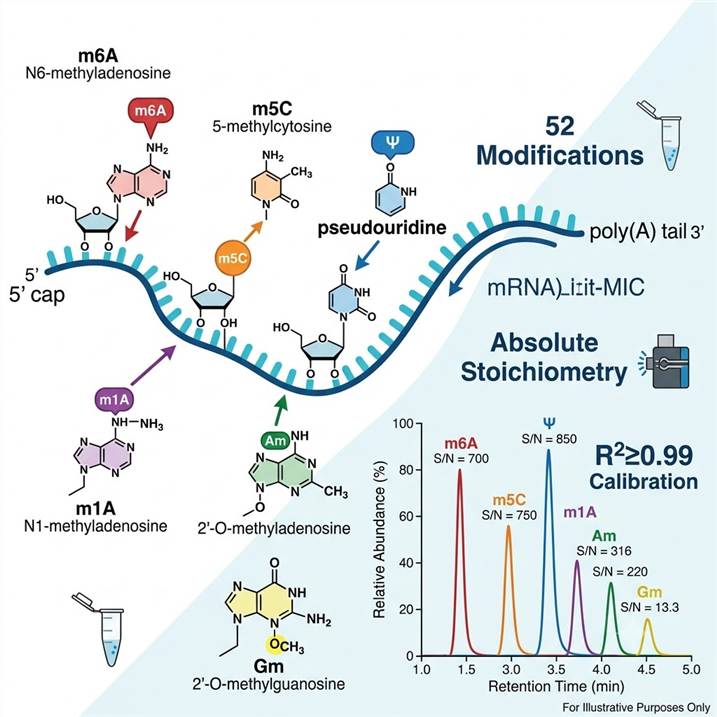
Why mRNA Modification Analysis Matters — From Epitranscriptome Discovery to Functional Insight
The epitranscriptome — the collection of chemical modifications on RNA molecules — constitutes a regulatory layer that operates orthogonally to nucleotide sequence. On mRNA, over 10 chemically distinct modifications have been functionally characterized, and the machinery that writes, erases, and reads these marks rivals the complexity of chromatin regulation.
The writer-eraser-reader framework is the organizing principle. Methyltransferases like METTL3/METTL14 deposit m6A on DRACH consensus motifs in coding sequences and 3′ UTRs; NSUN2 installs m5C on specific tRNAs and mRNAs; pseudouridine synthases isomerize uridine to Ψ at defined positions. Demethylases — FTO and ALKBH5 for m6A — remove these marks, making modification states dynamic and condition-responsive. Reader proteins (YTHDF1-3, YTHDC1-2, IGF2BP1-3) bind modified residues and transduce the chemical signal into functional outcomes: enhanced translation, accelerated decay, nuclear export, or altered secondary structure.
Disease relevance is broad and mechanistically specific. In acute myeloid leukemia, FTO overexpression erases m6A from ASB2 and RARA transcripts, blocking their degradation and driving leukemogenesis — directly making FTO a therapeutic target. In glioblastoma, ALKBH5 demethylates FOXM1 and NANOG mRNAs, maintaining glioma stem cell self-renewal. In hepatocellular carcinoma, METTL3 installs m6A on SOCS2 mRNA, promoting its degradation via YTHDF2 and relieving SOCS2-mediated suppression of STAT3 signaling. In neurodevelopment, FTO mutations cause growth retardation and microcephaly through dysregulated m6A dynamics in neural progenitor cells. These examples illustrate a consistent principle: mRNA modification dysregulation is causal in disease, not merely correlative.
Why LC-MS/MS is irreplaceable for certain questions. Antibody-based enrichment (MeRIP/m6A-seq) measures relative enrichment between IP and input — it tells you where m6A peaks change between conditions but cannot tell you the absolute modification stoichiometry. Nanopore direct RNA sequencing detects modification signatures at single-molecule resolution but requires complex base-calling models and cannot yet quantify all modification types reliably. LC-MS/MS bridges this gap by providing calibrated, modification-specific absolute quantification that is independent of antibody specificity and sequencing model biases. For experiments that ask "does drug treatment change global m6A levels?" or "what is the m6A/A ratio in tumor vs. normal tissue?" — only LC-MS/MS answers directly.
Our LC-MS/MS mRNA Modification Analysis Platform — From RNA Hydrolysis to Quantitative Nucleoside Profiling
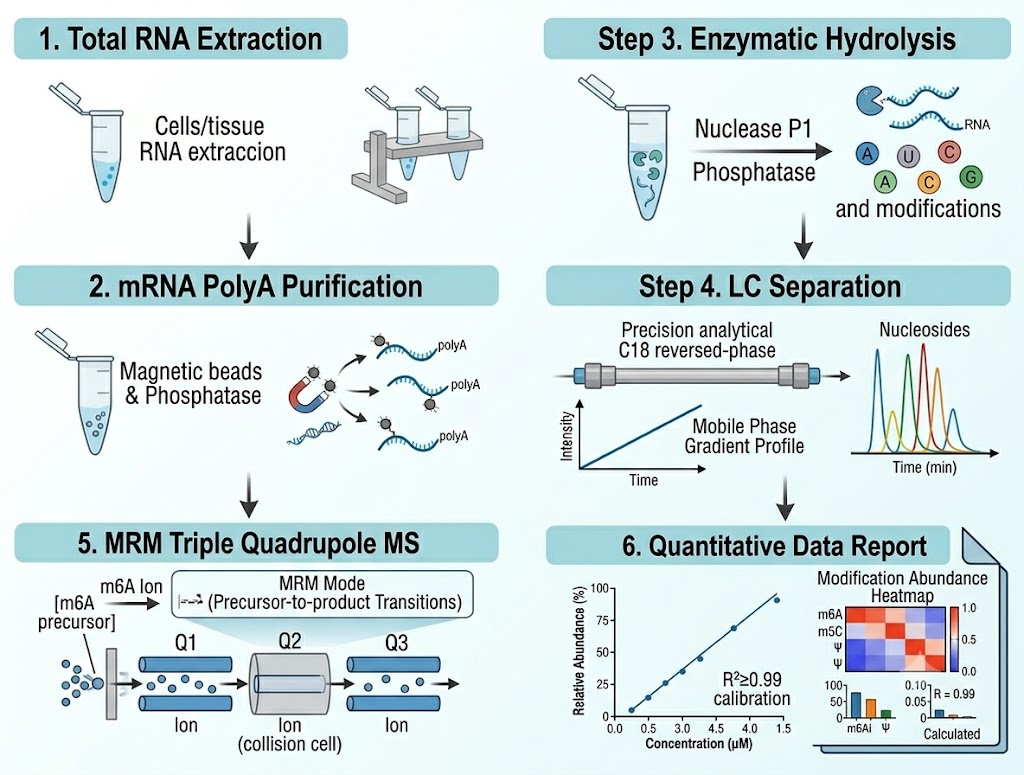
The analytical workflow converts mRNA into a nucleoside mixture where each modified species is separated, identified, and quantified:
Step 1 — Total RNA extraction and QC. Total RNA is extracted from cells or tissue using TRIzol or column-based methods. RNA integrity is assessed by Bioanalyzer or TapeStation (RIN ≥ 7 required), and purity is confirmed by spectrophotometry (A260/A280 1.8–2.1, A260/A230 ≥ 1.8). DNase treatment removes genomic DNA contamination that would inflate nucleoside signals.
Step 2 — mRNA purification. Polyadenylated mRNA is enriched from total RNA using oligo-dT magnetic beads. This step is critical for modification analysis focused on protein-coding transcripts: ribosomal RNA (which constitutes ~80% of total RNA) carries its own set of modifications that would dominate the MS signal if not removed. For projects targeting non-polyadenylated RNA species, alternative purification strategies (rRNA depletion, size selection) are available.
Step 3 — Enzymatic hydrolysis to single nucleosides. Purified mRNA is digested to single nucleosides using a two-step enzymatic protocol: nuclease P1 cleaves phosphodiester bonds to yield 5′-monophosphates, followed by alkaline phosphatase treatment to remove phosphate groups, producing free nucleosides. This enzymatic approach preserves acid-labile modifications — including m1A (which undergoes Dimroth rearrangement to m6A under alkaline conditions), wybutosine, and queuosine derivatives — that would be degraded or isomerized by acid hydrolysis. Each digestion batch includes a synthetic RNA oligonucleotide with known modification stoichiometry as a hydrolysis efficiency control.
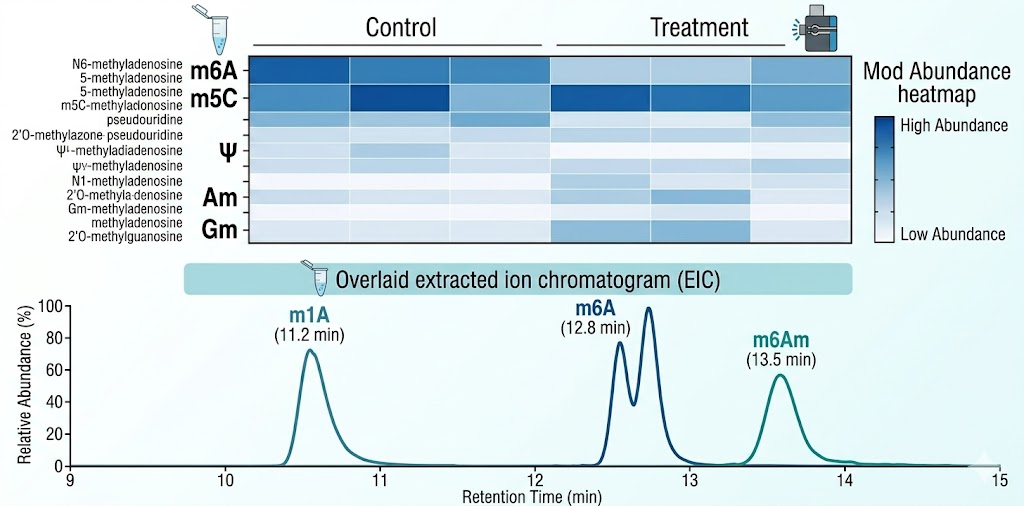
Step 4 — LC separation. Nucleosides are separated on a reversed-phase C18 column (2.1 × 150 mm, 1.8 μm particles) using a water/methanol gradient with 0.1% formic acid as ion-pairing modifier. The gradient is optimized to achieve baseline resolution of isobaric and isomeric modifications — m6A (retention time ~12.8 min), m6Am (~13.5 min), and m1A (~11.2 min) are fully resolved, as are m5C and m3C, and the four 2′-O-methylated nucleosides (Am, Cm, Gm, Um).
Step 5 — Triple quadrupole MS detection in MRM mode. Detection is performed on an Agilent 6470 triple quadrupole mass spectrometer operated in positive electrospray ionization (ESI+) mode with dynamic multiple reaction monitoring (dMRM). For each nucleoside, two MRM transitions are monitored: a quantifier transition (for peak area integration) and a qualifier transition (for identity confirmation). The parent ion undergoes collision-induced dissociation (CID), and the characteristic fragment ion (typically the protonated nucleobase [BH2]+) is detected. Stable isotope-labeled nucleoside internal standards (13C/15N-labeled adenosine, cytidine, guanosine, and uridine) are spiked into each sample before LC-MS/MS to correct for matrix effects, ionization efficiency variation, and injection volume variability.
Step 6 — Quantification and data processing. Calibration curves are constructed for each modification using authentic nucleoside standards at 5–7 concentration levels spanning the expected biological range, with all curves meeting R2 ≥ 0.99. Modification abundance is calculated as the ratio of modified nucleoside to its parent unmodified nucleoside (e.g., m6A/A × 100, expressed as percentage), normalized to the internal standard response. Data processing is performed using Agilent MassHunter Quantitative Analysis software with manual review of each integrated peak.
Quantitative Accuracy, QC Metrics & Reproducibility — Data You Can Defend in Peer Review
Quantitative rigor is the defining feature of our mRNA modification analysis platform. We report QC metrics that no competitor discloses, because they are the same metrics your reviewers will ask for:
Calibration linearity. Every modification in the 52-nucleoside panel is quantified against its own 5–7-point calibration curve. The coefficient of determination (R2) for all calibration curves is ≥ 0.99. Curves that fall below this threshold trigger re-analysis.
Limit of detection (LOD) and limit of quantification (LOQ). LOD is defined as the concentration producing a signal-to-noise ratio of 3:1; LOQ is defined as S/N 10:1 with precision (CV) ≤ 20%. Typical LOD values range from 0.05 to 0.5 fmol on-column depending on the modification's ionization efficiency. These values are reported for each project.
Chromatographic isomer resolution. The resolution (Rs) between isomeric pairs is systematically verified: m6A/m6Am (Rs ≥ 1.5), m6A/m1A (Rs ≥ 2.0), m5C/m3C (Rs ≥ 1.5), Am/Cm/Gm/Um (all pairwise Rs ≥ 1.2). Baseline resolution is the standard; shouldered peaks trigger method re-optimization.
Intra-day and inter-day precision. Pooled QC samples are injected every 8–10 samples throughout each analytical batch. Intra-day precision: CV < 10% for modifications with abundance > 0.01% of parent nucleoside. Inter-day precision: CV < 15% measured across three independent analytical batches. These CV values are calculated from internal standard-normalized responses.
Biological replicate correlation. For multi-sample projects, the Pearson correlation coefficient (R2) between biological replicates is calculated and reported. Typical R2 values between biological replicates are 0.90–0.98 for abundant modifications (m6A, m5C, Ψ) and 0.80–0.90 for low-abundance modifications.
Internal standard strategy. Each sample receives a cocktail of four stable isotope-labeled nucleoside internal standards (13C5-adenosine, 13C9-cytidine, 13C10-guanosine, 13C9-uridine) at known concentrations. The internal standard-normalized response corrects for ionization suppression or enhancement caused by co-eluting matrix components, injection volume variation, and minor retention time drift. The internal standard peak area RSD across an analytical batch is maintained below 10%.
System suitability. Before each analytical batch, a system suitability test mixture containing five representative nucleoside modifications at known concentrations is injected and must pass predefined acceptance criteria for retention time stability (RT shift < 0.1 min), peak area precision (RSD < 5%, n = 6 injections), and resolution between critical pairs.
Types of Analysis — 52 Nucleoside Modifications Quantified by LC-MS/MS
Our standard panel covers 52 nucleoside modifications spanning methylation, pseudouridylation, acetylation, thiolation, isomerization, and hypermodification. This breadth enables comprehensive epitranscriptome profiling from a single mRNA sample in one analytical run. All modifications are quantified simultaneously and reported as absolute abundance (modification/parent nucleoside ratio).
| No. |
Nucleoside |
Symbol |
No. |
Nucleoside |
Symbol |
| 1 |
3′-O-methyladenosine |
3′-OMeA |
27 |
3'-O-methyluridine |
3'-OMeU |
| 2 |
2′-O-methylcytidine |
Cm |
28 |
5-methyl-2-thiouridine |
m5s2U |
| 3 |
3-methylcytidine |
m3C |
29 |
5-methoxyuridine |
mo5U |
| 4 |
5-methylcytidine |
m5C |
30 |
pseudouridine |
Ψ |
| 5 |
N6-isopentenyladenosine |
i6A |
31 |
2'-O-methylinosine |
Im |
| 6 |
5,2'-O-dimethylcytidine |
m5Cm |
32 |
3-methyluridine |
m3U |
| 7 |
1-methyladenosine |
m1A |
33 |
1-methylpseudouridine |
m1Ψ |
| 8 |
2-thiocytidine |
s2C |
34 |
5-hydroxymethylcytidine |
hm5C |
| 9 |
N2,N2,7-trimethylguanosine |
m2,2,7G |
35 |
5,2'-O-dimethyluridine |
m5Um |
| 10 |
N4-acetyl-2′-O-methylcytidine |
ac4Cm |
36 |
N6-threonylcarbamoyladenosine |
t6A |
| 11 |
N6-methyladenosine |
m6A |
37 |
2-methylthio-N6-threonylcarbamoyladenosine |
ms2t6A |
| 12 |
3′-O-methylcytidine |
3′-OMeC |
38 |
5-carboxymethyluridine |
cm5U |
| 13 |
2′-O-methyladenosine |
Am |
39 |
5-methoxycarbonylmethyl-2-thiouridine |
mcm5s2U |
| 14 |
N2,N2-dimethylguanosine |
m22G |
40 |
5-Methoxycarbonylmethyluridine |
mcm5U |
| 15 |
5′-O-methylthymidine |
5′-OMeT |
41 |
2-methylthio-N6-isopentenyladenosine |
ms2i6A |
| 16 |
2′-O-methyluridine |
Um |
42 |
Peroxywybutosine |
o2yW |
| 17 |
inosine |
I |
43 |
5-taurinomethyl-2-thiouridine |
τm5s2U |
| 18 |
2′-O-methylguanosine |
Gm |
44 |
5-oxyacetic acid uridine |
cmo5U |
| 19 |
1-methylguanosine |
m1G |
45 |
5-carbamoylmethyuridine |
ncm5U |
| 20 |
7-methylguanosine |
m7G |
46 |
Queuosine |
Q |
| 21 |
N2-methylguanosine |
m2G |
47 |
5-taurinomethyluridine |
τm5U |
| 22 |
3'-O-methylinosine |
3'-OMeI |
48 |
5-formyl-2′-O-methylcytidine |
f5Cm |
| 23 |
2-thiouridine |
s2U |
49 |
dihydrouridine |
D |
| 24 |
4-thiouridine |
s4U |
50 |
5-formylcytidine |
f5C |
| 25 |
5-methyluridine |
m5U |
51 |
wybutosine |
yW |
| 26 |
N4-acetylcytidine |
ac4C |
52 |
5-methoxycarbonylmethyl-2'-o-methyluridine |
mcm5Um |
Beyond the standard 52-modification panel, custom modifications can be added upon request. Contact our technical team with the specific modifications you need quantified, and we will develop and validate MRM transitions for your targets.
Applications in RNA Biology & Disease Research — From Mechanistic Studies to Biomarker Discovery
mRNA modification quantification by LC-MS/MS informs research across multiple disease areas, each with distinct analytical requirements:
Cancer biology. The m6A machinery is among the most frequently dysregulated epitranscriptomic pathways in cancer. METTL3 overexpression in acute myeloid leukemia, gastric cancer, and hepatocellular carcinoma drives oncogenic mRNA stabilization; FTO overexpression in AML and glioblastoma erases tumor-suppressive m6A marks; ALKBH5 maintains glioma stem cell self-renewal through FOXM1 mRNA demethylation. LC-MS/MS quantification of global m6A/A ratios and broader modification panels allows researchers to correlate writer/eraser expression changes with functional modification output — connecting genotype to epitranscriptomic phenotype in a way that sequencing alone cannot.
Neurological disorders. FTO and METTL3 mutations cause neurodevelopmental syndromes with intellectual disability and microcephaly. In Alzheimer's disease, m6A levels are altered on transcripts encoding APP, BACE1, and tau — and global m6A/A ratios in postmortem brain tissue correlate with Braak stage. In Parkinson's disease, m6A modification of SNCA (α-synuclein) mRNA affects its translation. LC-MS/MS provides the quantitative foundation for these observations by delivering absolute m6A/A values that can be compared across studies, brain regions, and disease stages.
Viral infection and host response. RNA viruses — including SARS-CoV-2, HIV-1, HCV, and influenza — carry m6A, m5C, Ψ, and other modifications on their genomic RNA, deposited by host modification machinery. These marks affect viral replication, immune evasion, and interferon response. LC-MS/MS quantification of viral RNA modifications, combined with host mRNA modification profiling, reveals how infection remodels the host epitranscriptome and identifies modification-dependent vulnerabilities for antiviral targeting.
Development and differentiation. Embryonic stem cell pluripotency and lineage commitment are controlled in part by m6A dynamics. METTL3 knockout is embryonic lethal in mice; METTL14 deletion blocks naïve pluripotency exit. LC-MS/MS quantification tracks global modification changes during differentiation time courses, generating quantitative time-series data that — when integrated with RNA-seq and ribosome profiling — constructs a multi-layered model of post-transcriptional regulation during development.
mRNA therapeutics QC. In vitro transcribed (IVT) mRNA — used in mRNA vaccines and therapeutic mRNA — can incorporate modified nucleosides (N1-methylpseudouridine, 5-methoxyuridine) to reduce immunogenicity and enhance translation. LC-MS/MS quantification verifies that the intended modification has been incorporated at the expected stoichiometry and that no unintended byproduct modifications are present. For GMP and GLP applications, our platform provides the quantitative QC data required for regulatory documentation.
Bioinformatics & Data Deliverables — Publication-Ready Results Beyond Raw Quantification
Every project delivers a complete data package designed to accelerate manuscript preparation:
Raw data. Agilent .d files (MassHunter format), .mzXML converted files for third-party software compatibility, and PDF reports of all MRM chromatograms with peak integration annotations for each modification in each sample.
Quantification table. An Excel workbook containing: modification name, symbol, retention time, MRM quantifier transition (precursor → product m/z), peak area (raw and internal standard-normalized), calculated concentration (fmol/μg RNA), modification/parent nucleoside ratio (%), and CV across analytical replicates. For multi-condition projects, the table includes fold change, p-value, and adjusted p-value for each modification between comparison groups.
Data visualization. A modification abundance heatmap displaying all 52 modifications across all samples with hierarchical clustering. Bar charts comparing key modifications (m6A/A, m5C/C, Ψ/U, Am/A ratios) between experimental groups. Principal component analysis (PCA) scores plot showing global modification profile separation. Volcano plot for differential modification analysis with log2 fold change on the x-axis and −log10 p-value on the y-axis, with significance thresholds annotated. These figures are delivered in publication-quality formats (vector PDF, 300 dpi PNG).
Pathway and functional enrichment. KEGG pathway enrichment analysis for the genes encoding modification writers, erasers, and readers associated with differentially modified nucleosides. Gene Ontology (GO) enrichment for molecular function, biological process, and cellular component terms. These analyses connect modification-level changes to biological pathways, providing interpretive context beyond the raw quantification data.
Publication support. A ready-to-use Methods section describing the full analytical workflow in manuscript-ready language. Figure legends for all delivered visualizations. Guidance for raw data deposition in public repositories (Metabolomics Workbench under study type "MS", MetaboLights). We also provide the internal standard preparation protocol and instrument parameters for inclusion in supplementary materials.
Sample Requirements — How to Prepare and Ship Your RNA for Optimal Results
Sample quality determines data quality. The following guidelines ensure your samples arrive in condition for reliable quantification:
Sample types and amounts:
| Sample Type |
Minimum Amount |
Recommended Amount |
| Cultured cells |
1 × 10⁶ cells |
5 × 10⁶ cells |
| Fresh frozen tissue |
10 mg |
30–50 mg |
| Total RNA (extracted) |
5 μg |
10–20 μg |
| Pre-purified mRNA (polyA-enriched) |
500 ng |
1–2 μg |
RNA quality requirements. Total RNA: concentration ≥ 50 ng/μL, A260/A280 ratio 1.8–2.1, A260/A230 ratio ≥ 1.8, RNA Integrity Number (RIN) ≥ 7.0. Pre-purified mRNA: provide Bioanalyzer/TapeStation electropherogram showing successful polyA enrichment (depleted 18S/28S rRNA peaks).
Biological replicates. Minimum three biological replicates per experimental condition for statistical comparison. For time-course or dose-response experiments, triplicates at each time point or dose are recommended.
Sample preparation recommendations. Extract RNA using TRIzol or silica membrane-based column kits. Include a DNase I treatment step to remove genomic DNA. Resuspend RNA in nuclease-free water, not TE buffer (EDTA can interfere with enzymatic hydrolysis). Avoid repeated freeze-thaw cycles — aliquot RNA into single-use volumes.
Storage and shipping. Store RNA at −80°C. Ship on dry ice in RNase-free tubes with sufficient dry ice to last 48–72 hours. Include a printed sample manifest listing: sample ID, condition/group, RNA concentration, A260/A280, RIN (if available), and any sample-specific notes. Notify us of the shipment tracking number for arrival monitoring.
For cell and tissue samples requiring RNA extraction. Flash-freeze cell pellets or tissue in liquid nitrogen immediately after collection and store at −80°C. Ship on dry ice. We offer RNA extraction as an optional add-on service; please specify during project consultation.
For detailed sample preparation protocols, refer to our sample submission guide or contact our technical team before shipment.
Frequently Asked Questions About mRNA Modification LC-MS Analysis
Q: Why should I use LC-MS/MS instead of MeRIP-seq or nanopore direct RNA sequencing?
A: They answer different questions. MeRIP-seq identifies genomic regions enriched for m6A relative to input — it tells you where modifications are, but relative enrichment depends on antibody affinity and IP efficiency, not absolute abundance. Nanopore sequencing detects modification signatures at single-read resolution but requires complex training data and does not yet quantify all modification types. LC-MS/MS provides calibrated, absolute quantification of 52 modifications simultaneously — the m6A/A ratio, the m5C/C ratio, the Ψ/U ratio — as concrete percentages. For experiments asking "does condition X change global modification levels?" LC-MS/MS gives the direct answer. We recommend LC-MS/MS as the quantitative foundation, complemented by sequencing for site-specific information.
Q: How many modifications can you detect and quantify?
A: Our standard panel covers 52 nucleoside modifications (see the Types of Analysis table above). All 52 are quantified from a single mRNA sample in one analytical run. The complete list includes methylation variants (m6A, m5C, m1A, m7G, m3C, m2G, m22G, m2,2,7G), 2′-O-methylated nucleosides (Am, Cm, Gm, Um, Im), pseudouridine and derivatives, thiolated nucleosides, acetylated nucleosides (ac4C, ac4Cm), hypermodified nucleosides (t6A, ms2t6A, yW, Q), and others. If you need a modification not on the standard list, contact us — we can develop and validate custom MRM methods for additional targets.
Q: Can LC-MS/MS distinguish isomeric modifications like m6A, m6Am, and m1A?
A: Yes. These three methylated adenosine isomers have identical molecular masses (281.1 Da for the protonated nucleoside) and cannot be distinguished by mass alone. Our chromatographic method achieves baseline resolution: m1A elutes first (~11.2 min), followed by m6A (~12.8 min) and m6Am (~13.5 min). Each isomer is identified by its unique retention time and confirmed by its characteristic MRM transition, and each is quantified against its own authentic standard calibration curve. Co-elution of any of these isomers triggers method re-optimization and sample re-analysis. This is a fundamental requirement for accurate epitranscriptome quantification, and we verify resolution in every analytical batch.
Q: How much RNA do I need, and can I use total RNA instead of purified mRNA?
A: For purified mRNA (polyA-enriched), we need a minimum of 500 ng, with 1–2 μg recommended. For total RNA, the minimum is 5 μg — from this, we perform mRNA enrichment in-house. We recommend mRNA purification because ribosomal RNA (~80% of total RNA) carries its own modification repertoire (pseudouridine, 2′-O-methylation, base methylations) that would dominate the nucleoside pool and obscure mRNA-specific modification signals. If your research question concerns total RNA modification profiles rather than mRNA specifically, we can process total RNA directly — just specify this during project consultation.
Q: What is the typical turnaround time?
A: Standard projects: 3–4 weeks from sample receipt to final data delivery. Projects with custom modifications requiring method development: 5–6 weeks. Large cohort studies (>20 samples): 5–7 weeks. Expedited processing is available for an additional fee — contact us before shipment to arrange.
Q: How do you ensure quantitative accuracy?
A: Multiple layers of QC: (1) 5–7-point calibration curves for each of the 52 modifications, all with R2 ≥ 0.99; (2) stable isotope-labeled internal standards (13C/15N-labeled A, C, G, U) spiked into every sample to correct for matrix effects and injection variability; (3) pooled QC samples injected every 8–10 samples to monitor intra-batch stability (CV < 10%); (4) system suitability tests before every batch; (5) two MRM transitions per modification — one for quantification, one for identity confirmation. All QC metrics are included in the final report.
Related Services
References
- Yang Y, Lu Y, Wang Y, et al. Current progress in strategies to profile transcriptomic m6A modifications. Frontiers in Cell and Developmental Biology. 2024;12:1392159. doi:10.3389/fcell.2024.1392159
- Hengesbach M, Chan C, Helm M, et al. Toward standardized epitranscriptome analytics: an inter-laboratory comparison of workflows for LC–MS/MS RNA modification analysis. Nucleic Acids Research. 2025;53(17):gkaf895. doi:10.1093/nar/gkaf895
- Boccaletto P, Stefaniak F, Ray A, et al. MODOMICS: a database of RNA modification pathways. 2021 update. Nucleic Acids Research. 2022;50(D1):D231-D235. doi:10.1093/nar/gkab1083
- Thüring K, Schmid K, Keller P, Helm M. LC-MS analysis of methylated RNA. Methods in Molecular Biology. 2017;1562:3-18.
*This service is provided for research use only (RUO). It is not intended for clinical diagnostic or therapeutic applications.