PTM Characterization: A Critical Gate in Biopharmaceutical Development
Protein biopharmaceuticals — monoclonal antibodies, antibody-drug conjugates (ADCs), fusion proteins, and recombinant therapeutic proteins — are inherently heterogeneous products whose structural attributes are shaped by a complex interplay of biosynthetic, post-translational, and post-production modification events. Unlike small-molecule drugs with defined chemical structures, each biopharmaceutical is a population of closely related variants (proteoforms) differing in glycosylation patterns, terminal modifications, oxidation states, deamidation levels, and other PTMs that collectively define the product's safety, efficacy, and stability profile. The industry framework for managing this complexity — the Quality by Design (QbD) concept embodied in ICH Q8–Q11 guidelines — identifies PTM attributes as critical quality attributes (CQAs) requiring rigorous characterization throughout development. Our biopharma PTM characterization services provide the LC-MS/MS-based analytical depth needed to define, monitor, and compare these PTM CQAs across every stage of biopharmaceutical R&D — from early discovery through preclinical development, process optimization, and biosimilar comparability studies — exclusively within RUO non-GMP workflows designed for research and development applications.
Biopharma PTM Characterization Service Portfolio
Our service portfolio covers the full spectrum of PTM characterization needs for protein biopharmaceuticals, organized by product modality and analytical objective. Each sub-service is available independently or as part of an integrated characterization package.
| Service Area |
Description |
Key Applications |
| Antibody Glycosylation Analysis |
Site-specific N-glycan profiling and quantitation for monoclonal antibodies and Fc-fusion proteins by LC-MS/MS, including released glycan and glycopeptide-level analysis |
mAb candidate screening, glycoengineering optimization, biosimilar glycan comparability |
| Protein Drug Glycosylation Analysis |
Comprehensive glycosylation characterization for non-antibody therapeutic proteins, including N-glycan, O-glycan, and intact glycoprotein mass analysis |
Recombinant protein glycosylation profiling, bioprocess glycosylation monitoring, formulation development |
| ADC / Fusion Protein PTM Analysis |
DAR determination, payload distribution profiling, conjugation site mapping, and PTM characterization for ADCs and fusion proteins by intact MS and subunit analysis |
ADC DAR optimization, payload conjugation site confirmation, fusion protein PTM mapping |
| Protein PEGylation Analysis |
PEG attachment site identification, PEG chain distribution, molecular weight confirmation, and free PEG quantification by MALDI-TOF MS and LC-MS |
PEGylated therapeutic characterization, site-specific PEGylation confirmation, batch-to-batch PEG consistency |
| Protein Drug PTM Mapping |
High-resolution LC-MS/MS peptide mapping for comprehensive PTM identification including deamidation, oxidation, isomerization, glycation, and sequence variant analysis |
Forced degradation studies, comparability assessment, stability-indicating method development |
| Bacterial Glycosylation Analysis |
Characterization of recombinant glycoproteins expressed in E. coli and other bacterial systems, including N-glycan and O-glycan profiling via LC-MS/MS |
Bacterial expression system glycoprotein engineering, non-human glycan monitoring |
| Insect Cell Glycosylation Analysis |
N-glycan and O-glycan profiling of recombinant proteins expressed in insect cell systems (Sf9, High Five), including paucimannosidic and core-fucosylated glycan analysis |
Baculovirus expression vector system (BEVS) product characterization, glycosylation pattern comparison across insect cell lines |
| Yeast Glycosylation Analysis |
Characterization of high-mannose and hybrid-type glycosylation on recombinant proteins expressed in P. pastoris and S. cerevisiae systems |
Yeast-based therapeutic production, glycoengineering verification, product consistency monitoring |
For studies requiring targeted PTM enzyme activity assessment beyond direct protein characterization, our PTM Enzyme Activity and Inhibitor Screening service provides complementary assays for glycosyltransferases, glycosidases, and other PTM-modifying enzymes relevant to biopharmaceutical development.
Multi-Level LC-MS/MS Platform for Biopharma PTM Characterization
Our biopharma PTM characterization platform deploys a multi-level mass spectrometry strategy — intact mass analysis, subunit (middle-up/middle-down) analysis, and peptide-level (bottom-up) mapping — each providing complementary information across the PTM landscape. The appropriate analytical depth is selected based on the specific PTM attributes under investigation, the complexity of the product molecule, and the development stage requirements.
Intact Mass Analysis
Intact protein mass analysis by high-resolution MS (Orbitrap or Q-TOF) provides a global view of product heterogeneity, revealing the distribution of intact glycoforms, the extent of C-terminal lysine processing, N-terminal pyroglutamate formation, and overall mass profile consistency. For ADCs, intact MS under native conditions delivers drug-to-antibody ratio (DAR) and payload distribution directly from the mass spectrum, enabling rapid assessment of conjugation consistency across batches.
Subunit Analysis (Middle-Up/Middle-Down)
Limited enzymatic digestion (IdeS/IdeZ for mAbs, or alternative proteases for non-antibody proteins) followed by LC-MS analysis of the resulting subunits provides domain-specific PTM information at intermediate resolution. For monoclonal antibodies, subunit-level analysis resolves glycosylation profiles for each Fab and Fc domain independently, detects hinge region modifications, and localizes oxidation and deamidation to specific antibody regions — delivering more detailed information than intact analysis while maintaining higher throughput than full peptide mapping.
Peptide-Level PTM Mapping (Bottom-Up)
Tryptic or multi-protease digestion followed by high-resolution LC-MS/MS peptide mapping provides amino acid-level PTM identification and quantification. Our peptide mapping workflow incorporates: optimized digestion protocols for maximum sequence coverage (>95% for standard mAbs); HCD and EThcD fragmentation for unambiguous PTM site localization; label-free or TMT-based quantification for PTM occupancy determination; and targeted LC-MS/MS verification with isotope-labeled internal standards for critical PTM attributes. This approach is the gold standard for comprehensive PTM characterization in biopharma development, supporting forced degradation studies, biosimilar comparability, and formulation development.
Released Glycan Analysis
For in-depth glycosylation characterization, N-glycans are enzymatically released (PNGase F), labeled with a fluorescent tag (2-AB, procainamide, or Rapifluor), and analyzed by HILIC-UPLC-FLR-MS for structural elucidation and quantitation. O-glycans are released by reductive beta-elimination and analyzed by LC-MS/MS with porous graphitic carbon chromatography. This integrated glycan analysis workflow provides detailed structural information including linkage isomers, sialylation patterns, and fucosylation occupancy that complement glycopeptide-level data.
Our Antibody Glycosylation Analysis service provides dedicated multi-level glycosylation characterization specifically optimized for monoclonal antibody and Fc-fusion protein programs.
Biopharma PTM Characterization Workflow: From Sample to CQA Report
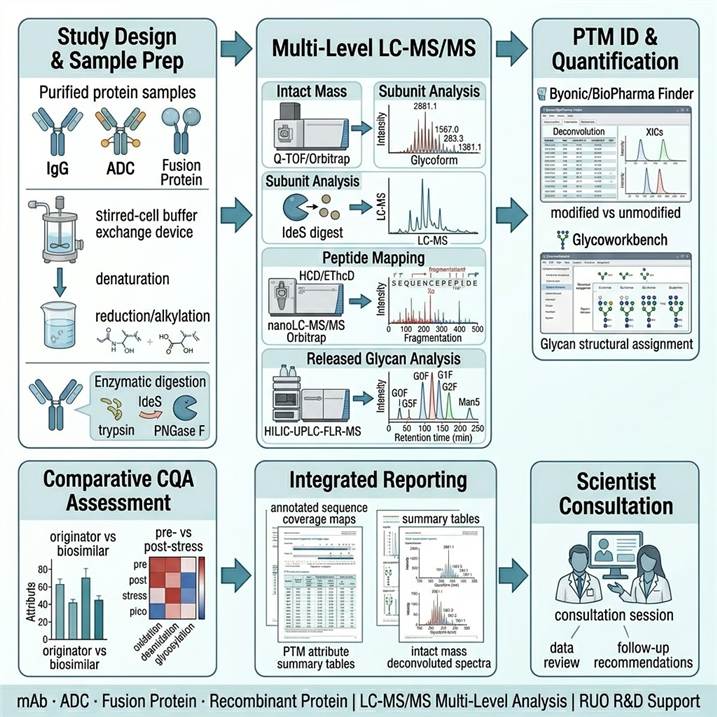
Step 1: Study Design and Sample Preparation
Define PTM attribute target list (glycosylation, deamidation, oxidation, DAR, etc.) based on product modality and development stage. Protein quantification (A280, BCA), buffer exchange, and denaturation/reduction/alkylation as required. Enzymatic digestion (trypsin, IdeS, PNGase F) selected by analytical objective.
Step 2: Multi-Level LC-MS/MS Acquisition
Intact mass analysis on Q-TOF or Orbitrap (native or denaturing conditions). Subunit analysis by LC-MS after limited proteolysis. Peptide mapping by nanoLC-MS/MS (Orbitrap Eclipse, 120K resolution) with HCD/EThcD fragmentation. Released glycan analysis by HILIC-UPLC-FLR-MS. Targeted MRM for CQA quantification.
Step 3: PTM Identification and Quantification
Peptide mapping data processed by Byonic, Protein Metrics, or BioPharma Finder for PTM identification. Intact mass deconvolution by MaxEnt or BioConfirm. Glycan identification by Glycoworkbench or Byonic glycan module. PTM site occupancy calculated from extracted ion chromatograms of modified vs unmodified peptides.
Step 4: Comparative Analysis and CQA Assessment
Side-by-side PTM attribute comparison for biosimilar vs originator, pre- vs post-stress, or across process conditions. Statistical assessment of PTM level differences (fold-change, t-test, PCA). Attribute criticality categorization based on PTM location (CDR vs framework), occupancy level, and potential impact on bioactivity or stability.
Step 5: Integrated Reporting and Data Package
Comprehensive PTM characterization report including annotated peptide coverage maps, site-specific PTM tables with occupancy percentages, glycan profiles with structural assignments, DAR distribution histograms for ADCs, intact mass deconvoluted spectra, comparative PTM attribute heatmaps, and raw data files with processing parameters for regulatory documentation support.
Step 6: Scientist Consultation and Follow-Up
Results interpretation session with senior scientists to discuss PTM findings in the context of product development strategy. Recommendations for additional characterization or targeted monitoring. Optional expansion to extended PTM panels (disulfide bond analysis, host cell protein profiling) as needed for comprehensive product understanding.
PTM Characterization Across Biopharmaceutical Modalities
Our biopharma PTM characterization services are configured to address the distinct analytical requirements of each protein therapeutic modality, from glycan-centric characterization of monoclonal antibodies to multi-PTM mapping of fusion proteins and drug-to-antibody ratio determination for ADCs.
Monoclonal Antibodies and Fc-Fusion Proteins
For IgG-based therapeutics, PTM characterization focuses on glycosylation (Fc N-glycan occupancy and heterogeneity, Fab glycosylation), charge variants (C-terminal lysine processing, N-terminal pyroglutamate, deamidation), size variants (aggregation, fragmentation), and oxidation hotspots (Methionine 252/428 in Fc, tryptophan oxidation in CDRs). Our routine mAb characterization workflow delivers site-specific glycosylation profiles with relative quantitation of >30 glycan species, deamidation and oxidation occupancy by peptide mapping, and subunit-level mass confirmation — all from a single integrated analytical run. For detailed glycosylation analysis, our Protein Drug Glycosylation Analysis service provides extended glycan structural characterization including linkage analysis and sialylation profiling.
Antibody-Drug Conjugates
ADC characterization presents unique analytical challenges beyond standard PTM profiling, requiring simultaneous assessment of conjugation parameters alongside traditional PTM attributes. Our ADC PTM analysis platform delivers: drug-to-antibody ratio (DAR) and payload distribution by native MS and HIC; conjugation site identification and occupancy by peptide mapping with HCD/EThcD; payload-related PTM detection (e.g., linker hydrolysis, payload deacetylation); and integrated PTM + DAR correlation to understand how glycosylation and other modifications vary across DAR species. Our ADC / Fusion Protein PTM Analysis service provides dedicated workflows optimized for each ADC format (conjugated, conjugated-enriched, and unconjugated species).
Recombinant Proteins and Fusion Therapeutics
Non-antibody recombinant proteins — including cytokines, enzymes, hormones, and fusion proteins (Fc-fusion, albumin-fusion, PEGylated) — require customized PTM characterization strategies that account for their unique structural features. Our approach includes: intact mass analysis for confirmation of molecular weight and overall modification state; peptide mapping for comprehensive PTM identification across the specific sequence; PEGylation characterization (attachment site identification and chain distribution) for PEGylated products; and host cell glycosylation profiling for expression system-specific glycan assessment. Our Protein PEGylation Analysis service provides dedicated analytical workflows for PEG attachment site determination and PEG chain distribution profiling across all common PEGylation chemistries.
Host Cell Glycosylation Engineering
The glycosylation capabilities of the expression host — CHO, insect, yeast, or bacterial cells — directly impact the safety and efficacy of the therapeutic product. We provide comparative glycosylation profiling across expression systems to guide host cell line selection and glycoengineering strategies: CHO cell glycosylation (human-compatible complex glycans with core fucose); insect cell glycosylation (paucimannosidic and core-fucosylated glycans); yeast glycosylation (high-mannose glycans with potential immunogenicity); and bacterial glycosylation (non-human glycan structures for research applications). Our dedicated sub-services — Bacterial Glycosylation Analysis, Insect Cell Glycosylation Analysis, and Yeast Glycosylation Analysis — provide expression system-specific analytical expertise for host cell glycosylation engineering programs.
Case Study: LC-MS/MS Identification of 5R-Hydroxylysine as a Novel PTM on Therapeutic Bispecific Monoclonal Antibodies
A 2024 study by Bauer et al. published in Frontiers in Bioengineering and Biotechnology applied high-resolution LC-MS/MS peptide mapping to identify and characterize an unexpected post-translational modification — 5R-hydroxylysine (Hyl) — on therapeutic T-cell bispecific monoclonal antibodies (TCB mAbs) produced in Chinese hamster ovary (CHO) cells. This work demonstrates the power of comprehensive LC-MS-based PTM characterization for detecting and mitigating product-related variants during biopharmaceutical development.
Background: During routine LC-MS peptide mapping of TCB mAbs produced in CHO cells, an unexplained +15.9950 Da mass shift was consistently observed on specific tryptic peptides. The modification was localized to lysine residues at defined positions within the antibody sequence, suggesting a previously unreported PTM on therapeutic antibodies with potential implications for product quality and consistency.
Approach: The team employed a multi-step LC-MS strategy combining: high-resolution Orbitrap-based peptide mapping with HCD fragmentation for accurate mass measurement and PTM localization; database searching with unrestricted mass shifts to identify the +16 Da modification as hydroxylation; targeted LC-MS/MS with isotopically labeled peptides for modification site confirmation in CH1, CH3, and Fab domains; and CRISPR/Cas9-mediated gene knockout of all three procollagen-lysine 2-oxoglutarate 5-dioxygenase (PLOD1/2/3) isoenzymes to identify the enzyme system responsible for the modification.
Key Findings:
- 5R-hydroxylysine was identified as a consistent PTM on TCB mAbs produced in CHO cells, with modification hotspots at specific lysine residues preferentially located in the CH1 domain and Fab region
- All three PLOD isoenzymes (PLOD1, PLOD2, PLOD3) contributed to Hyl formation, with synergistic knockout of all three required to completely eliminate the modification — single or double knockouts were insufficient
- Hyl modification was influenced by cell culture parameters including iron availability, process duration, and clonal variability, providing actionable process development levers for controlling this PTM
- The modification affected trypsin digestion efficiency at modified sites, with increased missed cleavage events — a finding with direct implications for routine peptide mapping method development
- PLOD-knockout CHO cell lines maintained normal cell culture performance and productivity, establishing a practical path for engineering Hyl-free mAb production platforms
Significance: This study exemplifies how comprehensive LC-MS-based PTM characterization during biopharmaceutical development can uncover unexpected product modifications, identify their enzymatic origin, establish process parameter influences, and guide cell line engineering strategies — all within a RUO research workflow. For biologics developers, this work underscores the importance of thorough PTM characterization beyond routine glycosylation analysis and the value of LC-MS peptide mapping as a discovery tool for product-related variants that could impact product quality, consistency, and regulatory acceptance.
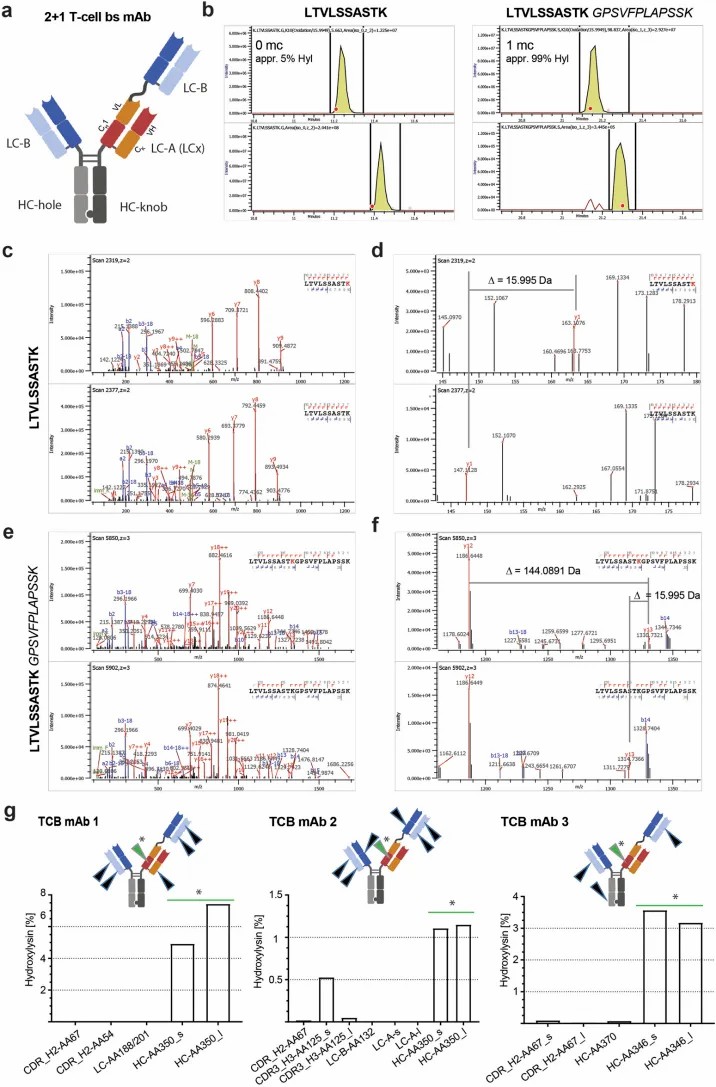
Figure 1 from Bauer et al. (2024). LC-MS/MS identification and characterization of 5R-hydroxylysine on therapeutic bispecific mAbs. (a) Extracted ion chromatograms and mass spectra showing the +15.9950 Da mass shift on tryptic peptide LTVLSSASTK. (b) Site mapping of Hyl modification on the TCB mAb structure highlighting CH1 and Fab domain hotspots. (c) CRISPR/Cas9 knockout validation of PLOD1/2/3 — complete Hyl elimination requires synergistic knockout of all three isoenzymes. (d) Cell culture parameter effects on Hyl levels: iron concentration, culture duration, and clonal variability. (CC BY 4.0)
Representative Biopharma PTM Characterization Data Outputs
Our biopharma PTM characterization pipeline delivers comprehensive, multi-level data outputs that provide a complete picture of product quality attributes. Below are representative examples of the key data types included in every project deliverable.
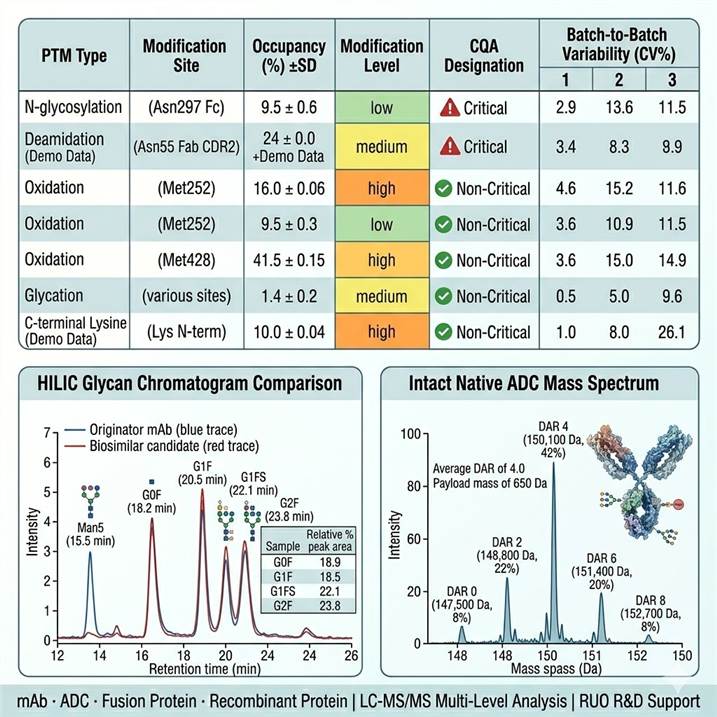
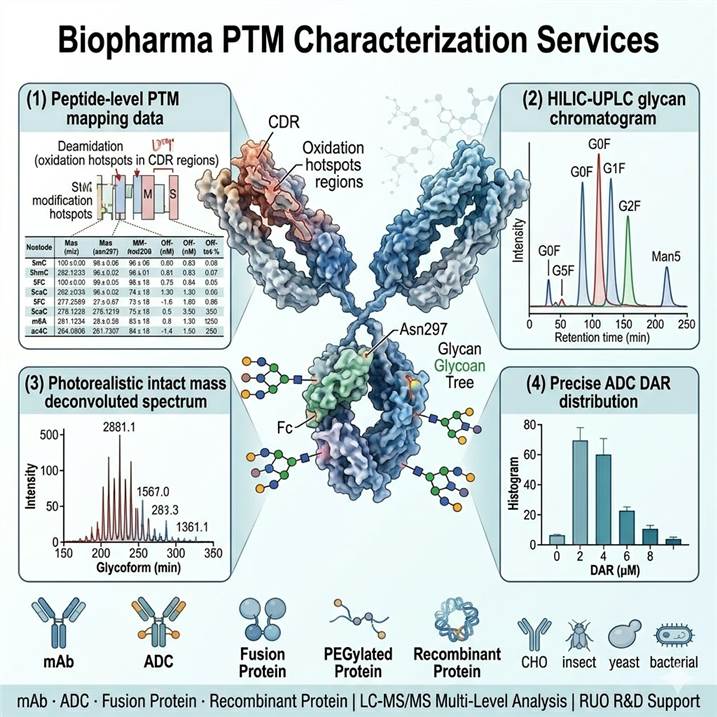
Representative biopharma PTM characterization data. (Left) PTM attribute summary table: PTM type (glycosylation, deamidation, oxidation, glycation), modification site (Asn297 Fc, Asn55 Fab CDR2, Met252, Met428, Lys N-term), occupancy percentage with ±SD, modification level classification (low/medium/high), CQA designation (Critical/Non-Critical), and batch-to-batch variability assessment. (Center) Overlaid HILIC glycan chromatograms comparing originator mAb (blue) vs biosimilar candidate (red) — major glycan species annotated (G0F, G1F, G1FS, G2F, G2FS, Man5, G0) with % peak area integration. (Right) Intact native MS spectrum for a cysteine-conjugated ADC showing deconvoluted mass peaks corresponding to DAR 0 (untagged), DAR 2, DAR 4, DAR 6, and DAR 8 species with relative abundance percentages and calculated average DAR value.
Every data deliverable includes raw LC-MS/MS data files (with acquisition parameters), processed PTM quantification tables with quality control metrics, annotated sequence coverage maps with PTM site positions, comparative glycan and PTM attribute visualizations, stable isotope-labeled internal standard verification data for critical PTMs, and a scientist consultation session for results interpretation within the biopharmaceutical development context. All workflows conform to RUO non-GMP research standards, with documentation formats compatible with ICH Q6B guideline expectations for analytical data packages.
Why Choose Our Biopharma PTM Characterization Services
Multi-Level, Modality-Tailored Analytical Platform
Our platform integrates intact mass, subunit, peptide-level, and glycan-release analysis within unified workflows customized for each product modality — monoclonal antibodies, ADCs, fusion proteins, PEGylated therapeutics, and recombinant proteins from diverse expression hosts. This modular approach ensures that the depth of characterization matches the development stage requirements, from rapid intact mass screening to comprehensive multi-attribute peptide mapping.
Comprehensive Biopharma-Specific PTM Expertise
Our scientists have extensive experience in the specific PTM characterization challenges of biopharmaceutical development, including glycosylation heterogeneity analysis, deamidation and oxidation hotspot identification in CDR regions, ADC DAR and payload characterization, PEGylation site confirmation, and host cell glycosylation profiling across CHO, insect, yeast, and bacterial expression systems. We have supported biologic programs from early discovery through preclinical development for mAbs, ADCs, bispecifics, and fusion proteins.
RUO Workflows Aligned with Biopharma Development Timelines
All characterization services operate under RUO non-GMP workflows designed specifically for biopharmaceutical discovery and development support — not clinical quality control release. Our accelerated timelines (2–4 weeks for standard mAb PTM mapping, 1–2 weeks for targeted glycosylation profiling) are structured to keep pace with the rapid iteration cycles of early-stage biologic development, candidate screening, and process optimization.
Integrated Biopharma Solutions Ecosystem
Our biopharma PTM characterization services operate within a comprehensive PTM and drug discovery platform that includes PTM enzyme activity assays (PTM Enzyme Activity and Inhibitor Screening), proteomics-based drug discovery support (PTMs in Drug Discovery and Development), and global PTM profiling capabilities — enabling seamless integration of product characterization data with broader drug development workflows.
Related Services
Our biopharma PTM characterization services are supported by a broader PTM proteomics and drug discovery platform offering complementary analytical capabilities for biopharmaceutical development programs.
- Global PTM Profiling — Broad multi-PTM discovery analysis across diverse protein modification classes for biopharmaceutical host cell protein characterization and product-related impurity profiling
- MS-Based PTM Analysis — Comprehensive mass spectrometry platform for protein-level PTM discovery, quantification, and characterization applicable to biopharmaceutical development
- PTM Qualitative Analysis — Qualitative PTM identification for early-stage biotherapeutic candidate characterization and unknown modification discovery
- PTM Site Occupancy Analysis — Accurate determination of PTM occupancy at specific residues for CQA assessment in biopharmaceutical development
- Covalent Drug PTM Profiling — Chemoproteomic profiling of covalent inhibitor target engagement relevant to ADC payload development
- Disulfide Bond Analysis — Disulfide bridge mapping and free thiol quantification for higher-order structure characterization of therapeutic proteins
- Ubiquitylomics Analysis — Ubiquitination profiling for biopharmaceutical development including host cell protein ubiquitination and degradation pathway analysis
- DUB and Ubiquitin Enzyme Activity Assays — Activity-based profiling of deubiquitinating enzymes relevant to targeted protein degradation and biopharmaceutical mechanism-of-action studies
- PTM Quantitative Analysis — Quantitative PTM profiling for biopharmaceutical comparability studies, including differential modification analysis across formulation conditions and process parameters
- PTM Bioinformatics Analysis — Advanced bioinformatics for PTM data interpretation, including PTM functional impact prediction and cross-platform data integration for biopharmaceutical development
Frequently Asked Questions
What is the difference between intact mass analysis and peptide mapping for biopharma PTM characterization?
Intact mass analysis provides a global view of product heterogeneity by measuring the mass of the entire protein, revealing glycoform distribution, C-terminal lysine processing, and overall modification state in a single rapid measurement. Peptide mapping provides amino acid-level PTM identification and quantification with site-specific resolution after proteolytic digestion. The two approaches are complementary: intact mass analysis is higher throughput and provides the "big picture" of product heterogeneity, while peptide mapping delivers the detailed PTM site occupancy data required for CQA assessment. For comprehensive characterization, we typically deploy both — intact mass for initial product assessment and batch-to-batch consistency screening, followed by peptide mapping for in-depth PTM profiling.
What are the typical sample requirements for biopharma PTM characterization?
Sample requirements vary by analytical objective and product modality. For standard monoclonal antibody PTM characterization by peptide mapping, we recommend ≥100 µg of purified protein per condition. For intact mass analysis alone, ≥10 µg is sufficient. For ADC DAR analysis, ≥50 µg of purified ADC is recommended. For glycosylation analysis (released glycan profiling), ≥50 µg of protein is sufficient. Samples should be provided in solution (PBS or similar buffer) at ≥1 mg/mL concentration where possible, and shipped on dry ice. We can work with lower amounts for targeted analyses; please contact us to discuss specific sample limitations.
Can you characterize biosimilar candidates and compare them to originator products?
Yes — biosimilar comparability PTM characterization is one of our core capabilities. Our standard biosimilar comparability workflow includes: side-by-side intact mass analysis for global mass profile comparison; comprehensive peptide mapping with site-specific PTM quantification across both products; comparative glycosylation profiling (released glycan and glycopeptide level); forced degradation comparison under thermal, oxidative, and photostress conditions; and statistical assessment of PTM attribute differences with CQA classification. All data are generated under RUO non-GMP workflows and are designed to support research-stage biosimilar development, not clinical batch release.
What PTMs can you detect and quantify on therapeutic antibodies?
Our standard mAb PTM characterization workflow detects and quantifies >30 distinct modification types, including: N-glycosylation (site occupancy and glycan heterogeneity at each N-linked site); deamidation (Asn→Asp/isoAsp, with site-specific occupancy); oxidation (Met, Trp, His, and Cys oxidation); isomerization (Asp isoAsp formation); glycation (Lys sugar adducts); N-terminal pyroglutamate formation (from Gln and Glu); C-terminal lysine processing (lysine truncation heterogeneity); succinimide intermediate formation (Asn and Asp); sequence variants (amino acid substitutions, insertions, deletions); and disulfide bond scrambling. Custom method development is available for modifications not in our standard panel.
How do you ensure PTM quantification accuracy across different batches and platforms?
PTM quantification accuracy is ensured through multiple orthogonal measures: isotope-labeled internal standards (AQUA peptides, SILAC spike-in) for targeted PTM quantification; system suitability standards and blank controls in each analytical batch to monitor system performance; inter-batch replicate correlation analysis (Pearson R ≥ 0.95 for replicate peptide mapping runs); independent QC samples at defined PTM levels (low, medium, high) included in every batch; and cross-platform validation where MRM/PRM assays on independent instruments confirm peptide mapping quantification results for critical PTM attributes.
Can you characterize ADC DAR and payload distribution alongside traditional PTM profiling?
Yes — our integrated ADC characterization platform simultaneously assesses conjugation parameters and traditional PTM attributes from the same sample. Our workflow includes: native MS for intact DAR distribution and average DAR calculation; subunit-level analysis (IdeS-digested) for DAR per Fab and Fc fragment; peptide mapping for conjugation site identification and payload occupancy per site; and HIC-HRMS for DAR-based separation with fraction collection for orthogonal PTM analysis per DAR species. This integrated approach enables correlation between DAR distribution, glycosylation, and other PTM attributes, providing a comprehensive view of ADC product quality.
What is the typical turnaround time for biopharma PTM characterization studies?
Turnaround times depend on the scope and depth of characterization. Standard mAb PTM peptide mapping with comprehensive modification profiling: 2–3 weeks from sample receipt. Targeted glycosylation analysis (released glycan profiling or glycopeptide analysis): 1–2 weeks. ADC DAR and conjugation characterization: 2–3 weeks. Biosimilar comparability studies with forced degradation: 3–5 weeks. Intact mass analysis (rapid screening): 1 week. For early-stage candidate screening requiring rapid turnaround, our expedited intact mass and subunit-level workflows can deliver results within 3–5 business days.
References
- Bauer N, Boettger M, Papadaki S, Leitner T, Klostermann S, Kettenberger H, Georges G, Larraillet V, Gluhacevic von Kruechten D, Hillringhaus L, Vogt A, Ausländer S, Popp O. Procollagen-lysine 2-oxoglutarate 5-dioxygenases are responsible for 5R-hydroxylysine modification of therapeutic T-cell bispecific monoclonal antibodies produced by Chinese hamster ovary cells. Front Bioeng Biotechnol. 2024;12:1414408.
- Mojumdar A, Yoo HJ, Kim DH, Park J, Park SJ, Jeon E, Choi S, Choi JH, Park M, Bang G, Cho K. Advances in mass spectrometry-based approaches for characterizing monoclonal antibodies: resolving structural complexity and analytical challenges. J Anal Sci Technol. 2024;15:25.
- Rathore AS, Sarin D, Bhattacharya S, Kumar S. Multi-attribute monitoring applications in biopharmaceutical analysis. J Chromatogr Open. 2024;6:100166.
For research use only. Not for use in diagnostic procedures.