Activity-Based Kinase Profiling — From Biochemical Potency to Cellular Selectivity
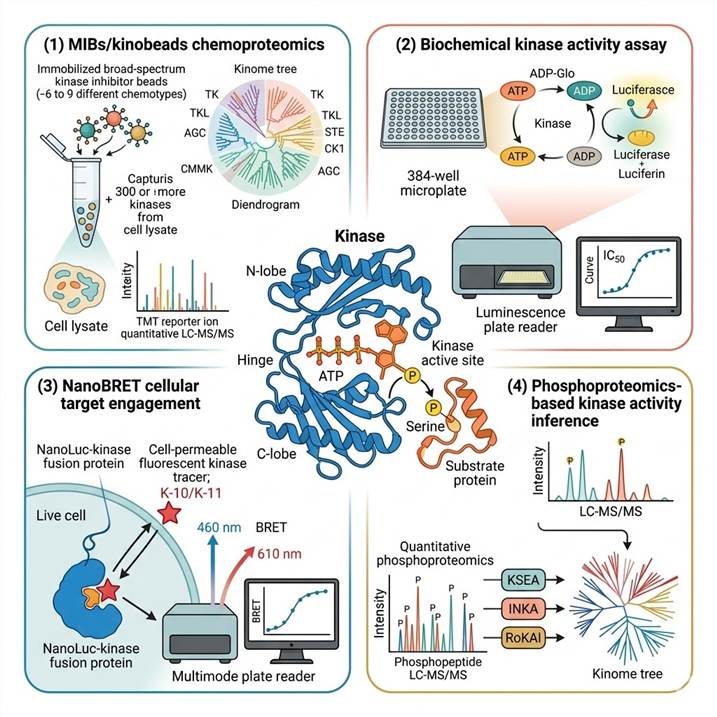
Kinase inhibitor programs fail most often not because of insufficient potency against the primary target, but because of insufficient selectivity across the kinome. Biochemical binding assays tell you which kinases your compound can bind; activity-based profiling tells you which kinases it functionally inhibits at pharmacologically relevant concentrations — a critical distinction, since ATP-competitive binding does not always translate to kinase inhibition in cells. Our platform integrates four orthogonal activity-based readouts — MIBs chemoproteomic kinome profiling (300+ kinases, dose-resolved Kd in native cellular context), biochemical ADP-Glo kinase activity assays (100+ recombinant kinases, Z′ > 0.7), NanoBRET live-cell target engagement (intracellular kinase occupancy), and phosphoproteomics-based kinase activity inference (KSEA/INKA from 15,000+ phosphosites) — to deliver a complete selectivity, target engagement, and pathway-level characterization from biochemical potency through cellular pharmacology. For complementary phospho-signaling analysis, our Phosphoproteomics Analysis provides global phosphopeptide identification and quantification, while Kinase-Substrate Network Analysis maps substrate relationships for functional interpretation of profiling data. We also offer comprehensive PTM Enzyme Activity & Inhibitor Screening across kinase, DUB, HDAC, and other PTM enzyme classes.
Find Your Solution: Research Goal → Kinase Activity Profiling Strategy
| Your Research Goal |
Recommended Approach |
Key Techniques |
| Proteome-wide kinase selectivity profiling of a lead compound in disease-relevant cell lines or tissue |
MIBs/kinobeads chemoproteomic kinome profiling with TMT multiplexed quantitative LC-MS/MS |
6–9 immobilized broad-spectrum kinase inhibitors (type I, type II, allosteric chemotypes) on Sepharose beads, cell/tissue lysate competition binding, TMT 10/11/16-plex quantification, nanoLC-MS/MS (Orbitrap Fusion Lumos), dose-resolved apparent Kd across 300+ kinases, kinome tree selectivity visualization |
| Biochemical IC₅₀ determination and potency ranking for hit-to-lead SAR |
Biochemical kinase activity panel (ADP-Glo luminescence) |
100+ recombinant kinases (TK, TKL, STE, CK1, AGC, CAMK, CMGC families), ATP at Km or 1 mM physiological, ADP-Glo detection, 10-point dose-response (1 nM–10 μM), four-parameter logistic IC₅₀, Z′ > 0.7, selectivity scores (S₁₀, S₅₀) across panel |
| Cellular target engagement — confirming intracellular kinase occupancy at pharmacologically relevant concentrations |
NanoBRET cellular kinase target engagement with full-length NanoLuc-kinase fusion in live cells |
NanoLuc-kinase fusion (transient or stable, HEK293T or disease-relevant cells), cell-permeable fluorescent tracer (K-10/K-11), BRET ratio (460/610 nm), 10-point compound titration, intracellular IC₅₀, residence time (washout kinetics), biochemical-to-cellular potency correlation |
| Functional kinase activity changes in signaling networks — which kinases are activated or inhibited by drug treatment |
Phosphoproteomics-based kinase activity inference (KSEA, INKA, RoKAI) |
TMT or label-free quantitative phosphoproteomics (TiO₂/IMAC enrichment, 15,000–30,000 phosphosites), kinase-substrate annotation (PhosphoSitePlus, Kinase Library, NetworKIN), KSEA/INKA/RoKAI activity scoring, kinome tree visualization of inferred kinase activities, pathway enrichment |
| Kinase active-site occupancy profiling for ATP-competitive inhibitor target deconvolution |
ABPP with ATP-desthiobiotin probes and quantitative LC-MS/MS |
Desthiobiotin-ATP/acyl-phosphate probe labeling of active kinase ATP-binding sites (± inhibitor competition), streptavidin enrichment, on-bead digestion, label-free or TMT LC-MS/MS, target occupancy (inhibitor/control ratio), ABPP selectivity heat map across 100+ kinases |
| Resistance mechanism elucidation — kinome reprogramming and bypass signaling pathway identification |
Combined MIBs kinome profiling + phosphoproteomics + Phospho-Signaling Antibody Array |
MIBs profiling of drug-sensitive vs. drug-resistant cells at multiple inhibitor concentrations, quantitative phosphoproteomics for global phosphorylation changes, Phospho-Signaling Antibody Array (100–200 kinase phosphorylation sites on AKT, ERK, mTOR, STAT, JNK, p38, etc.), KSEA/INKA activity inference, pathway enrichment for combination strategy design |
Integrated Platforms for Kinase Activity Profiling and Selectivity Characterization
Four complementary platforms — each delivering a distinct layer of selectivity information — from biochemical potency through cellular target engagement to functional signaling pathway modulation.
MIBs/Kinobeads Chemoproteomic Kinome Profiling
MIBs (multiplexed inhibitor beads) chemoproteomics provides the most physiologically relevant kinase selectivity data available: it measures inhibitor binding to 300+ endogenously expressed kinases in their native cellular context — at physiological expression levels, in complex with regulatory proteins, and subject to native post-translational modifications that influence drug binding. The MIBs affinity matrix incorporates 6–9 immobilized broad-spectrum kinase inhibitors spanning type I (DFG-in), type II (DFG-out), and allosteric chemotypes, capturing kinases regardless of activation state. In a competition format, the test compound is incubated with cell lysate at 8–10 concentrations before MIBs capture; inhibitor-occupied kinases are blocked from bead binding, and the dose-dependent reduction in capture quantified by TMT LC-MS/MS yields an apparent Kd for each of 300+ kinases — all from a single experiment. This is the selectivity data that answers the question medicinal chemists actually need answered: at a given concentration, which kinases does my compound engage in cells? For complementary phosphorylation site-level analysis, our Phosphorylation Site Identification and Quantitative Phosphoproteomics services provide global phosphosite identification and quantification.
Biochemical Kinase Activity Assays — ADP-Glo HTS Panel
For SAR-driven medicinal chemistry, you need quantitative IC₅₀ values against a defined kinase panel — fast. Our ADP-Glo luminescence platform delivers: 100+ recombinant kinases covering all seven major kinome families, ATP at Km or physiological concentration (1 mM), peptide or protein substrates, 10-point dose-response IC₅₀ determination in 384-well format, Z′ > 0.7 validated for each kinase, and selectivity scores (S₁₀, S₅₀, selectivity entropy) that provide numerical metrics trackable across compound series. The ADP-Glo universal detection chemistry (kinase reaction → ADP→ATP conversion → luciferase/luciferin luminescence) works with any substrate type — peptide, protein, or lipid — and requires no fluorescent labeling, eliminating substrate-dependent artifacts. Positive controls (staurosporine, well-characterized reference inhibitors) and DMSO vehicle controls are included in every plate for assay validation.
NanoBRET Cellular Kinase Target Engagement
Biochemical IC₅₀ under low-ATP buffer conditions frequently overestimates cellular potency by 5–50 fold. NanoBRET closes this translation gap by measuring intracellular kinase occupancy in live cells at physiological ATP concentrations (1–5 mM). A NanoLuc-kinase fusion (full-length, expressed at near-endogenous levels) and a cell-permeable fluorescent tracer (K-10 or K-11) generate a BRET signal when the tracer occupies the kinase ATP pocket; test compound displaces the tracer, reducing BRET in a concentration-dependent manner. The assay delivers intracellular IC₅₀, target occupancy at clinically relevant concentrations, residence time (washout t₁/₂), and a cell permeability correction factor (cellular IC₅₀/biochemical IC₅₀) — the data needed to establish PK-PD relationships and justify dose selection. For rapid pathway-level validation of downstream signaling consequences, our Phospho-Signaling Antibody Array service measures 100–200 kinase phosphorylation sites in parallel.
Phosphoproteomics-Based Kinase Activity Inference
When a kinase inhibitor enters cells, it doesn't just inhibit its target — it triggers signaling network adaptations: compensatory feedback activation of parallel pathways, relief of negative feedback, and kinome reprogramming that can drive resistance. Phosphoproteomics-based kinase activity inference captures these network-level effects by measuring changes at 15,000–30,000 phosphosites and computationally inferring which kinases are functionally activated or inhibited. Our workflow integrates deep quantitative phosphoproteomics (TMT or label-free, TiO₂/IMAC enrichment) with three complementary inference algorithms — KSEA (substrate enrichment), INKA (multi-dimensional activity scoring integrating activation loop phosphorylation and protein abundance), and RoKAI (network topology-aware robust inference) — and visualizes results as a kinome tree color-coded by kinase activity score. The output reveals not only the primary target's inhibition but also which parallel pathways have been activated — information that directly informs combination strategy and resistance mechanism studies. For phosphopeptide enrichment, our Phosphopeptide Enrichment service provides optimized TiO₂ and IMAC workflows.
Why Choose Our Kinase Activity Profiling Service
Four Integrated Selectivity Readouts, One Provider
Biochemical IC₅₀ (100+ kinases) → MIBs kinome Kd (300+ kinases) → NanoBRET intracellular occupancy → phosphoproteomics functional activity inference. Four orthogonal selectivity datasets generated from matched biological samples under consistent conditions, with direct correlation analysis across platforms — no multi-vendor fragmentation, no batch-effect confounding.
300+ Kinases in Native Cellular Context
Our MIBs matrix incorporates type I, type II, and allosteric inhibitor chemotypes to capture kinases regardless of activation state. Selectivity profiling is performed in your disease-relevant cell line or tissue — not in a heterologous expression system — so the kinases you profile are the kinases that matter in your indication, at physiological expression levels, in their native complexes.
Biochemical-to-Cellular Translation, Directly Measured
NanoBRET quantifies the gap between biochemical potency and cellular occupancy — the cell permeability, intracellular ATP competition, and protein binding factors that determine whether a compound actually engages its target in cells. Phosphoproteomics-based activity inference then reveals whether target occupancy translates to functional pathway inhibition or whether compensatory signaling undermines efficacy.
Validated Against Industry-Reference Selectivity Datasets
Our platforms are benchmarked against staurosporine (pan-kinase control), dasatinib and imatinib (reference selectivity fingerprints for MIBs profiling), and literature-curated selectivity data from Klaeger et al. (2017) kinobeads and Davis et al. (2011) Kd datasets — providing well-characterized reference points for interpreting your compound's selectivity profile in context.
Workflow: From Compound to Comprehensive Selectivity Profile
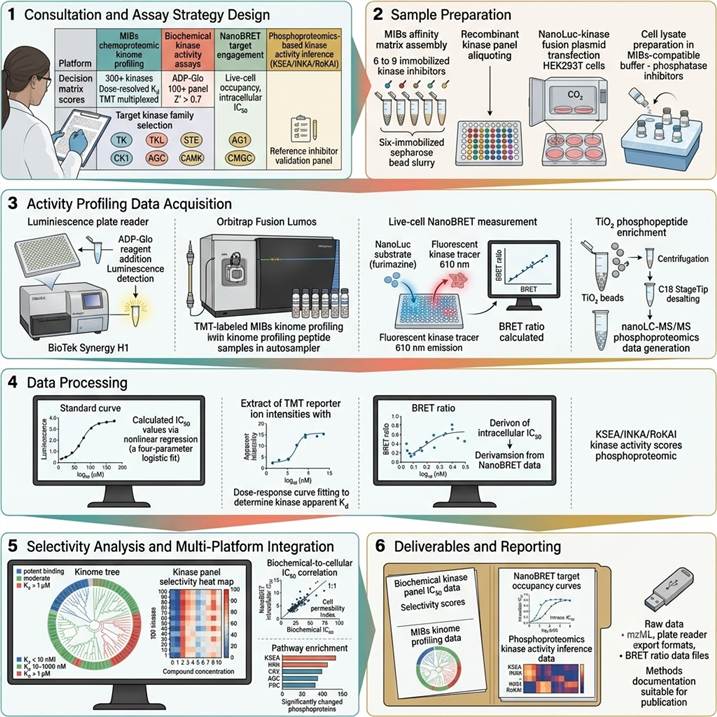
Step 1: Assay Strategy Design
We define the profiling strategy based on your objective (selectivity profiling, SAR panel, target engagement, resistance mechanism), kinase targets, sample type, and throughput. A detailed proposal covers platform selection, kinase panel design, controls, and analysis plan.
Step 2: Sample & Reagent Preparation
MIBs: lysates prepared in native buffer with phosphatase inhibitors. Biochemical: recombinant kinases QC'd and assembled into panels. NanoBRET: NanoLuc-kinase fusions transfected into live cells. Phosphoproteomics: proteins extracted, reduced, alkylated, digested.
Step 3: Data Acquisition
ADP-Glo luminescence on multimode plate reader (384-well). MIBs: streptavidin pull-down, on-bead digest, TMT labeling, nanoLC-MS/MS (Orbitrap Fusion Lumos, 120–180 min gradient). NanoBRET: BRET ratio (610/460 nm) measured ± compound. Phosphoproteomics: TiO₂/IMAC enrichment, nanoLC-MS/MS.
Step 4: Data Processing & Quantification
Biochemical: IC₅₀ by four-parameter logistic regression. MIBs: kinase ID (FDR < 1%), TMT reporter ion extraction, apparent Kd from dose-response curves. NanoBRET: BRET ratio → tracer displacement → intracellular IC₅₀. Phosphoproteomics: KSEA/INKA/RoKAI activity scores.
Step 5: Selectivity Analysis & Multi-Platform Integration
Kinome tree visualization with color-coded Kd/IC₅₀, selectivity scores (S₁₀, S₅₀), kinase family heat maps, biochemical-to-cellular IC₅₀ correlation, phosphoproteomics activity scores mapped to kinome tree, pathway enrichment, compensatory signaling identification.
Step 6: Reporting & Data Delivery
Comprehensive report: protocols, raw data (luminescence/BRET/mzML), IC₅₀ curves with 95% CI, kinome tree with Kd values, cellular occupancy data, phosphoproteomics activity scores, pathway enrichment, and publication-ready methods documentation.
Applications in Kinase Drug Discovery
Kinase Inhibitor Selectivity Profiling for Lead Optimization
For oncology programs, kinome selectivity is the difference between an approvable drug and a toxic compound. Our integrated platform delivers the multi-dimensional selectivity fingerprint — biochemical IC₅₀ panel, MIBs kinome Kd, NanoBRET cellular occupancy, and phosphoproteomics functional pathway readout — that enables medicinal chemists to optimize selectivity by directly visualizing how each structural modification shifts the kinome engagement profile. The MIBs platform is particularly valuable because it profiles endogenously expressed kinases in your disease-relevant cell line, capturing the kinases that matter in your indication at physiological expression levels.
Immune Kinase Selectivity — JAK, BTK, IRAK4, TYK2
Immune kinase inhibitors demand exceptional selectivity — cross-inhibition within the JAK/BTK/IRAK/SYK/TEC subfamily causes immunosuppression. We profile selectivity across the immune kinome in human PBMCs, B cells, T cells, and monocytes using MIBs chemoproteomics, with biochemical IC₅₀ determination across the full JAK family (JAK1/2/3/TYK2) at 1 mM ATP to accurately reflect cellular potency, and NanoBRET target engagement in immune cell lines to confirm intracellular selectivity.
Resistance Mechanism Elucidation — Kinome Reprogramming
Acquired resistance via kinome reprogramming is the major cause of kinase inhibitor treatment failure. By comparing MIBs kinome profiles of drug-sensitive vs. drug-resistant cells, we identify which kinases show reduced inhibitor binding (target mutations) and which show increased MIBs capture (bypass kinase activation). Concurrent phosphoproteomics and kinase activity inference reveals the functional signaling consequences, directly informing rational drug combination strategies.
CNS Kinase Inhibitor Profiling — LRRK2, RIPK1, p38α
Kinase targets for neurodegeneration — LRRK2 (Parkinson's), RIPK1 (neuroinflammation in Alzheimer's/ALS), p38α — require exceptional selectivity due to the critical roles CNS kinases play in neuronal survival. We support CNS programs with MIBs kinome-wide selectivity profiling in neuronal cell lines and brain tissue, NanoBRET target engagement in neuronal models, phosphoproteomics-based pathway analysis, and targeted LC-MS/MS quantification of kinase-specific PD biomarkers (LRRK2 S1292 autophosphorylation, Rab protein phosphorylation).
Covalent Kinase Inhibitor Selectivity & Target Engagement
Covalent inhibitors offer sustained target inhibition but carry unique selectivity risks — irreversible off-target cysteine labeling can cause idiosyncratic toxicity. We support covalent programs with biochemical ADP-Glo assays incorporating washout (distinguishing reversible from irreversible inhibition), MIBs chemoproteomics with washout to identify persistently engaged kinases, and integration with our Covalent Drug Cysteine PTM Profiling for proteome-wide cysteine reactivity assessment.
Case Study: Chemical Proteomics-Informed Design of Maximally Selective Kinase Inhibitor Combinations
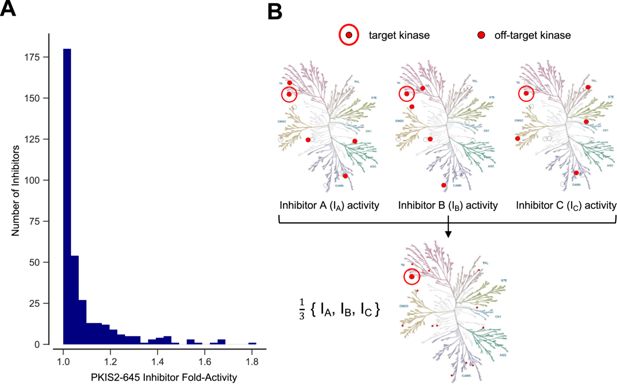
In a 2023 eLife study (CC BY 4.0), Outhwaite et al. developed a multicompound-multitarget scoring (MMS) framework that uses large-scale chemical proteomics datasets to rationally design kinase inhibitor combinations with dramatically improved selectivity — directly addressing the fundamental challenge that underlies our kinase activity profiling service: individual kinase inhibitors inevitably have polypharmacology, but combinations with complementary off-target profiles can achieve selectivity unattainable by any single compound.
Approach: MMS computes Jensen-Shannon distance between a combination's inhibition profile and an ideally selective profile, using flexible penalty functions for off-target activity. Screening all possible combinations from the Klaeger et al. kinobeads dataset (243 inhibitors, >200 kinases) identified three-inhibitor combinations reducing mean off-target activity by 80–96% relative to the best single inhibitor. For MAPK14 (p38α), a combination of dasatinib + GSK-461364 + reversine maintained >90% target occupancy while reducing off-target kinase engagement — validated by NanoBRET cellular target engagement in live HEK293T cells. The study establishes that kinase inhibitor selectivity can be dramatically improved through data-driven combination design informed by chemical proteomics, with NanoBRET providing essential cellular validation.
- MMS identified three-inhibitor combinations reducing mean off-target activity from 82% (dasatinib alone) to 30% — a selectivity improvement unattainable by any individual kinase inhibitor
- NanoBRET cellular target engagement validated MMS-predicted selectivity in live cells, confirming maintained target occupancy with reduced off-target kinase engagement
- The kinobeads chemical proteomics dataset — providing internally consistent, dose-resolved Kd values for 200+ kinases measured simultaneously — was essential for accurate combination selectivity prediction
- MMS also enables rational multitargeting: designing combinations that simultaneously inhibit 2–3 specific kinases (e.g., ABL1 + LYN + FYN for imatinib-resistant CML) while minimizing all other kinome activity
Adapted from Outhwaite et al. (2023). Death by a thousand cuts through kinase inhibitor combinations that maximize selectivity and enable rational multitargeting. eLife 12:e86189. (CC BY 4.0)
Platform Performance & Deliverables
| Parameter |
Biochemical ADP-Glo |
MIBs Kinome Profiling |
NanoBRET Target Engagement |
Phosphoproteomics Activity Inference |
| Coverage |
100+ recombinant kinases |
300+ kinases + 15+ lipid kinases |
Single kinase per assay |
Activity scores for 100–200 kinases |
| Readout |
Luminescence (endpoint) |
TMT LC-MS/MS (dose-resolved) |
BRET ratio (live-cell) |
KSEA/INKA/RoKAI z-scores |
| Throughput |
High (50K+ cpds/week) |
Medium (20–40 samples/week) |
Medium (40–80 cpds/week) |
Low-medium (10–20/week) |
| Quality metric |
Z′ > 0.7 |
CV < 20% |
CV < 15% |
CV < 25% (phosphosite-level) |
| Sample requirement |
10–100 ng kinase/well |
0.5–5 mg lysate |
1–5 × 10⁴ cells/well |
1–10 × 10⁶ cells or 10–50 mg tissue |
| Key deliverable |
IC₅₀ (95% CI), selectivity scores |
Apparent Kd, kinome tree |
Intracellular IC₅₀, washout t₁/₂ |
Kinase activity kinome tree, pathway enrichment |
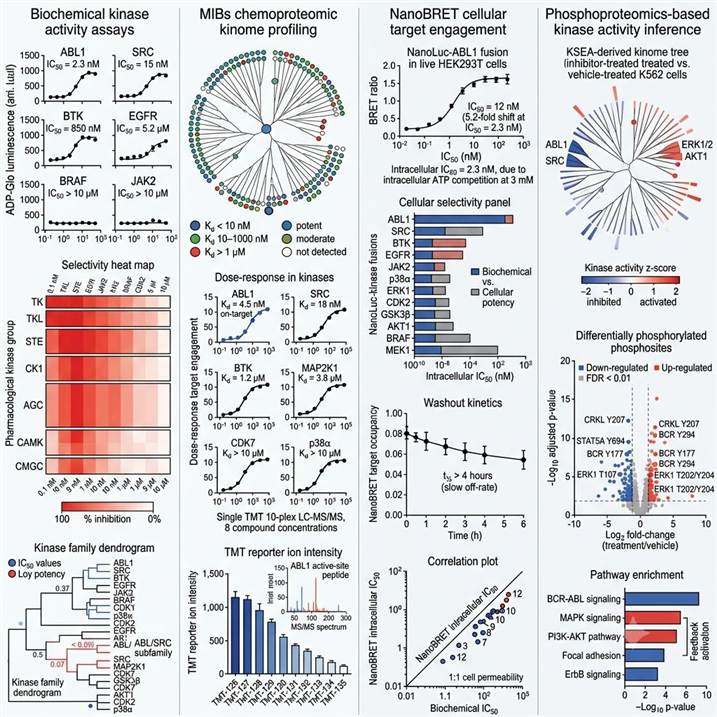
Representative data outputs from our Kinase Activity Profiling platform. Far left: Biochemical ADP-Glo kinase activity assay with IC₅₀ and selectivity heat map. Center-left: MIBs chemoproteomic kinome profiling with kinome tree and dose-resolved apparent Kd. Center-right: NanoBRET cellular target engagement with intracellular IC₅₀ and washout kinetics. Far right: Phosphoproteomics-based kinase activity inference with KSEA activity scores and pathway enrichment.
Every kinase activity profiling project includes:
- Biochemical kinase assay data package — IC₅₀ curves with 95% CI, Z′-factor metrics, selectivity scores (S₁₀, S₅₀), selectivity ratios across 100+ kinase panel, raw plate-reader data
- MIBs kinome profiling data package — apparent Kd values for 300+ kinases, dose-response curves, kinome tree visualization, raw MS data (mzML)
- NanoBRET target engagement data package — intracellular IC₅₀, target occupancy, washout kinetics (t₁/₂), biochemical-to-cellular correlation, raw BRET data
- Phosphoproteomics kinase activity inference data package — 15,000–30,000 phosphosites quantified, KSEA/INKA/RoKAI activity scores, kinome tree, pathway enrichment, raw LC-MS data
- Methods documentation — complete protocols, substrate sequences, MIBs matrix composition, LC-MS parameters, analysis methods — formatted for publication
Related Services
FAQs
What is the difference between MIBs kinome profiling and biochemical kinase activity assays?
Biochemical ADP-Glo assays use purified recombinant kinases in a defined buffer — they provide quantitative IC₅₀ values, are ideal for SAR and HTS (Z′ > 0.7), but measure inhibition under non-physiological conditions (low ATP, isolated catalytic domains, no regulatory proteins). MIBs chemoproteomic profiling measures inhibitor binding to 300+ endogenously expressed, full-length kinases in their native cellular context — at physiological expression levels, in complex with regulatory proteins, subject to native post-translational modifications, and at endogenous ATP concentrations. MIBs provides the kinome-wide selectivity profile that answers: at a given concentration, which kinases does my compound actually engage in cells? Both platforms are essential, and our integrated workflow enables direct cross-platform correlation.
How many kinases can you profile in a single MIBs experiment?
We routinely identify and quantify 300+ protein kinases and 15+ lipid kinases per experiment. Cancer cell lines (HeLa, K562, MCF7) yield 280–350 kinases; tissue samples 200–300; immune cell subsets (PBMCs, T cells, B cells) 200–280. The MIBs matrix incorporates 6–9 immobilized inhibitors spanning type I, type II, and allosteric chemotypes, collectively capturing kinases across all seven major kinome families. TMT multiplexing enables dose-resolved profiling across 8–10 compound concentrations in a single LC-MS/MS experiment, with each concentration measured against all detected kinases.
How does NanoBRET measure cellular kinase target engagement?
NanoBRET detects bioluminescence resonance energy transfer between a NanoLuc-kinase fusion (energy donor, 460 nm) and a cell-permeable fluorescent kinase tracer (energy acceptor, 610 nm) that reversibly occupies the kinase ATP pocket. A test compound that binds the ATP pocket displaces the tracer, reducing BRET signal in a concentration-dependent manner. Key advantages: (1) full-length kinases in live, unlysed cells — preserving native localization and protein interactions; (2) measured at physiological intracellular ATP (1–5 mM) rather than the low ATP used in biochemical assays; (3) NanoLuc's exceptional brightness enables near-endogenous expression levels; (4) ratiometric BRET readout cancels variations in cell number and expression; (5) compatible with washout experiments for residence time (t₁/₂) measurement.
How does phosphoproteomics-based kinase activity inference work?
If a kinase is inhibited, phosphorylation of its direct substrates decreases; if it is activated (e.g., feedback signaling), substrate phosphorylation increases. Our workflow applies three complementary algorithms to 15,000–30,000 quantified phosphosites: KSEA (Kinase Substrate Enrichment Analysis) — computes enrichment of known substrates among up/down-regulated phosphosites; INKA (Integrative Inferred Kinase Activity) — integrates phosphoproteomic data with kinase activation loop phosphorylation and protein abundance; RoKAI (Robust Kinase Activity Inference) — accounts for kinase-substrate network topology. Results are visualized as a kinome tree color-coded by activity score, directly revealing which kinases and pathways are functionally modulated by treatment.
What sample types are compatible with MIBs kinome profiling?
Fresh or flash-frozen cell pellets (1–10 × 10⁶ cells per condition), tissue biopsies (10–50 mg), tumor specimens, sorted cell populations (min. 5 × 10⁵ cells). Samples must be lysed in native MIBs-compatible buffer (50 mM Tris pH 7.5, 150 mM NaCl, 5% glycerol, 1.5 mM MgCl₂, 0.2–0.5% NP-40, phosphatase/protease inhibitors, 1 mM DTT) — denaturing buffers (RIPA, urea, SDS) destroy kinase native structure and cannot be used. Samples should be snap-frozen and stored at −80°C; freeze-thaw cycles reduce kinase activity. Tissue should be frozen within 15 minutes of collection. Biochemical assays require purified recombinant kinases (10–100 ng/well). NanoBRET requires live cells (> 90% viability).
How do you assess kinase inhibitor selectivity across the kinome?
Through four orthogonal selectivity measurements: (1) Biochemical — 100+ kinase panel IC₅₀ with selectivity scores (S₁₀, S₅₀, selectivity entropy); (2) Chemoproteomic — MIBs kinome profiling, apparent Kd for 300+ kinases, kinome tree with color-coded selectivity; (3) Cellular — NanoBRET intracellular IC₅₀ for 10–20 kinases, cell permeability index (cellular/biochemical IC₅₀); (4) Functional — phosphoproteomics kinase activity inference revealing which kinases are functionally inhibited vs. activated via feedback. A selective inhibitor shows >50-fold IC₅₀ window over >90% of the biochemical panel, S₁₀ < 5 at 1 μM in MIBs profiling, and >10-fold cellular selectivity window. A promiscuous inhibitor shows S₁₀ > 30 and IC₅₀ values within 10-fold for most kinases.
How does kinase activity profiling support drug discovery from hit to candidate?
Hit ID: biochemical HTS (ADP-Glo, Z′ > 0.7, 50K+ compounds/week) with 50-kinase counter-screen to eliminate promiscuous inhibitors early. Hit-to-lead: 100+ kinase panel IC₅₀ guides SAR — each structural modification assessed for both potency and selectivity. Lead optimization: MIBs kinome profiling (300+ kinases, dose-resolved Kd) provides the kinome-wide selectivity landscape; NanoBRET confirms intracellular target occupancy. Preclinical candidate: integrated biochemical, chemoproteomic, and cellular selectivity data — combined with phosphoproteomics functional pathway confirmation — provides the selectivity and pharmacology package for candidate nomination. One coordinated workflow, one provider, consistent experimental conditions throughout.
References
- Outhwaite IR, Singh S, Berger BT, Knapp S, Chodera JD, Seeliger MA. Death by a thousand cuts through kinase inhibitor combinations that maximize selectivity and enable rational multitargeting. eLife. 2023;12:e86189.
- Eberl HC, Werner T, Reinhard FB, Lehmann S, Thomson D, Chen P, Zhang C, Rau C, Muelbaier M, Drewes G, Drewry D, Bantscheff M. Chemical proteomics reveals target selectivity of clinical Jak inhibitors in human primary cells. Scientific Reports. 2019;9:14159.
- van Tol BDM, et al. Neutron-encoded diubiquitins to profile linkage selectivity of deubiquitinating enzymes. Nature Communications. 2023;14:1661.
For research use only. Not for use in diagnostic procedures.