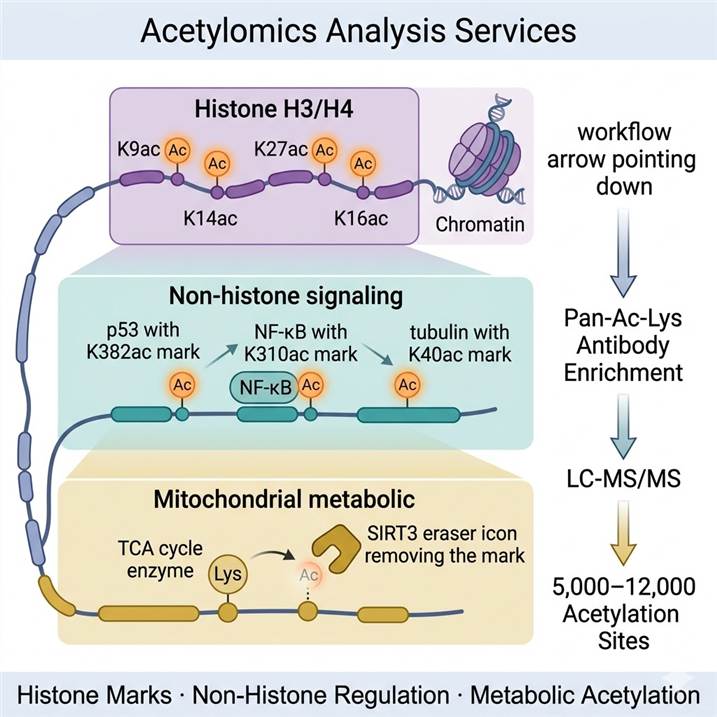
Lysine Acetylation — From Histone Mark to Proteome-Wide Regulatory Code
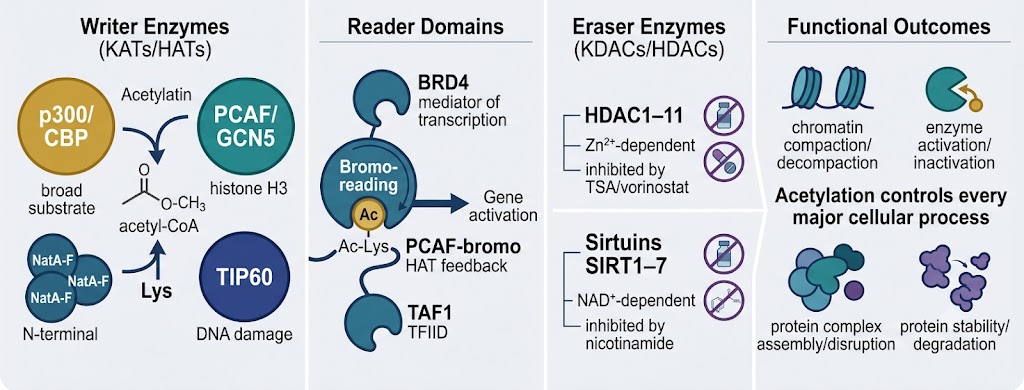
Lysine N-ε-acetylation transfers an acetyl group from acetyl-CoA to the ε-amino group of lysine residues, neutralizing the positive charge and altering local electrostatics, structure, and molecular recognition. The modification is installed by lysine acetyltransferases (KATs, also called HATs for histone acetyltransferases) and removed by lysine deacetylases (KDACs, also called HDACs for histone deacetylases or Sirtuins for NAD⁺-dependent deacetylases). Acetylated lysines are recognized by bromodomain-containing reader proteins that translate the modification into downstream regulatory events.
Critically, acetylation is not just an epigenetic mark. Systematic acetylomics studies have demonstrated that the modification occurs on thousands of non-histone proteins across all major cellular compartments — with distinct functional consequences in each context.
Histone Acetylation & Epigenetic Regulation
Acetylation of histone H3 (K9ac, K14ac, K18ac, K27ac, K36ac, K56ac) and H4 (K5ac, K8ac, K12ac, K16ac) marks open, transcriptionally active chromatin regions. H3K27ac is a superenhancer mark; H3K9ac marks active promoters; H4K16ac disrupts higher-order chromatin compaction. These marks are installed by p300/CBP, PCAF, GCN5, and related HATs, and erased by HDAC1–3 (class I, nuclear) and HDAC4/5/7/9 (class IIa). Quantitative acetylomics of histone marks is the primary analytical readout for HDAC inhibitor treatment, HAT activator studies, and epigenetic drug MoA characterization.
Non-Histone Protein Acetylation & Signaling
p53 is acetylated at K382 by p300 in response to DNA damage — increasing its transcriptional activity and apoptotic function; HDAC inhibition raises p53 K382 acetylation ~4-fold. NF-κB RelA is acetylated at K310 by p300/CBP upon activation — augmenting DNA binding and priming ubiquitin-dependent clearance. PCNA acetylation at K164 promotes non-template repair polymerase recruitment. Tubulin acetylation at K40 by αTAT1 marks stable microtubule populations targeted by HDAC6. These and thousands of other non-histone acetylation events are detectable and quantifiable by acetylomics — the full scale of which cannot be captured by any antibody-based single-site assay.
Metabolic Acetylation & Mitochondrial Regulation
Mitochondrial proteins are extensively acetylated — driven partly by the high local concentration of acetyl-CoA in the mitochondrial matrix, which enables nonenzymatic acetylation at susceptible lysines. SIRT3 is the primary mitochondrial deacetylase, deacetylating and activating key TCA cycle and fatty acid oxidation enzymes. Acetylomics of mitochondria-enriched fractions or whole-cell lysates identifies SIRT3 substrate networks, metabolic enzyme regulation, and the mitochondrial response to nutrient state changes — connecting protein acetylation directly to metabolic flux and energy homeostasis. Acetyl-CoA availability links acetylomics directly to metabolomics and nutrient-sensing research.
Acetylation Stoichiometry — Why It Matters
Most lysine acetylation occurs at very low stoichiometry. Proteome-scale studies have shown that the median acetylation stoichiometry in human cells is approximately 0.02% — meaning that for a typical non-histone acetylation site, fewer than 1 in 5,000 copies of the protein carry the modification at any given time. High-stoichiometry acetylation (>1% occupancy) is predominantly concentrated on nuclear transcriptional regulators and acetyltransferases. This stoichiometry distribution has fundamental implications for data interpretation: a 2-fold fold-change on a site with 0.01% basal occupancy may not be biologically significant, while the same fold-change at a site with 20% occupancy certainly is. Our acetylomics workflows include stoichiometry calculations alongside relative quantification — providing the occupancy context necessary to interpret fold-change data correctly.
N-Terminal Acetylation
N-terminal acetylation (NTA) is one of the most abundant protein modifications in eukaryotes — occurring co-translationally on 50–80% of human proteins via N-terminal acetyltransferases (NatA–NatF). NTA affects protein stability (N-end rule pathway), membrane targeting, and protein complex assembly. Unlike Lys acetylation, NTA is largely irreversible and constitutive. Our acetylomics workflow identifies and quantifies N-terminal acetylation separately from Lys acetylation using specific database search parameters for α-amino group acetylation, enabling comprehensive characterization of the NTA proteome alongside the Lys acetylome.
Acetylation & Drug Discovery
HDAC inhibitors (vorinostat/SAHA, romidepsin, entinostat, panobinostat) are approved cancer therapeutics with broad acetylation effects that extend far beyond histone hyperacetylation. KAT (HAT) inhibitors targeting p300/CBP (A-485, CCS1477) and PCAF/GCN5 are in clinical and preclinical development. Sirtuin modulators (SRT2104, nicotinamide) affect NAD⁺-dependent deacylation. For any of these programs, quantitative acetylomics is the definitive analytical tool: identifying all acetylation sites regulated by the drug, establishing dose-response relationships at the site level, detecting off-target deacetylase effects, and characterizing the temporal dynamics of acetylation changes that precede transcriptional reprogramming. Our HDAC/HAT Activity Assay service provides complementary enzymatic activity measurement alongside acetylomics profiling.
Acetylomics Sub-Services
Standalone pan-Ac-Lys antibody immunoaffinity enrichment of acetylated peptides from tryptic digests — provided as a sample preparation service for research groups that perform their own LC-MS/MS analysis. Enrichment is performed using validated anti-acetyllysine monoclonal antibody beads at 4 °C under standardized IAP buffer conditions. Enrichment efficiency is monitored per batch using spiked synthetic acetylated peptide standards. Post-enrichment samples are delivered as dried peptides on C18 StageTips, ready for LC-MS/MS injection.
Qualitative identification of acetylation sites — determining which lysine residues and N-termini carry acetylation in your sample without quantitative comparison between conditions. Suitable for initial characterization of the acetylome of an unstudied protein, organism, or cell type; for confirming acetylation status of a target protein; or for generating a comprehensive site list prior to targeted quantitative follow-up. Site localization probability (ptmRS ≥0.75) is reported for every identified site.
Site-level relative quantification of acetylation changes between conditions — applying SILAC, TMT, DIA/SWATH, or label-free strategies to compare acetylation abundance across treatment groups, time points, or disease states. Delivers log2 fold-change, p-value, and adjusted p-value per site, alongside stoichiometry estimates where protein abundance data from pre-enrichment aliquots enables normalization. See the PTM Quantitative Analysis hub for quantification strategy selection guidance.
Histone Acetylation Analysis
Dedicated histone modification profiling workflow using acid extraction, propionylation derivatization (before and after trypsin digestion to improve histone peptide retention and detection), and short-gradient LC-MS/MS optimized for histone peptides. Covers all H3, H4, H2A, and H2B acetylation marks simultaneously — including K9ac, K14ac, K18ac, K27ac, K36ac (H3), K5ac, K8ac, K12ac, K16ac (H4) — with quantitative stoichiometry measurement per mark across conditions. Co-occurring combinatorial modifications (e.g., H3K9ac + H3K14ac on the same peptide) are also characterized. See dedicated Histone PTM Analysis service →
HDAC / HAT Inhibitor Response Acetylomics
Comprehensive acetylomics characterization of cellular response to HDAC or HAT inhibitor treatment — designed for drug MoA studies, target engagement confirmation, and off-target acetylation effect profiling. Uses SILAC or TMT quantification to compare treated vs. DMSO-control acetylomes, with protein normalization to distinguish acetylation-intrinsic changes from protein abundance effects. Time-course and dose-response designs are supported. Integrates with HDAC/HAT Activity Assays and phosphoproteomics from matched samples for combined epigenetic-signaling characterization.
Acetylation Stoichiometry Measurement
Quantification of the fractional occupancy of specific acetylation sites — the percentage of the total protein population carrying the modification at each site. Stoichiometry measurement requires parallel detection of both the acetylated modified peptide and the unmodified counterpart in the same sample, with normalization for protein abundance. Identifies which acetylation events are high-occupancy regulatory switches (>5% stoichiometry) versus low-occupancy background events, providing functional context for fold-change data from differential acetylomics. Applicable to HDAC inhibitor titration studies, cell-cycle stage comparisons, and nutrient perturbation experiments.
Acylation Panel — Acetyl + Emerging Acyl Marks
Extended profiling combining acetylation with other short-chain acyl modifications from the same digest — crotonylation, succinylation, lactylation, propionylation, butyrylation, malonylation, 2-hydroxyisobutyrylation — in a coordinated multi-enrichment workflow. Enables crosstalk analysis between modification types at shared lysine sites. See Acylation Quantitative Proteomics Service for the full multi-acyl panel, or individual pages for Crotonylation, Lactylation, and Succinylation services.
Acetylomics Data Analysis
Bioinformatics-only service for research groups with existing acetylomics raw data requiring expert analysis — re-processing of raw files with current software, site localization scoring with ptmRS, quantitative normalization, statistical testing, stoichiometry calculation, GO/KEGG pathway enrichment, and HDAC/KAT substrate network annotation. Delivered with publication-ready figures and methods text. See Acetylomics Data Analysis Service →
Acetylomics Technology Platform
Enrichment Chemistry
Pan-Ac-Lys antibody immunoaffinity enrichment is the primary method for global acetylomics. We use validated pan-acetyllysine monoclonal antibody-bead conjugates (Cell Signaling Technology, cat. #13416 or equivalent validated batch). Tryptic digests are incubated with antibody beads at 4 °C in IAP buffer for 2 h with end-over-end mixing. Three IAP washes and two PBS washes remove non-specifically bound peptides. Enriched acetylated peptides are eluted with 0.15% TFA, desalted on C18 StageTips, and dried for LC-MS/MS.
A key technical consideration: trypsin generates peptides with free Lys C-termini that are unmodified — these can be partially recognized by pan-Ac-Lys antibodies as background. To reduce this artifact and simultaneously improve the retention of hydrophilic histone peptides, our histone acetylomics workflow applies propionylation derivatization before and after trypsin digestion: pre-digestion propionylation caps unmodified and monomethylated lysines (distinguishing them from acetyl-Lys by mass); post-digestion propionylation caps peptide N-termini. This strategy is essential for high-quality histone acetylation stoichiometry data.
Mass Spectrometry Acquisition
Acetylated peptides are analyzed by nanoflow UHPLC (75 µm × 50 cm C18, 90 min gradient) coupled to high-resolution mass spectrometry. Platform selection is matched to the experimental design:
Thermo Orbitrap Fusion Lumos — primary platform for acetylomics requiring high MS2 resolution for site localization, EThcD fragmentation for N-terminal acetylation and labile modifications, and SPS-MS3 for TMT multiplexed acetylomics with reduced ratio compression.
Q Exactive HF-X — for DDA-based SILAC and label-free acetylomics with high scan rates for deep acetylome coverage.
Bruker timsTOF Pro (diaPASEF) — for DIA-based large-cohort acetylomics with ion mobility separation reducing co-elution between acetylated and unmodified isobaric peptides, improving quantitative precision at low stoichiometry sites.
Acetylation (+42.011 Da) is specified as a variable modification on Lys and protein N-termini in all database searches; trimethylation (+42.047 Da) is included as a competing variable modification to distinguish the two isobaric marks by Orbitrap mass accuracy.
Data Analysis & Bioinformatics
Database search: MaxQuant (SILAC/LFQ) or Proteome Discoverer (TMT) with acetyl (+42.011 Da) on Lys and protein N-terminus as variable modifications; trimethyl (+42.047 Da) and propionyl (+56.026 Da) for histone workflows; ptmRS for site localization probability scoring (≥0.75 threshold for confident site assignment).
Quantification: SILAC delivers the highest ratio accuracy for two-condition comparisons in cell lines; TMT-MS3 enables 16-plex multi-condition acetylomics; DIA with spectral library or DIA-NN library-free search provides low-missing-value large-cohort quantification.
Stoichiometry: site occupancy is calculated using the ratio of modified to unmodified counterpart peptide intensities, normalized by the corresponding protein abundance ratio from the pre-enrichment total proteome aliquot.
Functional annotation: regulated sites mapped to HAT/HDAC substrate databases, PhosphoSitePlus acetylation annotations, bromodomain reader recognition motifs, KEGG/Reactome metabolic and signaling pathways. Subcellular localization enrichment analysis identifies compartment-specific acetylation regulation.
Sample Requirements
| Service Type |
Sample Type |
Minimum Protein Input |
Pre-Collection Requirements |
| Global acetylomics (pan-Ac-Lys enrichment) |
Cultured cells, tissue, FFPE sections |
≥2 mg per sample (standard); ≥500 μg (low-input) |
Add protease inhibitors (PMSF + cocktail) and deacetylase inhibitors (trichostatin A 1 μM + nicotinamide 5 mM) to lysis buffer before use; lyse on ice; snap-freeze cell pellets within 60 s of media removal |
| Histone acetylomics (acid extraction) |
Cultured cells, fresh/frozen tissue |
≥5 × 10⁶ cells; ≥20 mg tissue |
Snap-freeze immediately; ship on dry ice. TSA + nicotinamide at lysis critical. Acid extraction performed in-house from cell pellets; pre-extracted acid-soluble histones accepted (≥50 μg) |
| HDAC/HAT inhibitor acetylomics |
Cultured cells (SILAC or TMT) |
≥3 mg per condition (SILAC); ≥2 mg per plex member (TMT) |
Include TSA + nicotinamide in lysis buffer; for SILAC, confirm ≥97% heavy label incorporation before drug treatment experiment; ship labeled cell pellets on dry ice |
| Acetylation stoichiometry measurement |
Cultured cells, tissue |
≥3 mg (acetylome enrichment + pre-enrichment proteome aliquot) |
Same as global acetylomics; 5% pre-enrichment aliquot is retained in-house for total proteome quantification — no additional sample required |
| Low-input acetylomics |
Primary cells, sorted cell populations, FFPE tissue sections |
≥100 μg (500 μg preferred); ≥50,000 sorted cells |
For sorted cells: sort directly into lysis buffer containing TSA + nicotinamide; no wash step before lysis. For FFPE: provide 10–15 sections at 10 μm thickness per sample |
Critical note: Deacetylase inhibitors (TSA for HDAC inhibition + nicotinamide for Sirtuin inhibition) must be added to lysis buffer immediately before use. Without them, enzymatic deacetylation continues during cell disruption and lysis, artificially reducing the detected acetylome — particularly for low-stoichiometry non-histone sites most sensitive to deacetylase activity. We provide a complete sample collection protocol for every project type upon inquiry.
Acetylomics Workflow
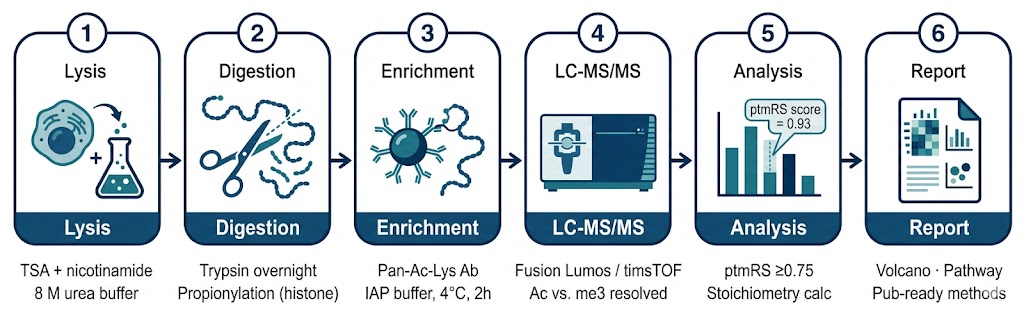
Step 1 — Lysis & Protein Extraction
Cells are lysed in urea lysis buffer (8 M urea, 50 mM ammonium bicarbonate) supplemented with protease inhibitors, TSA (1 μM), and nicotinamide (5 mM). Protein concentration is measured by BCA. For SILAC projects, heavy and light lysates are mixed at a 1:1 protein mass ratio. For TMT projects, each sample is processed independently to the peptide stage before pooling after labeling. A 5% pre-enrichment aliquot is retained for total proteome quantification to enable stoichiometry and protein normalization calculations.
Step 2 — Reduction, Alkylation & Digestion
Proteins are reduced with DTT (10 mM, 30 min, 37 °C), alkylated with chloroacetamide (25 mM, 30 min, RT, dark), diluted to ≤2 M urea, and digested with sequencing-grade trypsin (1:50 enzyme:protein, overnight, 37 °C). For histone acetylomics, propionylation derivatization is applied before digestion (to cap unmodified and monomethylated Lys) and after digestion (to cap peptide N-termini). Digestion completeness is assessed by LC-UV before enrichment. For TMT projects, isobaric labeling is performed on dried, desalted peptides before pan-Ac-Lys enrichment.
Step 3 — Pan-Ac-Lys Immunoaffinity Enrichment
Lyophilized peptides are reconstituted in IAP buffer and incubated with anti-Ac-Lys antibody-bead conjugate at 4 °C for 2 h with end-over-end rotation. Non-specifically bound peptides are removed by sequential washes (three IAP, two PBS). Acetylated peptides are eluted with 0.15% TFA, desalted on C18 StageTips, and lyophilized for LC-MS/MS. Enrichment efficiency is monitored using a synthetic acetylated peptide standard spiked before the IAP step; we report enrichment specificity (% acetylated peptides in eluate) and recovery as QC metrics.
Step 4 — LC-MS/MS Acquisition
Enriched acetylated peptides are analyzed by nanoflow UHPLC-MS/MS on the platform matched to the quantification strategy (Fusion Lumos for SILAC/TMT-MS3; Q Exactive HF-X for DDA-LFQ; timsTOF Pro for diaPASEF-DIA). Database searches include acetyl (+42.011 Da, Lys and N-term), trimethyl (+42.047 Da, Lys), propionyl (+56.026 Da, for histone workflows), carbamylation, oxidation, and deamidation as variable modifications; 1% FDR at PSM and protein level; ptmRS site localization scoring with ≥0.75 threshold for confident site reporting. Acetylation vs. trimethylation disambiguation is confirmed at Orbitrap mass accuracy for ambiguous sites.
Step 5 — Quantitative Analysis & Stoichiometry
Site-level normalized intensities (LFQ/DIA) or isotope ratios (SILAC) or reporter ion intensities (TMT) are extracted and compared between conditions. Protein abundance ratios from the pre-enrichment proteome aliquot are used to correct acetylation ratios for protein expression changes — delivering modification-intrinsic acetylation fold-changes. Stoichiometry is calculated per site as: (acetylated peptide intensity / (acetylated + unmodified counterpart intensity)) × 100%. Statistical testing: t-test or limma for small sample sizes; Benjamini-Hochberg FDR correction; significance thresholds: |FC| ≥1.5 and padj ≤0.05 as default (adjustable per project).
Step 6 — Bioinformatics & Reporting
Regulated acetylation sites are annotated against PhosphoSitePlus, the Histone Modification Database, and KAT/KDAC substrate databases. GO biological process, molecular function, and KEGG pathway enrichment is performed on proteins with significantly regulated acetylation. Subcellular localization enrichment identifies compartment-specific regulation (nuclear chromatin, mitochondria, cytoplasm). HAT/HDAC substrate motif enrichment analysis identifies which writer/eraser enzyme families are most affected. Deliverables: raw data files, site identification and quantification tables, stoichiometry matrix, differential analysis results, bioinformatics figures (volcano, heatmap, GO/KEGG bubble plots, subcellular enrichment, substrate network), and comprehensive project report with publication-ready methods text.
Representative Acetylomics Data
The following illustrate the quantitative outputs and analytical figures generated by our standard acetylomics workflows — from differential site analysis and subcellular localization enrichment to acetylation stoichiometry distributions typical of project deliverables.
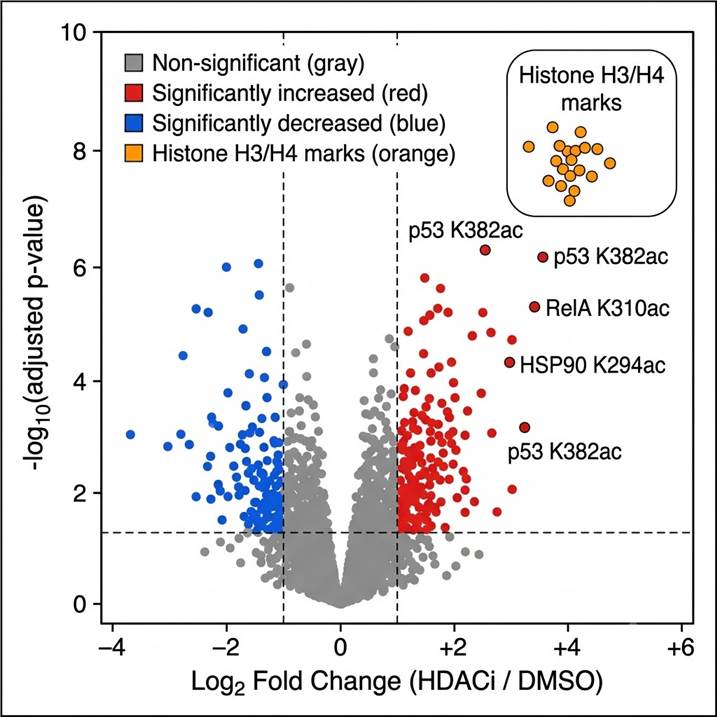
Fig. 1 — Volcano plot of SILAC-quantified acetylation sites in HDAC inhibitor-treated vs. DMSO control cells. Each point = one Lys acetylation site; red = significantly increased acetylation (padj ≤0.05, FC ≥2); blue = significantly decreased. Histone H3/H4 sites (orange circles) are highlighted as the primary HDAC substrate class. Several non-histone sites are also annotated, demonstrating the proteome-wide scope of HDAC inhibitor acetylation effects beyond chromatin.
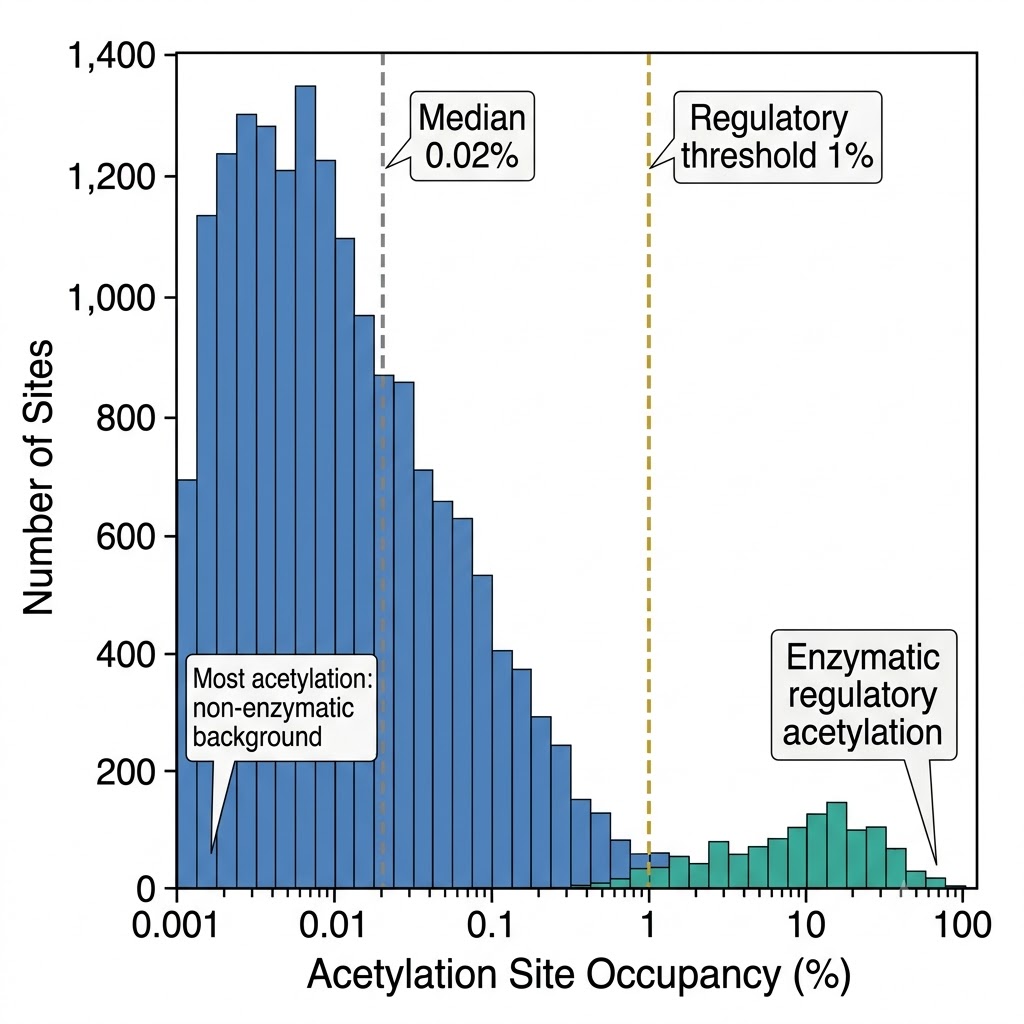
Fig. 2 — Acetylation site stoichiometry distribution across 6,000+ sites. X-axis: acetylation occupancy (%), log scale. Y-axis: number of sites. Median stoichiometry ~0.02% for the bulk acetylome; high-stoichiometry tail (>1%) enriched for nuclear transcriptional regulators and histone marks. Stoichiometry is provided per site for all acetylomics projects, contextualizing fold-change data with occupancy information.
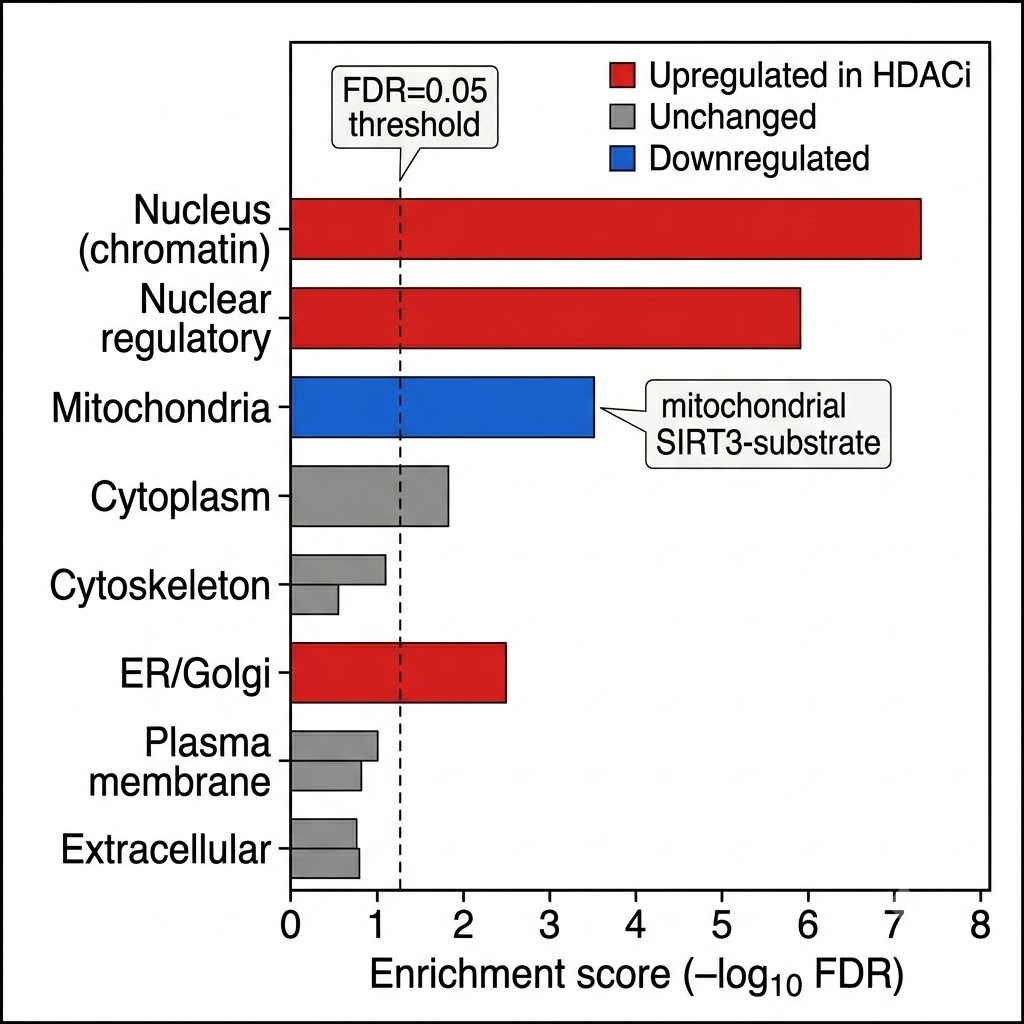
Fig. 3 — Subcellular localization enrichment of significantly regulated acetylation sites after HDAC inhibitor treatment. Nuclear and chromatin-associated proteins are most enriched among upregulated sites; mitochondrial SIRT3 substrates show distinct regulation pattern. Cytoplasmic and cytoskeletal acetylation sites are less affected — illustrating compartment-specific HDAC inhibitor selectivity detectable by acetylomics.
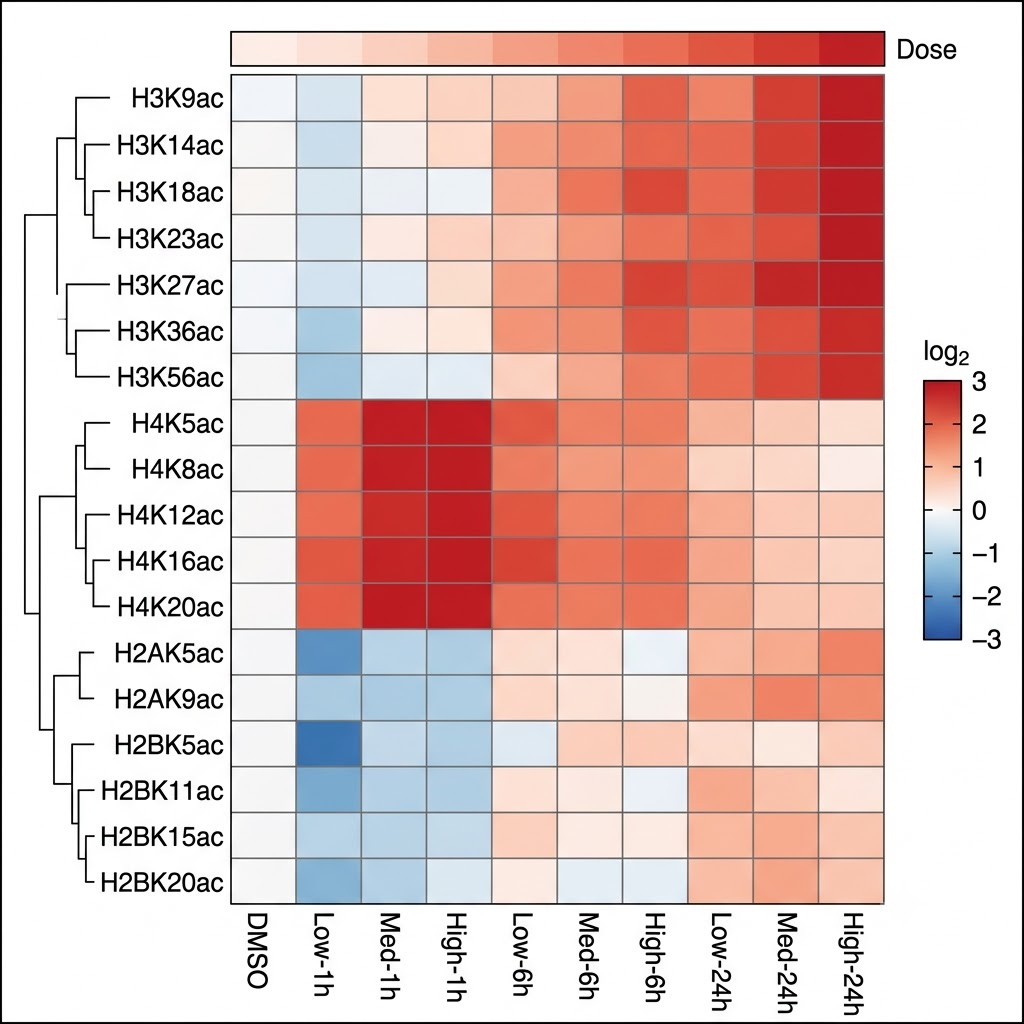
Fig. 4 — Quantitative heatmap of histone acetylation marks across HDAC inhibitor dose-response and time-course conditions. Rows = individual histone Lys acetylation sites (H3 and H4 marks labeled). Columns = drug concentrations × time points. Color scale: log2 fold-change vs. DMSO control. H4 marks (K5ac, K8ac, K12ac, K16ac) show rapid, high-magnitude response; H3 marks follow with slightly delayed kinetics — dose and time-dependent dynamics quantifiable by acetylomics.
Case Study — Proteome-Wide Acetylation Stoichiometry Defines Mechanistic Constraints on Protein Regulation in Human Cells
Reference: Hansen BK, Gupta R, Baldus L, Lyon D, Narita T, Lammers M, Choudhary C, Weinert BT. Analysis of human acetylation stoichiometry defines mechanistic constraints on protein regulation. Nat Commun. 2019;10:1055. DOI: 10.1038/s41467-019-09024-0 (CC BY 4.0, PMC6401094)
Background & Scientific Question
Thousands of acetylation sites had been identified in human cells by the time of this study, but a fundamental parameter remained poorly characterized: what fraction of each protein population is actually acetylated at any given lysine site? This stoichiometry question is biologically critical — a 2-fold fold-change in a site with 20% basal occupancy has different mechanistic significance than the same fold-change in a site with 0.005% basal occupancy. Without stoichiometry data, it is impossible to determine which acetylation events are high-occupancy regulatory switches versus which represent nonenzymatic background acetylation unlikely to contribute to protein regulation. Hansen, Gupta, Choudhary, and Weinert at the University of Copenhagen set out to measure acetylation stoichiometry at proteome scale in human cells — providing the first comprehensive, quantitatively validated stoichiometry map of the human acetylome.
Methods
To measure stoichiometry, both the acetylated and the unmodified counterpart peptide for each site must be quantified in the same experiment. The study used a spike-in SILAC strategy: chemically acetylated heavy-labeled reference peptides were spiked into HeLa cell lysates at known concentrations, enabling absolute quantification of both acetylated and unmodified endogenous peptides via their ratios to the heavy reference. Pan-Ac-Lys antibody enrichment was combined with unenriched total proteome analysis from the same samples to provide the protein-level normalization needed to convert peptide ratios into percentage occupancy values. HDAC inhibitors (trichostatin A for class I/II HDACs, tubacin for HDAC6, nicotinamide for Sirtuins) were applied to map which sites are regulated by specific deacetylase classes. CBP/p300 HAT inhibitors and chemical genetics approaches identified KAT-regulated sites with elevated stoichiometry.
Results Overview
The study delivered validated stoichiometry measurements for 6,829 acetylation sites on 2,535 proteins — the most comprehensive quantitative acetylome resource available at the time of publication. The key findings:
Stoichiometry is extremely low for most sites: the median stoichiometry across all 6,829 sites is ~0.02% — meaning that most acetylation events in the cell occur on far less than 1% of the protein population. This low-stoichiometry bulk is dominated by nonenzymatic acetylation from acetyl-CoA that is unlikely to serve regulatory functions.
High-stoichiometry acetylation (>1%) is concentrated on nuclear transcriptional regulators: histones, acetyltransferases, and transcription factors that depend on acetylation for function have dramatically higher occupancy than cytoplasmic or mitochondrial proteins. This bimodal distribution explains why acetylation-dependent regulation is most firmly established for nuclear proteins.
CBP/p300 preferentially targets high-stoichiometry sites: KAT3A/B (p300/CBP) substrate sites have significantly higher median stoichiometry than sites regulated by other KATs — consistent with its role as a broad epigenetic "writer" maintaining high-occupancy chromatin acetylation marks. HDAC inhibition raises histone acetylation stoichiometry from ~20–30% to >80% within hours, while most non-histone sites increase by only 1.5–2-fold — revealing the steep dose-response hierarchy between chromatin and non-chromatin acetylation.
Relevance to Our Service
This study defines the analytical framework that our acetylomics stoichiometry service is built around. The finding that most acetylation occurs below 0.05% occupancy means that fold-change data alone — without stoichiometry — cannot distinguish regulatory acetylation from nonenzymatic background: a 3-fold increase from 0.005% to 0.015% occupancy is analytically real but functionally unlikely to be regulatory; a 3-fold increase from 10% to 30% occupancy is both measurable and almost certainly mechanistically significant.
Our Acetylation Stoichiometry Measurement service implements the same principle: parallel measurement of acetylated and unmodified counterpart peptides with protein-level normalization, delivering percentage occupancy values per site alongside relative fold-change data. For HDAC inhibitor characterization studies, our quantitative acetylomics workflow captures both the chromatin-level hyperacetylation response and the non-histone site regulation — providing the complete acetylome MoA readout that the data in this study established as the field standard.
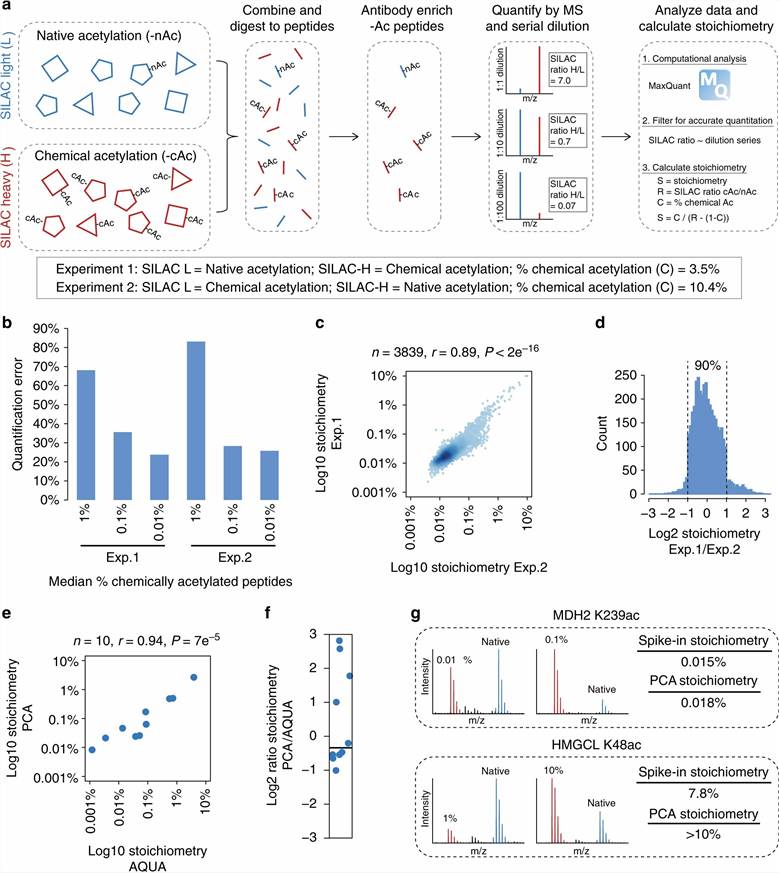
Adapted from Hansen et al. 2019, Nat Commun 10:1055, CC BY 4.0, PMC6401094. Acetylation stoichiometry distribution across 6,829 sites in human HeLa cells — median 0.02%, high-stoichiometry (>1%) enriched for nuclear transcriptional regulators. Source data for stoichiometry-aware acetylomics interpretation.
References
- Hansen BK, Gupta R, Baldus L, Lyon D, Narita T, Lammers M, Choudhary C, Weinert BT. Analysis of human acetylation stoichiometry defines mechanistic constraints on protein regulation. Nat Commun. 2019;10:1055. doi.org/10.1038/s41467-019-09024-0
- Narita T, Weinert BT, Choudhary C. Functions and mechanisms of non-histone protein acetylation. Nat Rev Mol Cell Biol. 2019;20(3):156-174. doi.org/10.1038/s41580-018-0081-3
- Scholz C, Weinert BT, Wagner SA, et al. Acetylation site specificities of lysine deacetylase inhibitors in human cells. Nat Biotechnol. 2015;33(4):415-423. doi.org/10.1038/nbt.3130
- Choudhary C, Kumar C, Gnad F, et al. Lysine acetylation targets protein complexes and co-regulates major cellular functions. Science. 2009;325(5942):834-840. doi.org/10.1126/science.1175371
- Wagner GR, Payne RM. Widespread, enzyme-independent Nε-acetylation and Nε-succinylation of proteins in the chemical conditions of the mitochondrial matrix. J Biol Chem. 2013;288(40):29036-29045. doi.org/10.1074/jbc.M113.486753
FAQs — Acetylomics Analysis
Why must deacetylase inhibitors (TSA + nicotinamide) be added at lysis — what happens without them?
HDAC enzymes (classes I, II, IV) and Sirtuins (class III, NAD⁺-dependent) are active in cell lysates and begin removing acetyl groups from proteins immediately upon cell disruption. Without inhibitors, rapid deacetylation occurs during the lysis and processing period — particularly for low-stoichiometry non-histone acetylation sites that are continuously cycling in vivo and have very little buffering against enzyme activity in the extract. Trichostatin A (TSA, 1 μM) inhibits class I/II HDACs; nicotinamide (5 mM) inhibits Sirtuins (SIRT1–7). Both must be present in the lysis buffer before you add cells or tissue — not added afterward. The combination is required because neither agent alone covers all deacetylase classes: TSA does not inhibit Sirtuins and nicotinamide does not inhibit HDAC1-11. Experiments where TSA + nicotinamide were omitted consistently show lower acetylome depth and specifically lose the most dynamically regulated non-histone sites, which are also the biologically most interesting. We provide a sample collection protocol with the exact concentrations and timing for every acetylomics project.
How do you distinguish acetylation from trimethylation, which have nearly identical mass shifts?
Acetylation (+42.0106 Da) and trimethylation (+42.0470 Da) differ by only 36.4 mDa — a separation that cannot be resolved by unit-resolution instruments (triple-quads, ion traps) but is cleanly resolved by Orbitrap detection at ≥25,000 FWHM MS2 resolution. We specify both modifications as competing variable modifications in the database search and apply Orbitrap high-resolution MS2 for all acetylomics projects. For histone peptides where both modifications co-occur on Lys (e.g., H3K27 can carry either K27ac or K27me3), we additionally apply propionylation derivatization before digestion: propionyl groups (+56.026 Da) are added to unmodified and monomethylated lysines by propionylation chemistry, while trimethylated (no free amine reactivity) and acetylated (acyl group blocks reactivity) Lys are not propionylated — providing a chemical distinction between modification states that supplements mass accuracy-based discrimination. For ambiguous cases that cannot be confidently assigned by mass alone, we report both possibilities with localization probability scores and flag sites for orthogonal validation.
What is the difference between histone acetylomics and global (non-histone) acetylomics — and can both be done from the same sample?
Histone acetylomics uses a dedicated sample preparation workflow — acid extraction to isolate histones, propionylation derivatization to block unmodified Lys and improve short histone peptide retention, and short-gradient LC-MS/MS optimized for highly basic histone peptides. Global (pan-proteome) acetylomics uses standard urea lysis, trypsin digestion, and pan-Ac-Lys antibody enrichment of all acetylated peptides from all proteins. The two workflows have different biases: histone acetylomics achieves very high coverage and accurate stoichiometry for histone marks but is optimized specifically for this substrate class; global acetylomics covers non-histone proteins with high depth but achieves lower coverage of histone marks because short, highly basic histone peptides are not efficiently retained or enriched by standard reverse-phase and antibody procedures. Both can be performed from the same starting material — we split the lysate after protein extraction: one aliquot proceeds through acid extraction for histone analysis, another through the standard trypsin + pan-Ac-Lys enrichment pipeline for non-histone acetylomics. This split approach provides complete histone mark coverage alongside the full non-histone acetylome from a single experiment, requiring ~3–5 mg total starting material per sample.
How many acetylation sites and proteins can I expect to identify?
From standard cell line input (≥2 mg total protein, HeLa, HEK293, or equivalent well-characterized cell lines), our pan-Ac-Lys enrichment workflow typically identifies 5,000–12,000 unique Lys acetylation sites on 2,000–4,000 proteins in a single-shot acquisition. Adding N-terminal acetylation identification extends the total to 7,000–15,000 acetylation events. For histone acetylomics specifically (using the dedicated acid extraction + propionylation workflow), 60–80 individual histone mark positions on H3, H4, H2A, and H2B are quantifiable per experiment with combinatorial co-modification analysis. Primary cells, tissue, and biofluids typically yield lower numbers than established cell lines due to proteome complexity and protein abundance differences: tissue samples (≥3 mg input) typically yield 3,000–8,000 acetylation sites. For HDAC inhibitor experiments, depth is comparable to basal conditions — the acetylome increases in size as new sites become detectable upon hyperacetylation, with typical increases of 20–40% more sites identified in HDAC inhibitor-treated vs. control samples.
Can acetylomics be combined with phosphoproteomics or ubiquitylomics from the same samples for cross-PTM analysis?
Yes — multi-PTM profiling from the same sample is available through our Pan PTM Proteomics and Global PTM Profiling services. The most common combination with acetylomics is phospho + acetyl — applicable to chromatin regulation studies (where phosphorylation and acetylation crosstalk on H3 Ser10/Lys14 is a canonical example), HDAC inhibitor MoA studies (where signaling phosphorylation changes co-occur with acetylation changes), and metabolic regulation research (where kinase signaling and acetyl-CoA-dependent acetylation interact). Phospho IMAC enrichment and pan-Ac-Lys immunoaffinity enrichment are applied to aliquots from the same protein digest — either the full digest is split between enrichments, or sequential enrichment is applied to maximize recovery from the same starting material. For studies requiring phospho + ubiquitin + acetyl simultaneously, our Global PTM Profiling service covers all three modification types from a single project engagement, with integrated cross-modification co-regulation analysis as part of the deliverable package.