Why LC-MS/MS for Ubiquitylomics — Beyond Antibody-Based Approaches
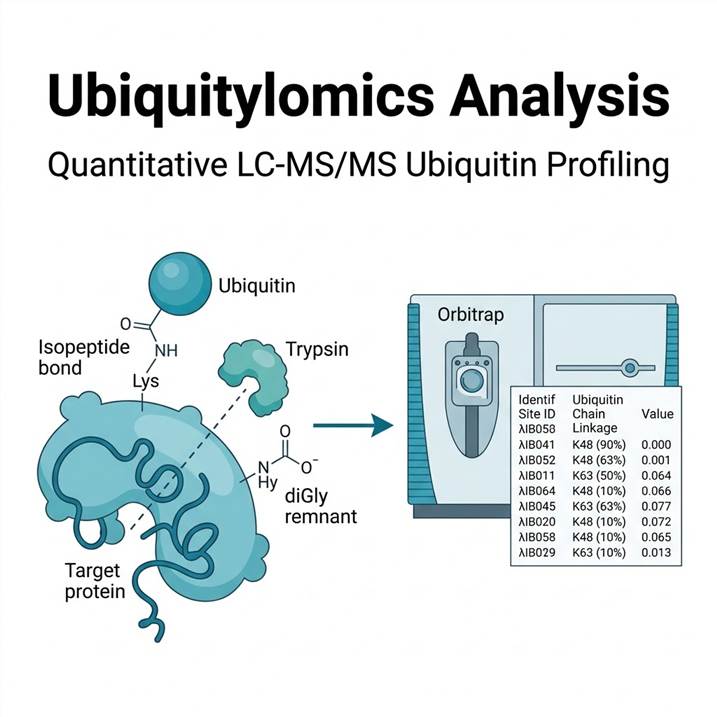
Anti-ubiquitin antibodies detect ubiquitinated proteins but cannot reveal which lysine residue is modified or quantify modification stoichiometry. Ubiquitin antibodies also fail to distinguish between mono-ubiquitination and poly-ubiquitin chains, and provide no information about chain linkage type (K48 vs K63 vs M1). LC-MS/MS-based ubiquitylomics overcomes these limitations entirely.
After trypsin digestion, ubiquitin-modified proteins leave a characteristic Gly-Gly (diGly) remnant of +114.043 Da on the modified lysine residue. This diagnostic mass shift is detected at the MS level and confirmed by MS/MS fragmentation, providing unambiguous site identification. Unlike antibody-based methods that report only "ubiquitinated or not," our platform simultaneously identifies the modified residue, quantifies relative modification levels across conditions, and provides information on chain topology through ubiquitin-derived peptide analysis.
K-ε-GG Enrichment & DiGly Peptide Identification
The key to deep ubiquitinome coverage is efficient enrichment of diGly-modified peptides from the complex tryptic peptide mixture. Our workflow uses a well-validated monoclonal antibody (clone UbiSite or equivalent) that recognizes the K-ε-GG remnant motif, enabling specific immunoprecipitation of ubiquitinated peptides while non-modified peptides are washed away.
Enrichment Specificity and Coverage
In a standard experiment using 1–5 mg of total protein digest, our K-ε-GG enrichment routinely identifies 5,000–15,000 unique ubiquitination sites from 2,000–5,000 proteins. False discovery rate at the site level is maintained below 1% using target-decoy searching with site localization probability scoring. The enrichment specificity — defined as the fraction of identified peptides carrying a diGly modification — exceeds 80% in most experiments, ensuring that the majority of MS acquisition time is spent sequencing genuine ubiquitination events.
Ubiquitylomics Workflow — From Sample to Site-Specific Quantification
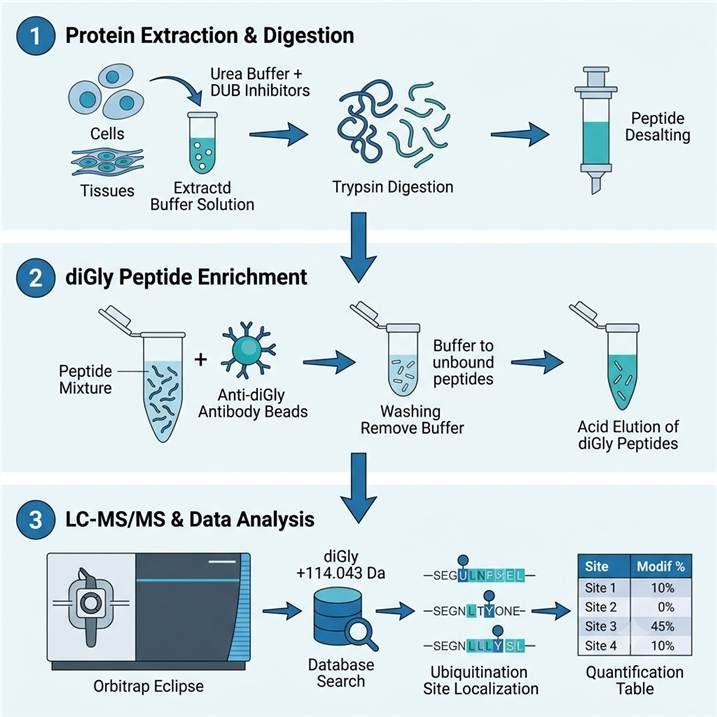
Step 1: Protein Extraction & Digestion
- Cell/tissue lysis in urea-based buffer with protease + deubiquitinase inhibitors
- Protein reduction (DTT), alkylation (iodoacetamide), and trypsin digestion
- Desalting and quantification of peptide mixture
Step 2: K-ε-GG Enrichment
- Immunoprecipitation using anti-diGly antibody conjugated to agarose beads
- Stringent washes to remove non-specific peptides
- Elution of diGly-modified peptides under acidic conditions
- Desalting and concentration for LC-MS/MS
Step 3: LC-MS/MS & Quantification
- Orbitrap Eclipse Tribrid MS with FAIMS Pro for increased depth
- Database search for diGly (+114.043 Da) on K as variable modification
- Label-free or TMTpro quantification for multi-condition comparison
- Site localization scoring, FDR filtering, and biological annotation
For broader modification mapping across the proteome, our Global PTMs Profiling service and Pan PTM Proteomics provide complementary multi-PTM coverage.
Ubiquitin Chain Topology — Distinguishing K48, K63 & Other Linkage Types
Beyond identifying ubiquitination sites, understanding the type of ubiquitin chain assembled on a substrate is critical for biological interpretation. K48-linked chains target proteins for proteasomal degradation; K63-linked chains regulate signaling, trafficking, and DNA repair; M1 (linear) chains activate NF-κB; and atypical linkages (K6, K11, K29, K33) have specialized functions in mitosis and stress responses.
Our workflow distinguishes chain linkage types by analyzing ubiquitin-derived tryptic peptides. After trypsin digestion, ubiquitin itself generates a series of linkage-specific peptides. Each linkage type produces a unique peptide with a characteristic mass: for example, the K48-linked ubiquitin peptide contains a diGly-modified K48 residue within a specific sequence context, while the K63-linked peptide is chromatographically and mass-distinct. By quantifying these linkage-specific peptides, we report the relative abundance of each chain type in the sample — information that is invisible to antibody-based ubiquitin detection.
Research Applications — Cancer Biology to PROTAC Development
PROTAC-Induced Ubiquitination Profiling
PROTACs (proteolysis-targeting chimeras) induce ubiquitination of a target protein by recruiting an E3 ligase. Our ubiquitylomics platform provides direct evidence of PROTAC-mediated target ubiquitination, identifies ubiquitination sites on the target, and profiles off-target ubiquitination events across the proteome — delivering selectivity data that is essential for preclinical candidate selection. For complementary analysis of cysteine reactivity and target engagement in covalent drug discovery, our Redox PTM Proteomics platform provides parallel capabilities.
Cancer Ubiquitinome Characterization
Dysregulated ubiquitination is a hallmark of many cancers. Our service enables systematic comparison of ubiquitination profiles between tumor and normal tissues, identifying differentially ubiquitinated proteins and pathways. These data can reveal novel oncogenic mechanisms and prioritize targets for ubiquitin-directed drug discovery programs. For related analysis of oxidative PTMs, our Protein Oxidation Analysis service provides complementary depth.
Sample Requirements for Ubiquitylomics Analysis
| Sample Type |
Recommended Amount |
Storage & Shipping |
Critical Notes |
| Cultured cells (mammalian) |
1 × 10⁷ – 5 × 10⁷ cells |
Snap-freeze pellet; −80 °C, ship on dry ice |
Include deubiquitinase inhibitors (e.g., 10 µM PR-619, 50 µM NEM) in lysis buffer |
| Tissue (tumor/normal) |
20–100 mg tissue |
Snap-freeze in liquid N₂; −80 °C |
Homogenize in urea buffer with DUB inhibitors. Avoid prolonged thawing |
| Cells + PROTAC treatment |
2 × 10⁷ cells per condition |
Snap-freeze after drug incubation; −80 °C |
Include DMSO-only control. Time-course (2–24 h) recommended for kinetics |
| Immunoprecipitated samples |
5–50 µg enriched protein |
−80 °C, ship on dry ice |
Provide enrichment protocol details for compatibility assessment |
Deliverables — Quantitative Ubiquitylomics Reports
Standard Deliverables
- Ubiquitination site identification table — protein, site position, sequence, localization probability, and MS/MS spectrum
- Quantification results — relative abundance for each site across conditions, with fold-change and p-value
- DiGly enrichment efficiency report — percent of identified peptides carrying diGly modification
- Ubiquitin chain linkage analysis — relative abundance of K48, K63, M1, and atypical chain types
- Functional annotation — GO enrichment, KEGG pathway, and protein-protein interaction network analysis
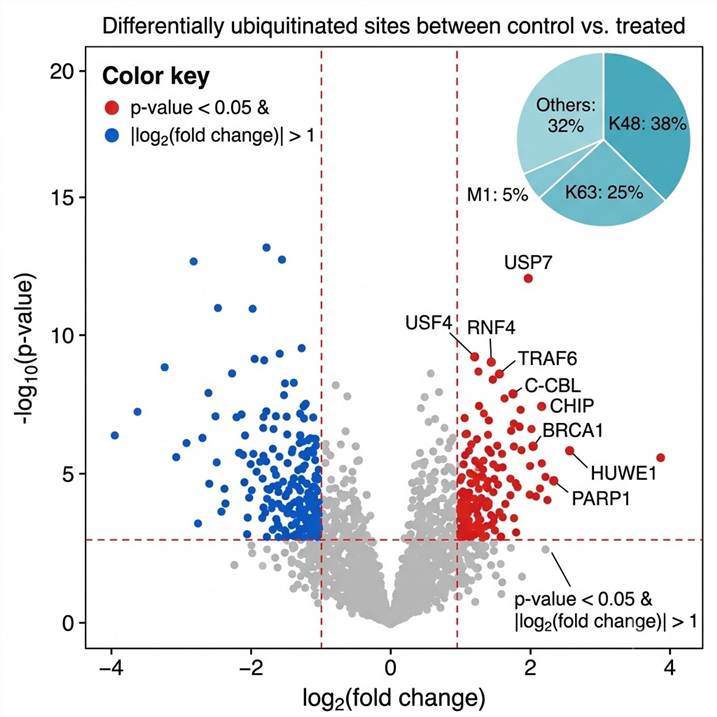
Case Study: Quantitative Ubiquitinome Profiling of Lung Squamous Cell Carcinoma
To demonstrate the biological insights achievable through ubiquitylomics, we highlight a study by Zhan et al. (Frontiers in Endocrinology, 2022) that applied quantitative ubiquitinomics to profile ubiquitination alterations in human lung squamous cell carcinoma (LSCC) tissues using anti-ubiquitin antibody enrichment coupled with label-free LC-MS/MS.
Study Design and Depth
The study analyzed LSCC tumor tissues and matched adjacent normal tissues to identify differentially ubiquitinated proteins and pathways. The analysis identified 627 ubiquitinated proteins carrying 1,209 ubiquitination sites, providing the first quantitative ubiquitinome map of LSCC.
Prognostic and Functional Significance
Cross-analysis of the 627 ubiquitinated proteins with TCGA patient survival data identified 33 proteins whose ubiquitination levels correlated with overall survival — 11 as protective factors and 22 as risk factors. Protein-protein interaction network analysis revealed 6 major molecular networks and 234 hub molecules, with the ribosomal protein RPS2 emerging as a central node whose high expression correlated with poor prognosis (Fig. 4–5, Zhan et al.). KEGG pathway analysis of the ubiquitinated proteins highlighted 47 significantly enriched pathways, including ribosome, ubiquitin-mediated proteolysis, PI3K-Akt, mTOR, and HIF-1 signaling (Fig. 6).
Ubiquitination of Protein Turnover Machinery
The study identified ubiquitination on 13 ribosomal subunits, including RPS2 at K58 and K275, RPS3 at K214, and RPS20 at K8, suggesting dysregulated ribosome-associated quality control in LSCC. Within the ubiquitin-proteasome system itself, 9 E1/E2/E3 enzymes — including HUWE1, ITCH, and CUL4A — showed altered ubiquitination levels (Fig. 7–10). Notably, all identified ubiquitinated proteasome subunits were located in the 19S regulatory particle rather than the 20S core particle, with Rpn13 at K34 and Rpn10 at K40/K74 showing increased ubiquitination, suggesting impaired proteasome function as a hallmark of LSCC.
Conclusion
This study demonstrates that quantitative ubiquitylomics can identify disease-relevant ubiquitination events, reveal pathway-level dysregulation, and prioritize candidate biomarkers for therapeutic targeting. The same analytical framework underlies our service, scaled for higher throughput and extended to PROTAC-induced ubiquitination profiling.
Source
Zhan, X.; Lu, M.; Yang, L.; Yang, J.; Zhan, X.; Zheng, S.; Guo, Y.; Li, B.; Wen, S.; Li, J.; Li, N. Front. Endocrinol. 2022, 13, 970843. DOI: 10.3389/fendo.2022.970843.
Ubiquitylomics Analysis: Frequently Asked Questions
How many ubiquitination sites can you identify in a standard experiment?
In a standard experiment using 1–5 mg protein digest with K-ε-GG enrichment and Orbitrap LC-MS/MS, we typically identify 5,000–15,000 unique ubiquitination sites from 2,000–5,000 proteins.
Can you distinguish different ubiquitin chain linkage types?
Yes. Ubiquitin generates linkage-specific tryptic peptides that distinguish K48, K63, M1, K6, K11, K29, and K33 linkages. We report the relative abundance of each chain type.
What is the minimum sample amount required?
For comprehensive coverage we recommend 1–5 × 10⁷ cells or 20–100 mg tissue. Targeted analysis may use lower amounts.
How do you distinguish ubiquitination from other ubiquitin-like modifications?
Ubiquitination leaves a Gly-Gly remnant (+114.043 Da). NEDD8 and ISG15 leave different remnant masses. Our search includes all relevant Ubl modifications for specificity.
Can you profile PROTAC-induced ubiquitination?
Yes. Our workflow is designed for PROTAC-mediated ubiquitination profiling, identifying target-specific ubiquitination and off-target effects across the proteome.
References
- Zhan, X.; Lu, M.; Yang, L.; Yang, J.; Zhan, X.; Zheng, S.; Guo, Y.; Li, B.; Wen, S.; Li, J.; Li, N. "Ubiquitination-Mediated Molecular Pathway Alterations in Human Lung Squamous Cell Carcinomas Identified by Quantitative Ubiquitinomics" Front. Endocrinol. 2022, 13, 970843.
- Kim, W.; Bennett, E. J.; Huttlin, E. L.; Guo, A.; Li, J.; Possemato, A.; Sowa, M. E.; Rad, R.; Rush, J.; Comb, M. J.; Harper, J. W.; Gygi, S. P. "Systematic and Quantitative Assessment of the Ubiquitin-Modified Proteome" Mol. Cell 2011, 44, 325–340.
- Ordureau, A.; Münch, C.; Harper, J. W. "Quantifying Ubiquitin Signaling" Mol. Cell 2015, 58, 660–676.